
Abstract
Objectives
We aimed to prospectively investigate the benefit of using augmented reality (AR) for surgery residents learning aneurysm surgery.
Materials and methods
Eight residents were included, and divided into an AR group and a control group (4 in each group). Both groups were asked to locate an aneurysm with a blue circle on the same screenshot after their viewing of surgery videos from both AR and non-AR tests. Only the AR group was allowed to inspect and manipulate an AR holographic representation of the aneurysm in AR tests. The actual location of the aneurysm was defined by a yellow circle by an attending physician after each test. Localization deviation was determined by the distance between the blue and yellow circle.
Results
Localization deviation was lower in the AR group than in the control group in the last 2 tests (AR Test 2: 2.7 ± 1.0 mm vs. 5.8 ± 4.1 mm, p = 0.01, non-AR Test 2: 2.1 ± 0.8 mm vs. 5.9 ± 5.8 mm, p < 0.001). The mean deviation was lower in non-AR Test 2 as compared to non-AR Test 1 in both groups (AR: p < 0.001, control: p = 0.391). The localization deviation of the AR group decreased from 8.1 ± 3.8 mm in Test 2 to 2.7 ± 1.0 mm in AR Test 2 (p < 0.001).
Conclusion
AR technology provides an effective and interactive way for neurosurgery training, and shortens the learning curve for residents in aneurysm surgery.
Introduction
The global shortage of neurosurgeon is widely recognized [Citation1]. For example, the neurosurgeon to population ratio was approximately 1:220,000 in China [Citation2]. It takes about 3 years for a licensed doctor to finish the residential training in all specialties in China [Citation3]. If they want to become a qualified neurosurgeon, they need to complete a 48-month Neurosurgical Specialist Standardized Training Program after the residential training [Citation2]. Moreover, the cost of neurosurgery training is extremely high [Citation4]. Figuring out an effective educational plan and shortening the learning curve for neurosurgical residents is essential to meet the great demand.
A well-developed understanding of anatomical and spatial relationship between targets and surrounding structure in the nervous system is essential for the success of surgery. However, the process of relating radiological images with anatomical structures requires many years of deliberate training and practice, making it difficult to mentally interpret 2-dimensional images accurately. To address this issue, neurosurgery became an early adopter of AR technology, because it is a specialty heavily relies on medical image [Citation5]. AR technology merges physical reality and computer-generated objects in real time [Citation6]. The difference between virtual reality (VR) and AR lies in incorporating real-world environments. Unlike the completely synthetic environment generated by VR, AR provides additional information to the physical reality and enhances the user perception of it [Citation5,Citation6]. This is especially important for neurosurgeons, because the surgical field is often small and blocked by brain tissue. AR technology and a heads-up display (HUD) have recently been added to neuronavigation system to solve this problem. Lesions of interest and surrounding vascular structures can be directly visualized under the microscope during all surgical stages, from skin incision to resection, and satisfactory results have been noted [Citation7,Citation8]. This is even more important for minimally invasive approaches to avoid unnecessary manipulation.
However, the role of AR and HUD with respect to neurosurgery training have received much less attention as compared to their use in spine and brain tumor surgeries, based on publications from 2011 to 2021 [Citation9]. This might be because cadaver dissection and expert teaching has always been the primary methods of medical education. Compared to costly and time-consuming cadaver simulations [Citation10], an AR simulation provides trainees with an interactive way to deepen their understanding of neuroanatomy, and the training is easy to access. Previous studies used subjective scoring systems or questionnaires to evaluate the effectiveness of various neurosurgery training simulations; However, they lacked an objective assessment [Citation10,Citation11]. Naysayers may argue that young neurosurgeons’ reliance on a navigation system deprives them of developing spatial reasoning, and they are not able to operate without a navigation system.
Because the mini-pterional approach and the keyhole pterional approach are commonly used for middle cerebral artery (MCA) aneurysms at our institution. We decided to use MCA aneurysm cases as test materials to explore the usefulness of AR technology in shortening the learning curve of surgical residents in aneurysm surgery.
Materials and methods
Participants
A total of 8 first-year to fourth year neurosurgery residents from the department of neurosurgery at the same university hospital participated in the study. There were two residents from each year of training. These residents were defined as novices because they had performed or participated in < 5 aneurysm cases. To eliminate possible interfering factors, such as familiarity of intraoperative navigation in aneurysm surgery or prior knowledge of the exact aneurysm locations before the aneurysm localization tasks, none of the residents had previous experience with the use of intraoperative navigation for aneurysm clipping, or had participated in the aneurysm cases used in this study.
Random integers were generated by the Excel function RAND, and assigned to the residents. For each year of training, the resident with the larger number was assigned to the AR group, and the resident with the smaller number to the control group. The number of participants was deemed appropriate based on previous studies comparing the performance of participants with different training methods [Citation10,Citation12]. This study was approved by the Institutional Review Board of our hospital and complied with the Declaration of Helsinki Ethical Principles. Informed written consent was obtained from all participants. The participants and any identifiable individuals consented to publication of his/her image.
Aneurysm cases
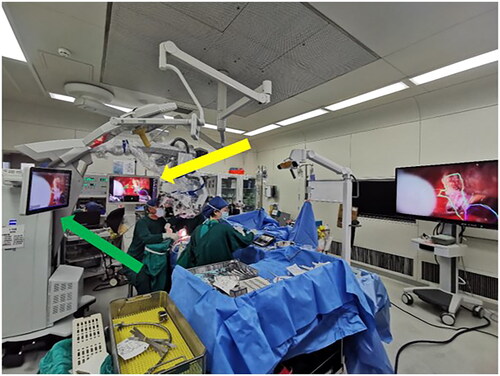
A total of 20 single intracranial saccular MCA bifurcation aneurysm cases of similar size (3 – 8 mm) suitable for clipping were selected for this study. All cases were operated on by the same senior neurosurgeon, with over 25 years of aneurysm surgery experience, between August 2021 and September 2022. We matched those aneurysm cases according to their aneurysm size, location, incision length, and craniotomy size to guarantee the consistency of the aneurysm localization task. Half of the patients were operated using AR assistance and HUD by the senior neurosurgeon, because the number of navigation device is limited, it was not available for all cases. For the AR-assisted aneurysm cases, preoperative surgical planning was performed using the Brainlab Elements workstation (Brainlab, Munich, Germany). Segmentations of the target aneurysm and surrounding vascular structure were performed using the Brainlab Smartbrush Function based on the three-dimensional (3D) time of flight magnetic resonance angiography (TOF-MRA) or computed tomography angiography (CTA). Intraoperative navigation was performed using the Brainlab Curve navigation system (Brainlab, Munich, Germany) based on the result of the preoperative surgical planning. The intraoperative registration and microscope integration were performed according to standard protocol (BRAINLAB CURVE SYSTEM AND TECHNICAL USER MANUAL Pdf Download | ManualsLib). After connecting the Brainlab Curve navigation system to the Zeiss Kinevo 900 (Carl Zeiss Meditec Inc, Dublin, California) correctly, HUD could be activated during multiple stages intraoperatively (). When HUD was activated, contours of the aneurysms and surrounding vascular structures could be seen under the microscope, which were represented by a solid or dashed outline. However, the projection of aneurysm contour was not continuous, the senior surgeon would choose to deactivated the HUD when the projection blocked the surgical view of vital structures intraoperatively.
Figure 1. Technical setup. Segmentations of the aneurysm and surrounding neurovascular structure were loaded into the Brainlab curve navigation system. HUD is a module in the navigation system. After connecting the Brainlab curve navigation system to the Zeiss Kinevo 900 (Carl Zeiss Meditec Inc, Dublin, California) correctly, HUD could be activated intraoperatively and contours of the aneurysm could be visualized under the microscope.
Yellow arrow: Brainlab Curve navigation system; green arrow: Zeiss Kinevo 900.
Each operation was recorded from skin incision to aneurysm clipping. Each patient was informed that the operation was going to be recorded and gave consent.
Image viewing period before the aneurysm localization task
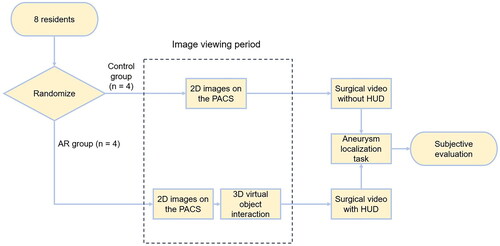
The study design was shown as following (). The image viewing period was used for training of visuospatial reasoning and preparation before the aneurysm localization task.
Figure 2. Study design. After randomization, residents were divided into the AR group and the control group. Image viewing period was limited to 20 min. During this period, the control group was allowed to view all 2D images of the aneurysm case, whereas the AR group was equipped with the Magic Leap One and could interact with 3D virtual objects besides viewing 2D images. After the aneurysm localization task started, participants were asked to watch the same surgical videos of non-AR-assisted cases. For AR-assisted cases, the AR group could visualize HUD in the AR-assisted surgery videos, while the control group could not, because the frames with the HUD were deleted in the videos they viewed. Then participants in both groups completed the same aneurysm localization task.
Participants in both groups were allowed to view aneurysm images, including computed tomography (CT), magnetic resonance imaging (MRI), digital subtraction angiography (DSA) and 3D TOF-MRA before every aneurysm localization test. Two dimensional (2D) display of the 3D mesh model of neurovascular structures based on CT and MRI on the PACS (picture archiving and communication system) were also available to both groups.
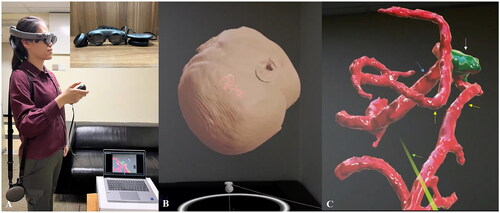
However, residents in the AR group were equipped with an immersive AR-headset Magic Leap One (Magic Leap Inc., Plantation, FL, USA). Besides conventional image viewing, the AR group could interact with the 3D virtual objects segmented in the Brainlab platform by using Brainlab Mixed Reality Viewer (Brainlab, Munich, Germany) on the Magic leap One. Computer-generated holographic displays of the targeted aneurysm and surrounding neurovascular structure could be visualized through the Magic Leap One. With the controller, residents could rotate or enlarge the object in the physical world or even walking ‘inside the 3D object’ to get a deeper understanding of the anatomy ().
Figure 3. (A) One Of the participants using Magic Leap One to visualize the computer-generated objects overlayed on real structures. Magic Leap One is consisted of 3 elements: a light pack, a headset, and a controller. The participant uses the controller to manipulate the objects to complete their mental picture of the target aneurysm and the operative field. (B, C) a holographic display of a patient’s head, the aneurysm, and surrounding vasculature are shown to simulate the position in the operating room.
White arrow: aneurysm; yellow arrow: M2 branch; blue arrow: M1; green arrow: laser projecting from the controller.
All participants were allowed to view images (3D model interaction included) for 20 min before the localization test started.
Aneurysm localization task
Once the image viewing period (including 2D and 3D images) was finished, the test was considered to have started. When the participants finished drawing the blue circle to localize the targeted aneurysm, the test was considered to have stopped. The participants were allowed to review the images during the test. However, once the case started, the reviewing time was also included in the test time.
Videos of the aneurysm surgeries from opening the dura to confirming the vasculature of the MCA before exposing the aneurysm were shown to the participants. Both groups watched the same video clips in the same order (the first 5 non-AR-assisted cases were ‘non-AR Test 1’, 5 AR-assisted cases were ‘AR Test 1’, the next 5 AR-assisted cases were ‘AR Test 2’ and the last 5 non-AR-assisted cases were “non-AR Test 2”). The AR group could visualize HUD in the AR-assisted surgery videos, while the control group could not, because the frames with the HUD were deleted in the videos they viewed. Noteworthy, residents could not control when the HUD could be visualized, because it was activated at the discretion of the senior neurosurgeon intraoperatively. Residents in both groups were asked to localize the target aneurysm by drawing a blue circle on the screenshot right before the aneurysm was exposed. After reviewing the unedited surgical videos, the actual location of the aneurysm was labeled by an experienced attending surgeon (over 18 years of aneurysm surgery experience) who assisted in the surgeries, with a yellow circle on the same screenshot. The actual location was revealed to the participants after every case.
The learning curve
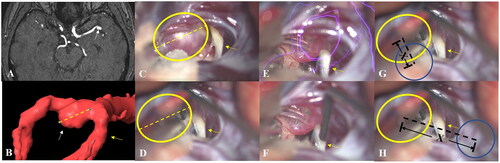
The learning curve was assessed by measuring the aneurysm localization deviation. The localization deviation was determined by comparing the distance between the actual and marked location of the aneurysm. Because it is not measured intraoperatively, the distance was compared to the size of the aneurysm, so that the actual length could be revealed. Segmentation of the aneurysm was performed on the Brainlab workstation, and measured on the same angle and position in the surgical video when it was fully exposed. In this way, the size of the aneurysm could be measured using the Brainlab Ruler Function (). The videos of non-AR Test 1 were used to determine differences in the understanding for anatomy and vasculature between the 2 groups. The final non-AR-assisted videos were used to determine if the localization deviation between the groups differed after training. The test time of each aneurysm case was recorded for every resident. The measurement of test time was used to compare the speed of spatial reasoning between the AR group and control group.
Figure 4. (A) Magnetic resonance angiography (MRA) of an aneurysm case. (B) The size of the aneurysm was measured with the Brainlab workstation at the same angle and position as it was in the surgery video. (C) Both the aneurysm and the M2 branch of the MCA were fully exposed, and the spatial relation between them was shown. (D) The size and location of the aneurysm was confirmed by the attending surgeon with a yellow circle on the screenshot right before the aneurysm was exposed. (E) The AR group could see the HUD while watching the surgical videos, whereas the control group could not (F). Likewise, participants in the AR group (G) and control group (H) were asked to draw a blue circle on the same screenshots. The actual location of the aneurysm was revealed to the participants after every case. Aneurysm localization deviation was determined by the distance “X” between the centers of the blue and yellow circle by comparing it to the size of the aneurysm.
White arrow: aneurysm; yellow arrow: M2 branch; yellow dashed line: size of the aneurysm; yellow circle: localization of the aneurysm by the attending surgeon; purple circle: HUD of the aneurysm; blue circle: localization of the aneurysm by the participants; black dashed line: aneurysm localization deviation.
Subjective evaluation after the aneurysm localization tests
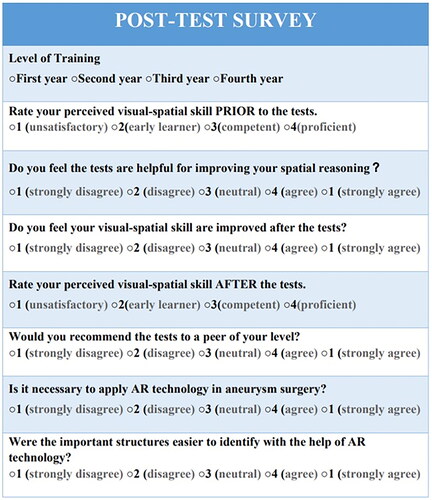
Subjective evaluation was performed using an electronic survey. After finishing the aneurysm localization tests, the electronic survey was sent to both groups. The electronic survey can be completed from mobile phones and computers (). Participants were asked to answer questions according to their own experience. Participants in the control group were able to visualize the computer-generated holographic displays of the aneurysm using Magic Leap One, and watch the videos with AR projections before completing the survey. Participants in the AR group were asked to watch the videos previously watched by the control group. This allowed both groups to compare their mental interpretation process of 2D images with and without the help of AR technology.
Figure 5. An electronic survey sent to participants after the aneurysm localization tests were completed.
Statistical analysis
Statistical analysis was performed using SPSS version 22.0 software. Normally distributed data were reported as mean ± standard deviation. The significance of intergroup differences was tested using the paired t-test. Differences of localization deviation and test time between tests in each group were assessed using the Student’s t-test. All analyses were 2-tailed, and a value of p < 0.05 was considered statistically significant.
Power analysis of the 2-tailed paired t-test was performed using the software G*Power (Universität Düsseldorf: G*Power (hhu.de)). Type I error rate was set at 0.05. Total sample size was 20, because altogether 20 aneurysm cases were included in this study. Effect size was determined by the following equation: (mean localization deviation of the AR group – mean localization deviation of the control group)/SD of the control group.
Results
Characteristics of included aneurysm cases
There was no difference in aneurysm size (5.1 ± 1.4 vs. 6.2 ± 3.0 mm, p = 0.316), incision length (9.2 ± 2.2 cm vs. 10.4 ± 2.1 cm, p = 0.20), and craniotomy size (15.3 ± 4.6 cm2 vs. 18.6 ± 5.1 cm2, p = 0.15) of the aneurysms between those operated with and without AR assistance. With AR-assistance it took 22 ± 12 min from dissecting the subarachnoid cisterns to clipping the aneurysms, whereas the mean microscope usage time of aneurysm cases without AR-assistance was 32 ± 9 min (p = 0.064). The similar aneurysm size, incision length, and craniotomy size of the cases in the 2 groups guaranteed the consistency of the aneurysm localization task for participants.
Comparison of aneurysm localization deviation
Localization deviation was determined by the distance between the actual and marked location of the aneurysm. Localization deviation is correlated with the understanding of neuroanatomy and spatial reasoning. A change of localization deviation reflects a change of visual-spatial skills. The mean localization deviations from the first to the last test for the AR group were 9.2 ± 8.0 mm, 8.1 ± 3.8 mm, 2.7 ± 1.0 mm, and 2.1 ± 0.8 mm, respectively, the values in the control group were 7.5 ± 6.1 mm, 6.9 ± 6.9 mm, 5.8 ± 4.1 mm, and 5.9 ± 5.8 mm (). No significant difference was found between the 2 groups for the first 2 tests (non-AR Test 1: p = 0.19, AR Test 1: p = 0.09). This indicated that the visual-spatial skills of both groups were at a similar level before the test. The largest localization deviation of both groups was in Test 1. Localization deviation was lower in the AR group than in the control group in the last 2 tests (AR Test 2: p = 0.01, non-AR Test 2: p < 0.001, ).
Figure 6. Aneurysm localization deviation of the control group and AR group. Blue dots represent localization deviation of the control group, while orange dots represent localization deviation of the AR group. * p ≤ 0.05, ** p ≤ 0.01, *** p ≤ 0.001.
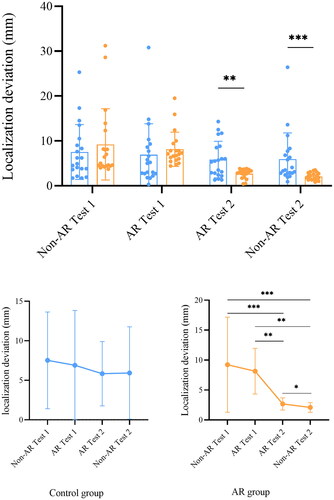
Table 1. Summary of deviation of the aneurysm localization task.
The mean localization deviation was lower in non-AR Test 2 compared to AR Test 2 in both groups (); but only the deviation of the AR group reached statistical significance (control: p = 0.41; AR: p < 0.001). Although there was a trend of localization deviation decline in both groups, the change of localization deviation was statistically insignificant in the control group, whereas differences were significant in the AR group, except for the difference between non-AR Test 1 and AR Test 1 (p = 0.587). The greatest decrease of localization deviation occurred after Test 2 in the AR group, in which the localization deviation decreased from 8.1 ± 3.8 mm in AR Test 1 to 2.7 ± 1.0 mm in AR Test 2 (p < 0.001). The localization accuracy of the AR group was moderately improved as compared to the control group. The effect size was 0.66 and the power (1 - β) of the study was 0.871 for the localization deviation comparison between the two groups.
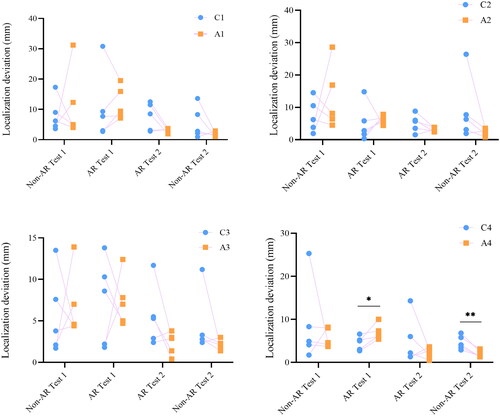
Intergroup comparison of aneurysm localization deviation of residents with the same training years was performed (). In the AR-Test 1, localization deviation of the fourth-year resident in the AR group was significantly higher than that of the control group (7.00 ± 1.81 Vs. 4.50 ± 1.63, p = 0.036). However, in the non-AR Test 2, localization deviation of the fourth-year resident in the AR group was significantly lower than that of the control group (4.62 ± 1.63 Vs. 1.96 ± 0.80, p = 0.005). Although no statistical difference was found between the other residents, a trend could be seen that the localization deviations of the residents in the AR group were progressively lower than that of the control group.
Intragroup difference was also performed. However, no significant difference of localization deviation was found between the residents of different training years in the AR group or in the control group in the above-mentioned tests.
Figure 7. Comparison of aneurysm localization deviation between residents. Blue dots represent localization deviation of residents in the control group, while orange dots represent localization deviation of residents in the AR group. * p ≤ 0.05, ** p ≤ 0.01.
Comparison of test time
The speed of performing spatial reasoning was examined by test time (). Additional information provided by AR technology can also cause cognition overload, and increase test time. The test time of the AR group was longer than that of the control group for AR Test 1 and non-AR Test 2 (AR Test 1: p = 0.003; non-AR Test 2: p = 0.009). Similar trends of the test time were found in the AR group and the control group in different test periods (). The longest test time in both groups was for AR Test 1, and the time was significantly different from that of non-AR Test 1 (Control: non-AR Test 1 vs. AR Test 1: p < 0.001; AR: non-AR Test 1 vs. AR Test 1: p < 0.001). In both groups, there was no significant difference of test time between non-AR Test 1 and non-AR Test 2 (Control: p = 0.89; AR: p = 0.22).
Figure 8. Test time of the aneurysm localization tasks of the AR group and control group. Blue dots represent test time of the control group, while orange dots represent test time of the AR group. * p ≤ 0.05, ** p ≤ 0.01, *** p ≤ 0.001.
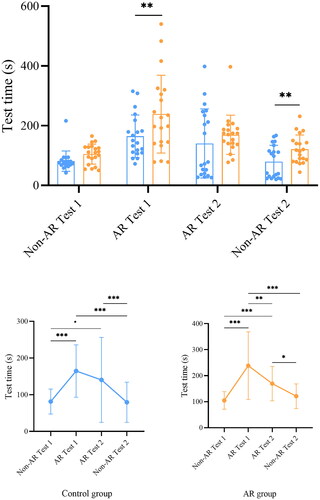
Table 2. Summary of test time of the aneurysm localization task.
Subjective self-assessment and evaluation of the tests
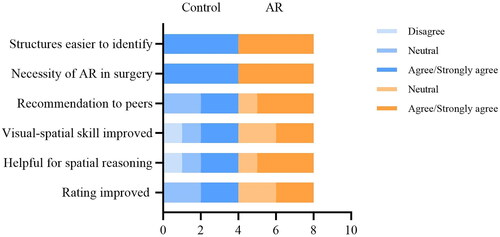
All participants agreed or strongly agreed that structures were easier to identify with a HUD, and believed that it is necessary to apply AR technology in aneurysm surgery. The AR group was more likely to recommend aneurysm localization tests with AR assistance, whereas half of the participants in the control group chose not to recommend the tests to their peers, because the tests they took were without AR assistance, thinking it might not be helpful for improving spatial reasoning. Even though 75% of the participants in the AR group agreed that the AR technology was helpful for spatial reasoning, only half of them thought their visual-spatial skill was improved. The first-year resident in the control group argued that AR technology was not helpful in improving spatial reasoning, and it did not improve his visual-spatial skill (). Those who took a neutral attitude toward the AR technology were either first year or second-year residents.
Figure 9. Results of the electronic survey. The blue bar represents the choices of the control group, while the orange bar represents the choices of the AR group.
Discussion
In this study, we aimed to explore the perceived value of AR technology in neurosurgery training by comparing aneurysm localization performance of residents who used AR technology and those who did not. The AR group was found to perform better and their visual-spatial skills improved faster than the control group, even though participants in both groups had a similar understanding of neuroanatomy and spatial reasoning before the tests. After training with the AR assisted aneurysm cases, the AR group showed moderately lower localization deviation than the control group, even without AR assistance. The results of this study show the efficiency and effectiveness of AR technology in neurosurgery training, as it shortens the learning curve for residents. Precise localization is a prerequisite for successful clipping, because excessive manipulation may result in intraoperative aneurysm rupture and vascular damage. Notably, the intraoperative rupture rate was reported to decrease from approximately 11% to 5%, and mortality rate from 27.4% to 0% [Citation13] as the surgeons gained more experience. The implementation of AR technology in the training program is beneficial for surgery residents learning aneurysm surgery.
The aneurysm localization task was useful to identify changes in the participants’ performances, and the findings were corresponded to Kolb’s learning cycle, which states that “Knowledge results from the combination of grasping and transforming experience” [Citation14]. Kolb’s theory is based on the assumption that people learn from their experiences, and that contributes to professional knowledge. The first test was to provide participants with opportunities to understand and learn by doing the task. After residents engaged in the task to localize the aneurysms, they learned by experience, and their answers were compared with the actual location marked by an expert. This allowed them to reflect on what they did well and what did not go so well, which highlights the importance of reflective observation. The timely feedback helped participants combine their previous knowledge with new interactive information. This reflection on experience often results in abstract conceptualization that shapes the mental translation of 2D images to 3D anatomical structures for residents. New understandings were therefore generated and their spatial reasoning was improved. Active experimentation was then performed to verify their mental picture of aneurysms in the following tests. The aneurysm localization test provides the participants with a riskless platform where they can refine their visuospatial skills through harmless repetition.
Compared to the control group, the AR group had lower localization deviation and a greatly reduced learning curve. The AR and HUD provided the residents with interactive information so that they could simultaneously compare their mental image with the patient-specific HUD image. Moreover, AR and the HUD revealed 3D structures covered or blocked by parenchyma, which helped complete the residents’ visuo-spatial imagination beyond the exposed anatomical structures. It may take years of observation and practice to perform spatial reasoning quickly and accurately. Yet, the residents in this study already made progress in localizing aneurysms after 4 tests. This illustrates the usefulness of AR assistance in neurosurgery training, which is in accordance with previous studies where AR improved performance in choosing the optimal surgical path [Citation15]. Once the visuo-spatial relation between images and anatomy was established, the AR group maintained a high level of performance in aneurysm localization tests, and the decrease of localization deviation became slower. Noteworthy, test time in the AR group was longer than the control group in half of the tests. This might be partially because co-locating spatial reconstruction with AR images required extra mental resources, and cognitive overload resulted in a longer test time. Differences in the conceptual understanding of anatomy and vasculature between participants may also result in test time differences. However, as participants became more familiar with AR, the time to complete the tasks became shorter, and test time may be further shortened as the AR group takes more tests.
Despite the many benefits that AR technology brings, Antonio Bernardo argued that residents’ excessive reliance on neuronavigation system may deprive them of opportunities to practice spatial reasoning abilities [Citation16]. Worries such as “young neurosurgeons are unable to operate without the navigation system” are easy to understand. Neuronavigation device and application accuracy are crucial, and registration error of intraoperative navigation can result in a deviation from targets [Citation17]. The reliance on a navigation system without thinking can also lead to cognitive decline. However, our results showed that residents in the AR group maintained better performance than the control group even without AR assistance in the last test.
This is because the study design of this study minimizes the residents’ reliance on neuronavigation by watching surgical videos with HUD. Because the HUD was activated at the discretion of the senior neurosurgeon, the participants could not control when the HUD could be visualized, which is different from the conventional use of intraoperative navigation. In this way, their mental process would focus on combining the information obtained during the image viewing period and watching surgical videos, instead of memorizing where the HUD was during the aneurysm localization task. The visuospatial reasoning is properly trained in this way and reinforces the importance of AR technology in resident training.
Recent advances such as the AR and artificial intelligence (ARAI) surgical navigation system (Chicago, Illinois, USA, http://holosurgical.com/.) can track the surgeon’s head and project hologram-like 3D anatomical images onto the patient’s skull from the surgeon’s point of view so that the hologram perfectly co-locates with the patient’s anatomy and surgical position [Citation16]. Gasco et al. claimed that “Cadaver simulations accrued the highest reported benefit” based on the performance of 6 residents [Citation10], and cadaver training is reported to be the most common method of neurosurgery training [Citation18]. However, the value of conventional cadaver dissection does not eliminate the immense benefits that AR technology brings. A patient-specific HUD strengthens the visuo-spatial reasoning for trainees during multiple stages preoperatively and intraoperatively. Compared to costly and time-consuming conventional simulations, the potential teaching capabilities of AR-related techniques should not be ignored with regard to neurosurgery training, and could be a powerful supplement for limited operation experience and caseload for novices.
A strength of this study is that the tasks were surgically relevant, and there were quantitative parameters for determining improvement. Repetitive training and timely feedback with interactive information could be adopted as a paradigm in neurosurgery training. Objective clinical evaluation has proved the feasibility of AR technology in medical education. A limitation of this study is the number of participants was small, and there was no long-term follow-up. However, based on the results of this study, we strongly believe that the use of AR technology greatly reduces the learning curve for residents. To make an excellent neurosurgeon, a deep understanding of neuroanatomy and anatomic variants is necessary. But other skills such as depth perception, instrument handling, and bimanual dexterity are also essential [Citation19], and simulations where trainees can refine their surgical skills through harmless repetition in a virtual environment may also be available with the development of AR technology. Hopefully, AR technology will become an indispensable component in neurosurgery training and lead to a great reduction in the cost of medical education.
Conclusion
AR technology provides a convenient and effective way for neurosurgery training, and shortens the learning curve for residents in aneurysm surgery.
Acknowledgements
We would like to thank Siqi Ou, Guofeng Zhang, Linfeng Liu, Lu Bai, Luoxi Su and Beichuan Zhao for their participation in the study. Furthermore, we wish to express our gratitude to Professor Tiewei Qi for permitting the recording of his aneurysm surgeries, which served as invaluable test materials in the study.
Disclosure statement
No potential conflict of interest was reported by the author(s).
Additional information
Funding
References
- Dewan MC, Rattani A, Fieggen G, et al. Global neurosurgery: the current capacity and deficit in the provision of essential neurosurgical care. Executive summary of the global neurosurgery initiative at the program in global surgery and social change. J Neurosurg. 2018;130(4):1–12. doi: 10.3171/2017.11.JNS171500.
- Xu T, Evins AI, Lin N, et al. Neurosurgical postgraduate training in China: moving toward a national training standard. World Neurosurg. 2016;96:410–416. doi: 10.1016/j.wneu.2016.09.034.
- Wang J, Zhang Y. Training neurosurgeons in China. Lancet Neurol. 2020;19(12):971–972. doi: 10.1016/S1474-4422(20)30400-2.
- Garba DL, Fadalla T, Sarpong K, et al. Access to training in neurosurgery (part 2): the costs of pursuing neurosurgical training. Brain Spine. 2022;2:100927. doi: 10.1016/j.bas.2022.100927.
- Tagaytayan R, Kelemen A, Sik-Lanyi C. Augmented reality in neurosurgery. Arch Med Sci. 2018;14(3):572–578. doi: 10.5114/aoms.2016.58690.
- Shuhaiber JH. Augmented reality in surgery. Arch Surg. 2004;139(2):170–174. doi: 10.1001/archsurg.139.2.170.
- Mascitelli JR, Schlachter L, Chartrain AG, et al. Navigation-linked heads-up display in intracranial surgery: early experience. Oper Neurosurg (Hagerstown). 2018;15(2):184–193. doi: 10.1093/ons/opx205.
- Carl B, Bopp M, Benescu A, et al. Indocyanine green angiography visualized by augmented reality in aneurysm surgery. World Neurosurg. 2020;142:e307–e315. doi: 10.1016/j.wneu.2020.06.219.
- Cannizzaro D, Zaed I, Safa A, et al. Augmented reality in neurosurgery, state of art and future projections. A systematic review. Front Surg. 2022;9:864792. doi: 10.3389/fsurg.2022.864792.
- Gasco J, Holbrook TJ, Patel A, et al. Neurosurgery simulation in residency training: feasibility, cost, and educational benefit. Neurosurgery. 2013;73(Suppl 1):39–45. doi: 10.1227/NEU.0000000000000102.
- Bruening DM, Truckenmueller P, Stein C, et al. 360 Degrees 3D virtual reality operative video for the training of residents in neurosurgery. Neurosurg Focus. 2022;53(2):E4. doi: 10.3171/2022.5.FOCUS2261.
- Layard Horsfall H, Salvadores Fernandez C, Bagchi B, et al. A sensorised surgical glove to analyze forces during neurosurgery. Neurosurgery. 2023;92(3):639–646. doi: 10.1227/neu.0000000000002239.
- Inci S, Karakaya D. Intraoperative aneurysm rupture: surgical experience and the rate of intraoperative rupture in a series of 1000 aneurysms operated on by a single neurosurgeon. World Neurosurg. 2021;149:e415–e426. doi: 10.1016/j.wneu.2021.02.008.
- Kolb DA. Experiential learning: experience as the source of learning and development. New Jersey: FT Press; 2014.
- Abhari K, Baxter JS, Chen EC, et al. Training for planning tumour resection: augmented reality and human factors. IEEE Trans Biomed Eng. 2015;62(6):1466–1477. doi: 10.1109/TBME.2014.2385874.
- Bernardo A. Virtual reality and simulation in neurosurgical training. World Neurosurg. 2017;106:1015–1029. doi: 10.1016/j.wneu.2017.06.140.
- Grunert P, Darabi K, Espinosa J, et al. Computer-aided navigation in neurosurgery. Neurosurg Rev. 2003;26(2):73–99. discussion 100-101. doi: 10.1007/s10143-003-0262-0.
- Stengel FC, Gandia-Gonzalez ML, Aldea CC, et al. Transformation of neurosurgical training from "see one, do one, teach one" to AR/VR & simulation - a survey by the EANS young neurosurgeons. Brain Spine. 2022;2:100929. doi: 10.1016/j.bas.2022.100929.
- Doyle JD, Webber EM, Sidhu RS. A universal global rating scale for the evaluation of technical skills in the operating room. Am J Surg. 2007;193(5):551–555; discussion 555. doi: 10.1016/j.amjsurg.2007.02.003.