
ABSTRACT
Species Distribution Models (SDM) play an essential role in establishing factors affecting honeybee species spatial population distribution and ensuring effective niche habitat protection. This study aimed to assess the precision of the triangulation bee lining technique in locating Apis mellifera scutellata colonies within wild habitats, locate A. m. scutellata colony site population distribution and develop a predictive model of A. m. scutellata habitat suitability using SDM algorithms within Hurugwe Safari Area (HSA)-Rifa section, northern Zimbabwe. A survey of A. m. scutellata was carried out between February and October 2019. The triangulation bee lining technique was used to track wild bees to their colony sites. The bee lining technique was evaluated to assess its precision in locating honeybee colonies. Ensemble models were used to develop a predictive suitability niche ecosystem for A. m. scutellata nesting sites. The study located wild honeybee colonies using the triangulation bee lining technique with an 18% accuracy. Bee colonies were found at a mean distance of 27.7 m ± 2.06 from triangulated points. The predicted suitable areas were primarily areas close to the water sources and low-lying areas. The study recommended the use of the triangulation honeybee hunting method in locating wild honeybee colonies for research purposes, wild bee colony inspection for pests and diseases and sustainable organic honey collection.
Introduction
Evidence of the ancient association of bees, honey and humankind is engraved in rock paintings across sub-Saharan Africa (Chitesa, Citation2014; Isack & Reyer, Citation1989). The association between honeybees and humankind continued in the 21st century worldwide (Chitesa, Citation2014; Human et al., Citation2013; Spottiswoode et al., Citation2016). The relationship between honeybees and human beings has been changing due to improved technology, and an improved understanding of the honeybees ecology and biology. Honey hunting involves the collection of honey from wild honeybee colonies for economic and social reasons (Fikadu, Citation2019; Joshi & Gurung, Citation2005; Marshman et al., Citation2019), including meeting food, scientific, and recreational needs (Chitesa, Citation2014). Honey hunting contributes to supplying economic, cultural, spiritual, and social needs in Nepal (Guerin, Citation2020; Joshi & Gurung, Citation2005). Hunting and gathering honey are some of the ancient human activities which date back to around 8, 000 BC (Human et al., Citation2013). The old and new honeybee hunting techniques involve: (1) random searches, (2) animal guides, e.g., greater honeyguides (Indicator indicator), falcons (Falconiformes), dogs (Canis lupus familiaris) and cormorants (Phalacroco racidae) (3) tracking beelines, (4) triangulation, and Ecological Niche Modelling (Human et al., Citation2013; Spottiswoode et al., Citation2016). The random search technique is thought to have started during the Iron Age period (Spottiswoode et al., Citation2016). The technique employs simple random searches of bee colonies in different places of the landscape, including on standing trees, fallen logs, tree branches, anthills, rock cracks or any opening which could be a potential nest site for honeybees (Human et al., Citation2013; Spottiswoode et al., Citation2016). However, the random search technique depends on luck, so it has limited chances of success.
The use of honeyguides also emerged during the iron age as a complementary and alternative traditional honey hunting method (Spottiswoode et al., Citation2016). Birds like these honeyguides were used to ensure honey hunting efficiency and this method capitalised on the mutual relationship between humans and wild birds. Honeyguides lead human honey hunters to honeybee colonies in wild ecosystems. The use of honeyguides is a rare mutual foraging relationship between humans and free-living bee hunting birds (Spottiswoode et al., Citation2016). To date, the Hadza tribe from Tanzania and Boran tribe from Kenya reliably use honeyguides for hunting honey in the wild (Wood et al., Citation2014). A study in Mozambique revealed that 30 colonies in 72 transects were located using the honeyguide (Spottiswoode et al., Citation2016). The mechanisms explaining the honeyguide-humans relationship depend on humans’ ability to subdue honeybees and open nests using fire and tools. Once open, the honeyguide can access and eat the exposed honey and beeswax. As a result, a mutual solid foraging relationship developed between humans and honeyguides in wild ecosystems (Ernst, Citation2016; Spottiswoode et al., Citation2016). Honeybee hunters in unfamiliar places take an average of 9 hours to locate a honeybee nest, however when guided by honeyguides they could take three (3) hours (Spottiswoode et al., Citation2016).
Experienced honey hunters and scientists commonly practise tracking beelines in honey hunting (Guerin, Citation2020). A beeline is the flight path followed by foraging honeybees to and from their colonies to a rewarding forage site collecting the food to the nest (Ernst, Citation2016; Seeley, Citation1982). Forager honeybees not only remember and visit a source of food multiple times but also effectively communicate with dance to inform their mates about the source of food. As long as the food is still present, worker bees remember the place, and they use almost the same beeline directly to the food source. For example, one worker bee can make approximately seven (7) trips along the same beeline in a day to a food source located 1.0 km away from the colony. Thus, trained observers can find beelines connecting the nest and the food source (Ernst, Citation2016; Seeley, Citation1982). The honey hunter then searches bee colonies along the beeline (Ernst, Citation2016; Seeley, Citation1982). However, bee hunting via the beeline technique can be time-consuming, requires patience, and in some cases, a hunt can miss the nest altogether. The beeline tracking technique is often replaced with the triangulation technique whereby two geographical locations are used to find the third unknown geographical location based on geometry theory (Spottiswoode et al., Citation2016). For example, a simple bee lining technique using honeyguides was used with 81.1% accuracy in honey hunting in Niassa National Reserve, Mozambique (Spottiswoode et al., Citation2016). In addition, the triangulation technique is time-serving because it estimates the near-exact coordinates of the bee colony site.
In the past two decades, the quest to comprehend drivers of the spatial distribution of species has led to the rapid evolution of a family of models known as Species Distribution Models (SDMs), e.g., Boosted Regression Model (J, H Elith et al., Citation2006), Ecological Niche Factor Analysis (Hirzel et al., Citation2002; Rinnan & Lawler, Citation2019), Generalized Linear and Generalized Additive Models (Guisan et al., Citation2002), MAXENT (Ma & Sun, Citation2018; Phillips et al., Citation2006), and others. SDMs associate species occurrence data (presence data at known geocoded locations) with environmental predictor variables (J, H Elith et al., Citation2006; Makori et al., Citation2017) to estimate the likelihood of the species occurrence (Guisan & Thuiller, Citation2005; J, H Elith et al., Citation2006; Ma & Sun, Citation2018; Pearce & Boyce, Citation2006). The output is probability-based habitat suitability maps (Engler et al., Citation2004; Franklin, Citation2009; Guisan & Thuiller, Citation2005; Guisan & Zimmermann, Citation2000; Kumar & Stohlgren, Citation2009; Phillips et al., Citation2004). The areas predicted as suitable habitats show the species’ fundamental niche and the species’ potential distributional areas (Anderson & Martinez-Meyer, Citation2004; Gill & Sangermano, Citation2016; Ma & Sun, Citation2018; Makori et al., Citation2017). The SDM technique can also be used in honey hunting (Joshi & Gurung, Citation2005).
The study focused on locating A. m. scutellata colonies in the wild using the triangulation bee hunting technique. A. m. scutellata sub-species is native to the Zambezi Valley, Zimbabwe (Chakuya et al., Citation2022). This sub-species makes large colonies in varied nests, including rock crevices, disserted burrows, dead and living tree hollows/curves, and sometimes on open tree branches (Chitesa, Citation2014; Spottiswoode et al., Citation2016). Apis mellifera is generally known to be a cavity-nesting honeybee. The A. m. scutellata makes honey, has beeline behaviour and is defensive (Chitesa, Citation2014; Joshi & Gurung, Citation2005). A. m. scutellata is well distributed within Southern Africa and most parts of Zimbabwe’s protected and agro-based ecosystems (Chakuya et al., Citation2022; Chitesa, Citation2014). Honeybee colony trading is very minimal in non-protected areas and is discouraged as a means to control pests and diseases outbreak. A. m. scutellata tends to swarm if there are high habitat and ecological disturbances (Chakuya et al., Citation2022; Chitesa, Citation2014). There is a high possibility of honeybee movement between Zambia and Zimbabwe considering that HSA-Rifa (Zimbabwe) lies adjacent to Zambian communal areas. Wild honeybees’ population distribution within the HSA-Rifa section is not known and factors affecting their distribution are not well understood. There is a great need to study wild honeybee ecology and its adaptation to the myriad of challenges. Effective wild honeybee hunting techniques enable easy and quick location of wild honeybee colonies thus enabling effective protection and conservation. Effective honeybee hunting techniques enable easy inspection of pests and diseases from wild honeybee colonies (Schouten et al., Citation2020). The main aim of the study was to assess the triangulation bee hunting technique and to assess the potential honeybee habitat within the HSA-Rifa section. The specific objectives of the study were to: (i) assess the precision of triangulation bee lining technique in locating A. m. scutellata colonies, (ii) locate A. m. scutellata colony site population distribution using bee lining triangulation technique, and (iii) develop a predictive model of A. m. scutellata nest suitability using SDM algorithms. The management implication of this study is probably threefold. Firstly, the study can be used as a basis for improving honeybee hunting to ensure the protection of colonies and continued research and monitoring of such colonies. Secondly, the study can be used for consideration of organic honey production within protected areas and help to establish suitable habitats with the potential to provide good nests for honeybees.
Materials and methods
Study area
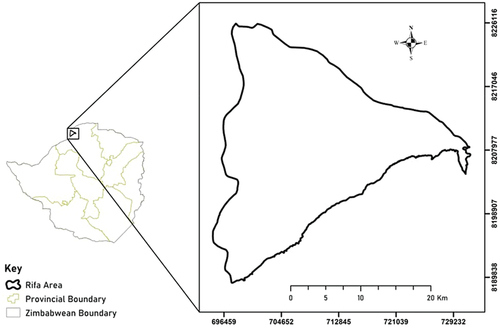
HSA-Rifa section lies within the Mid Zambezi valley of Zimbabwe covering approximately 619 km2 and is located between 16° 6’ 59.76” S and 29° 9’ 47.52” E (). The relief varies from low altitude (Zambezi flood plain – 350 m above sea level) to high altitude (Zambezi escarpment – 1050 m above sea level) with sparse dendritic river network draining water from the Zambezi escarpment into Zambezi River (Chakuya et al., Citation2021; Dunham, Citation1988). The area receives ~650 mm of precipitation in the form of rainfall between November and April. However, the rainfall is unreliable, and recurring droughts are common (Chakuya et al., Citation2021; Dunham, Citation1988). Mean minimum temperature ranges from 9°C in July to 22°C in December and the mean maximum temperature ranges from 15°C in July to 30°C in December (Chakuya et al., Citation2021). Humidity is high in the rainy season, especially between November and January, and no frost has been recorded below the Zambezi escarpment (Chakuya et al., Citation2021; Dunham, Citation1992). Mopane woodland dominates areas below the Zambezi escarpment, with open forest and scattered baobab trees; areas above the escarpment have Brachystegia species (Chakuya et al., Citation2021; Dunham, Citation1988; Guy, Citation1977). The area is endowed with several angulates, elephants (Loxodonta africana), fish, birds, and many insect species.
Figure 1. Location map of Hurungwe Safari Area-Rifa section in Hurungwe district, northern Zimbabwe.
Research design and sampling procedure
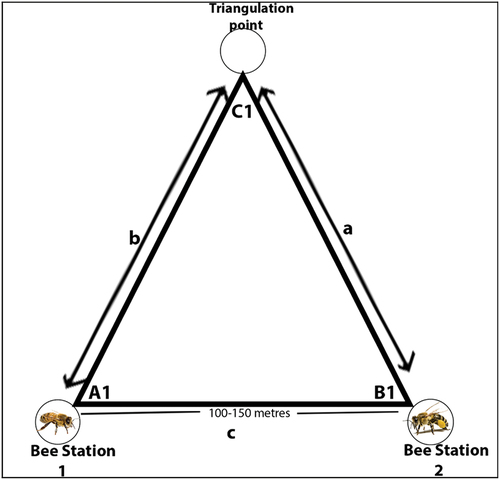
A stratified purposive sampling design was used and twenty transects with a stretch of 5 km were sampled. HSA-Rifa was divided into four study strata classified according to their geographical location and relief characteristics. The strata were (1) the Zambezi escarpment area (mainly the mountainous range), (2) the valley floor area (low lying area), (3) the floodplain area (areas along the Zambezi River), and (4) riverine areas (areas including water pans and rivers other than Zambezi River). Sampling in each transect was done at a one (1) km interval (there were 5 bee stations per transect with each station having two (2) bee lining stations). Bee lining techniques were adopted in sampling. Bee lining is defined as the practice of following honeybees back to their nest to locate a bee colony (Ernst, Citation2016; Seeley, Citation1982; Spottiswoode et al., Citation2016; Visscher & Seeley, Citation1982). A bee lining station was defined as a point from which bees were observed feeding on a natural or artificial feed source (). A total of two hundred bee lining stations were set. A bearing of the bee flight path back to the nest site from the bee station was collected using Garmin® eTrex® Global Positioning System (GPS) compass. AutoCAD 2007 software and QGIS 3.16.0 with GRASS 7.8.4 software were used to generate triangulation points based on beeline bearing. Some bee stations were adjusted by (±20 m) in areas where the terrain was not suitable to stand while collecting data (Ernst, Citation2016; Visscher & Seeley, Citation1982), to improve data collection, some bee stations were adjusted with (±20 m).
Figure 2. Bee sampling stations and triangulation point set up.
Data Collection
Honeybees were baited using simple sugar syrup (sugar 1 part and water 1 part) mixed with 1 drop of anise extract (Ernst, Citation2016; Seeley, Citation1982; Visscher & Seeley, Citation1982). The syrup was squeezed into a sterilised honeycomb and the honeycomb was placed into a bright-coloured shallow petri dish to allow bees to easily recognise the bait station (Ernst, Citation2016; Visscher & Seeley, Citation1982). The bait was placed at a stand with a 10 cm2 iron plate fixed to a 2 m tall iron rod which was fixed to the ground. In some bee stations where bees were difficult to bait, a bee box was used to trap foraging bees. The designed bee box had measurements of 20 cm × 10 cm × 10 cm. The trapped bees were fed with sugar syrup, marked and released after 30 minutes. Released trapped bees’ direction of flight was recorded. Trapping, feeding, and releasing honeybees allow the released honeybees which return to the colony to communicate with other bees to come and feed on the same source of feed on the established bee station. Bee station points were recorded using a handheld GPS. Bee lines or the direction of flights and bearing from the bee stations were recorded using the GPS compass between February and October 2019.
Triangulation and location of honeybee colonies
AutoCAD 2007 software was used to generate triangulation points based on beelines’ bearing which were established at each sampled bee station (McFarlane, Citation2007). The triangulation point was referred to as a point at which two or more accurate beelines intersect, assumed to be exact or fairly close to the honeybee colony and these geographical points were extracted for verification if there were honeybee colonies. Honeybee colonies were searched within a radius of 1–100 metres from the triangulation geographical point. The search involved walking and looking for honeybee flights in the sky, searching around trees (branches, holes, and cracks); rocks (cracks and crevices), anthills, and careful listening to buzzing bees from any form of habitat within the confines of the search radius (Ernst, Citation2016; Seeley, Citation1982). The distance from the triangulation geographical point to the actual point where a colony was observed was recorded in metres using a tape measure. Fifty-one geo-referenced honeybee nest sites were located in the HSA-Rifa section. The data collected were suitable for the modelling approach which uses presence-only data, against environmental covariates and this was done between February and October 2019. The period between February and October is considered to be the time bees will be most active for effective sampling.
Data analysis
Predictor variables used for modelling
Environmental variables were selected and used to model honeybee distribution based on the honeybee colony requirements in the published literature (Barnett & Facey, Citation2016). The variables were: solar radiation, wind speed, elevation, mean diurnal range, isothermality, temperature, and precipitation (). A 30 m resolution Aster Digital Elevation Model (DEM) was used to establish elevation data (http://www.gdem.aster.ersdac.or.jp/) following Hirt et al. (Citation2010). The Euclidean Distance function in ArcGIS was used to extract distance from water data based on water points that were estimated from Landsat TM 5 with the modified normalised difference water index (MNDWI; Tagwireyi et al., Citation2020). The variables were geo-referenced to the same pixel size of 30 m, and all coordinates were referenced using WGS 84-Universal Transverse Mercator (UTM) Zone 35S. To remove challenges of repetition which result in overparameterization which in turn affects the predictive power of the model (J. Elith et al., Citation2011), variable candidates were tested for multicollinearity using the Variance Inflation Factor (VIF). A VIF threshold of <10.0 was used to indicate variables that had significant multicollinearity (Tagwireyi et al., Citation2020). Fourteen environmental variables with VIF < 10.0 were used in the final model ().
Table 1. Variables used to model the potential distribution of honeybees.
Modelling approaches for honeybees suitable habitat
We used the Ensemble algorithm to predict the potential spatial distribution of honey bees in the study area (Thuiller et al., Citation2016) using the Biomod 2 package in R 3.4.4 (Ren et al., Citation2016). Default settings in all chosen modelling techniques usually come enhanced for Species Distribution Models (SDMs; Naimi, Citation2017). All models used a maximum of 100 iterations (Ren et al., Citation2016). For model training, 80% of the presence data was used while the remaining 20% was used for model evaluation.
The Ensemble model ingests a suite of species distribution models (SDMs) to create a hybrid SDM known as the ensemble model. The suite of SDMs used to create our ensemble model include generalized linear models (GLM), classification tree analysis (CTA), artificial neural networks (ANN), surface range envelope (SRE), generalized boosting model (GBM), Breiman and Cutler’s random forest for classification and regression (RF), mixture discriminant analysis (MDA), and multiple adaptive regression splines (MARS). Our ensemble model associated the honey bee occurrence data (the presence data at known geocoded locations) with environmental predictor variables (J, H Elith et al., Citation2006; Makori et al., Citation2017) to estimate the probability of the honey bee occurrence (Guisan & Thuiller, Citation2005; J, H Elith et al., Citation2006; Ma & Sun, Citation2018; Pearce & Boyce, Citation2006). Our product is a probability-based habitat map (Engler et al., Citation2004; Franklin, Citation2009; Guisan & Thuiller, Citation2005; Guisan & Zimmermann, Citation2000; Kumar & Stohlgren, Citation2009; Phillips et al., Citation2004). The final product is continuous maps which classify the landscape from low to high suitability for honey bee occurrence (González-Fernández et al., Citation2018).
Model validation
The partial Receiving Operating Characteristic (partial ROC; Peterson et al., Citation2008) was used in validating the ensemble models by making use of Area Under Curve (AUC) analysis (Lobo et al., Citation2008) and True Skill Statistics (TSS) which considers omission and commission errors (Allouche et al., Citation2006; Estrada-Peña & Salman, Citation2013; Gallien et al., Citation2012). TSS ranges from 0 to 1. A TSS value in the range 0–0.5 was considered a poor model fit, 0.6 to 0.8 an acceptable fit and useful and any values above 0.8 were considered good to excellent (Morin & Thuiller, Citation2009; Thuiller et al., Citation2016). With AUC, a model with values from 0.0 to 0.6 were considered poor, 0.6–0.9 as useful and >0.9 as excellent (Keenan et al., Citation2011; Dunne et al., Citation2021).
Results
(i) Precision of triangulation bee lining technique in locating A. m. scutellata colonies
The triangulation bee lining technique was not 100% effective in locating the A.m.scutellata colony population in the wild protected areas (). Most of the located honeybee colonies had a mean distance of 27.71 m ± 2.06 from a triangulated point (). The recorded minimum distance from the triangulated point was 6 m from (n = 51) located nest sites ().
Table 2. Precision of triangulation bee lining technique in located A.m. scutellata colonies.
(ii) Located A. m. scutellata colonies sites population distribution using a bee lining triangulation technique
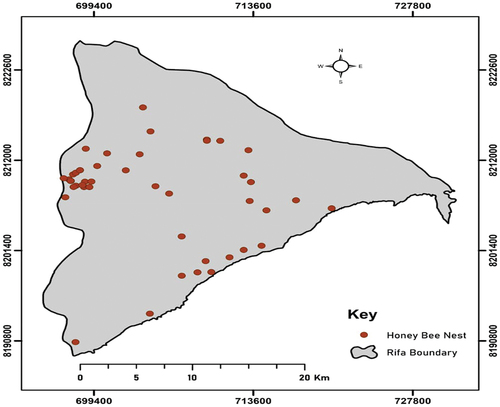
The triangulation bee lining technique managed to locate 18.1% (n = 51) of wild bee colonies from 282 triangulated points (). The proportion of nest site present to nest site absent was 1:5 from the triangulated points. A cluster of bee colonies has been found close to the Zambezi River, several isolated colonies were recorded in the central part of the study area and linear honeybee colonies were recorded on the marginal areas along the Zambezi escarpment transects.
Figure 3. A.m. scutellata colonies sites population distribution in Hurungwe Safari Area-Rifa section.
(iii) A. m. scutellata colony population distribution using SDM
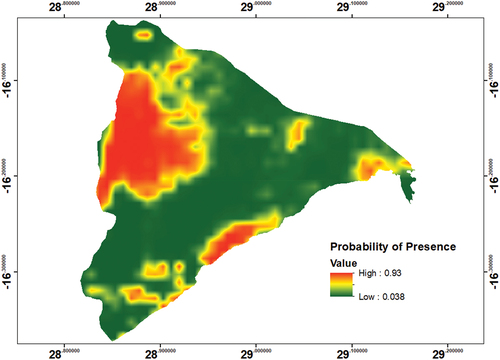
Areas close to the Zambezi River had a high probability of potentially suitable honeybee nest sites (). The major potential suitable nest sites will be clustered in the central part of the study area, with very few suitable nest sites in the marginal areas. Areas far away from the Zambezi River have a low potential for suitable honeybee nest sites. The most suitable habitat is the mid-west area as clearly seen in ( and ). The model shows the uneven potential distribution of honeybees in the Hurungwe Safari Area-Rifa section.
Figure 4. Potential distribution areas of honeybees in Hurungwe Safari Area-Rifa section.
Honeybees variable importance shows different responses to 14 different environmental parameters (). Most of the responses were above 0.8 which showed a good model indicating the influence of an environmental factor in nest suitability for honeybees. Honeybee had a high percentage response to the diurnal range, elevation, and precipitation (). The coldest month, driest month, warmest precipitation quarter, and coldest precipitation quarter did not affect honeybees distribution ().
Table 3. Honeybees’ response to different environmental elements.
Discussion
(i) Precision of triangulation bee lining technique in locating A. m. scutellata colonies
The study attempted to locate A. m. scutellata colonies using the triangulation hunting technique in a savanna-protected area. The study demonstrates the precision of triangulation bee lining in locating A. m. scutellata colonies, located A. m. scutellata colonies. The triangulation bee lining techniques were not very precise in locating the honeybee colonies. The mean distance from the triangulated point was 27.71 m ± 2.06 for the 51 located nest sites. This suggests that a beeline is not always straight from the food source to the honeybee colony. Deviations of beelines could be associated with wind speeds and direction. Strong winds may force honeybees to drift from their flight paths (Hennessy et al., Citation2020). Honeybees face challenges in finding suitable flight paths through congested environments. Beelines may also be affected by obstructions and this may force honeybees to deviate from their flight path. Honeybees avoid narrow passages to reduce time in navigation and the challenges of collision with obstacles (Ong et al., Citation2017). Choices in flight path by honeybees to avoid obstacles contribute to changes in bearing as bees navigate to and from their colonies.
Honey hunting in ancient ages by the Hadza tribe from Tanzania and Boran tribe from Kenya can be traced from rock paintings (Dunne et al., Citation2021; Spottiswoode et al., Citation2016). Humans were known to use other species like Greater honeyguides, dogs, falcons, and cormorants to hunt honey. A study using Greater honeyguides in the Tli’ika region, Tanzania revealed that Hadza foragers followed Greater honeyguides 26 times and found 18 A.mellifera nest sites (Wood et al., Citation2014). In the same study, when not guided the Hadza honey foragers experienced a 19% success rate, while guided they had a significant increase of 58% in success of finding honeybee nest sites (Wood et al., Citation2014). A study in Mozambique (Niassa National reserve) and Tanzania (Tli’ika region) reveals that honeyguides greatly increase men’s rates of finding wild honeybee colonies (Spottiswoode et al., Citation2016; Wood et al., Citation2014). Honey hunting using Greater honeyguides in Niassa National Reserve, Mozambique revealed greater accuracy in locating honeybee nest sites (Spottiswoode et al., Citation2016). A study in Niassa National using Greater honeyguides located 42% (n = 30 nests) from 72 transects (Spottiswoode et al., Citation2016). The triangulation bee lining technique which was used in this study located 18% (n = 51) wild honeybee colonies from 282 triangulated points. Devising wild honeybee hunting techniques is important as it ensures the quick establishment of bee colonies in certain ecosystems for further study. Honey hunting techniques enable easy inspection of pests and diseases from wild honeybee nest sites, and provision of organic honey for medicinal purposes and as an outdoor hobby (Schouten et al., Citation2020). Such studies can most importantly help in monitoring the honeybee population dynamics and promoting conservation.
(ii) Located A. m. scutellata colonies sites population distribution using a bee lining triangulation technique
The potential distribution map shows niche habitats and most habitats were around water sources like rivers and water pans. More honeybee colonies were concentrated along the Zambezi River which is a perennial water source. Water forms the basic life of any living organism since it is required for several metabolic reactions (Makori et al., Citation2017; Tarakini et al., Citation2021). In honeybees, water is required daily in the honey production process and a general cooling of brood in nests (Groh et al., Citation2004; Jones & Oldroyd, Citation2007; Tautz et al., Citation2003). Humidity affects the general water balance in insect bodies and it has to be maintained within certain limits (Barnett & Facey, Citation2016; Jones & Oldroyd, Citation2007; Lensky, Citation1964; Southwick & Heldmaier, Citation1987; Zhu et al., Citation2014).
This study can be used as a basis in the planning of future research on the A. m. scutellata in protected areas. Organic honey collection can be considered in protected areas considering the established suitable niche areas within the protected area. The information generated from this study is important in guiding management decisions on niche habitat protection within protected areas. Such studies can most importantly help in monitoring the honeybee population dynamics and promoting conservation.
(iii) Predictive model of A. m. scutellata habitat suitability using SDM
The study modelled possible factors affecting honeybee nesting sites. Mean Diurnal Range, Digital Elevation Model, and Precipitation greatly influenced honeybee nesting. Most bees are diurnal and very active early morning and late afternoon as they forage and expand their hives. Sunlight helps bees for navigation as they forage, hence the reason why bees are less active on a very cloudy day. Most nest sites were close to water sources. Water forms the major component required in honey production as a result, scout bees choose nest sites to close water sources to reduce the time spent collecting water for the colony. The study area is in Zimbabwe’s ecological region 5 which is associated with low rainfall, periodic droughts, high temperatures, and clustered nest sites along the Zambezi River could be a result of adaptation to drought. Apart from that, altitude affected A. m. scutellata nesting sites. Low altitude in the Zambezi valley is associated with high alluvial deposits, fertile soils, high floral diversity, and water availability as compared to high altitude areas. Most nest sites were in low-lying areas due to high plant communities which supported good forage grounds (), a diversity of woody plants supported diverse nesting sites and the availability of water from rivers and water pans made the low-lying areas more habitable (Tarakini et al., Citation2021). Understanding bee species richness and their underlying drivers along environmental gradients remains very critical in ensuring bee conservation in protected and non-protected areas (Ruttner, Citation1988). Molecular and morphological studies on A. m. scutellata, Apis mellifera monticola, and Apis mellifera simensis show that different subspecies and ecotypes are adapted to different elevation and habitat conditions (Ruttner, Citation1988). Knowledge of bee species adaptation and sensitivity to different environmental conditions enables predictions to be made on their response to natural and anthropogenic effects (Garnery et al., Citation1992). For example, the commonly reported pattern on species richness along altitudinal gradients is that there is a decline in species richness with an increase in altitude.
Most studies on the impact of bioclimatic factors on honeybees were biased toward laboratory investigations (Hennessy et al., Citation2020) and this study helps to bridge the gap. An understating of honeybee distribution and possible factors influencing their distribution is important in understanding the level of protection needed and their vulnerability (Tarakini et al., Citation2021). The findings from the model can be applied in other protected areas as long as the areas have similar characteristics. However, the model comes with some limitations in that it does not take into account Spatio-temporal variations which could be associated with climate change or seasonal variations (Abrha, Citation2018; Cloudsley-Thompson, Citation1962) and bias from few samples collected, hence the study suggests applying the findings of the model with caution in areas which were not sampled.
Conclusion
The study located wild honeybee colonies using the triangulation bee lining technique and evaluated the method as well as predicted the suitable niche honeybee habitats. The triangulation bee lining technique can be used in hunting wild honeybee colonies. The study revealed that beelines may not show the exact location of a nest site from food sources. It is most likely that honeybees deviate from their beelines due to other factors. The located wild honeybee colonies need further studies to establish honeybee flight behaviour. SDM helped to map wild honeybee niche habitats within the HSA-Rifa section. The study shows the uneven potential distribution of wild honeybee colonies. The model established that wild honeybee colonies will be clustered close to the Zambezi River and low-lying areas especially areas along rivers and major water pans. Areas far away from the Zambezi River have a low potential for suitable honeybee nest sites. It was found that water and forage availability plays a pivotal role in determining the distribution of wild honeybee colonies in a protected area. Modelling in conservation provides a new way of understating ecological niches within habitats in a landscape that sometimes appears to be uniform. Future studies should focus on protecting the located honeybee colonies and niche habitats within HSA-Rifa.
Acknowledgments
We thank Dr F.U. Mangwanya, Director General of the Zimbabwe Parks and Wildlife Management Authority for permission to undertake this research. We thank Herbet Muchikange, Funny Gapa, Kuda Chinake, Musekiwa Nyamayaro, Martin Chimwe, Tristan Tenda Cecil Nyatsande and Augastine Malunga for assistance during field data collection. We also thank two anonymous reviewers for comments and suggestions which improved the quality of this manuscript.
Disclosure statement
No potential conflict of interest was reported by the authors.
Additional information
Funding
References
- Abrha, H. (2018). Climate change impact on coffee and the pollinator bee suitable area interaction in Raya Azebo, Ethiopia. Cogent Food and Agriculture, 4(1), 1–13. https://doi.org/10.1080/23311932.2018.1564538
- Allouche, O., Tsoar, A., & Kadmon, R. (2006). Assessing the accuracy of species distribution models: Prevalence, kappa and the true skill statistic (TSS). Journal of Applied Ecology, 43(6), 1223–1232. https://doi.org/10.1111/j.1365-2664.2006.01214.x
- Anderson, R. P., & Martinez-Meyer, E. (2004). Modeling species’ geographic distributions for preliminary conservation assessments: An implementation with the spiny pocket mice (heteromys) of Ecuador. Biological Conservation, 116(2), 167–179. https://doi.org/10.1016/S0006-3207(03)00187-3
- Barnett, K. L., & Facey, S. L. (2016). Grasslands, invertebrates, and precipitation: A review of the effects of climate change. Frontiers in Plant Science, 7, 1196. https://doi.org/10.3389/fpls.2016.01196
- Chakuya, J., Mandisodza-Chikerema, R., Ngorima, P., & Malunga, A. (2021). Water sources during drought period in a savanna wildlife ecosystem, northern Zimbabwe. Geology, Ecology, and Landscapes, 1–6. https://doi.org/10.1080/24749508.2021.1971413
- Chakuya, J., Gandiwa, E., Muboko, N., & Muposhi, V. K. (2022). A review of habitat and distribution of common stingless bees and honeybees species in African savanna ecosystems. Tropical Conservation Science, 15. https://doi.org/10.1177/2F19400829221099623
- Chitesa, A. (2014). Beekeeping in Zimbabwe paper presented at the APIEXPO Africa 2014 held in harare 6-11th october, 2014. By Smith Nyatsande.
- Cloudsley-Thompson, J. L. (1962). Microclimates and the distribution of terrestrial arthropods. Annual Review of Entomology, 7(1), 199–222. https://doi.org/10.1146/annurev.en.07.010162.001215
- Dunham, K. M. (1988). Demographic changes in the Zambezi Valley elephants (Loxodonta africana). Journal of Zoology, London, 215(2), 382–388. https://doi.org/10.1111/j.1469-7998.1988.tb04909.x
- Dunham, K. M. (1992). Response of a lion (Panthera leo) population to changing prey availability. Journal of Zoology, 227(2), 330–333. https://doi.org/10.1111/j.1469-7998.1992.tb04829.x
- Dunne, J., Höhn, A., Franke, G., Neumann, K., Breunig, P., Gillard, T., Evershed, R. P., & Evershed, R. P. (2021). Honey-collecting in prehistoric West Africa from 3500 years ago. Nature Communications, 12(1), 1–11. https://doi.org/10.1038/s41467-021-22425-4
- Elith, J.H., Graham, C. P., Anderson, R., Dudík, M., Ferrier, S., Guisan, A., E. Zimmermann, N., Huettmann, F., R. Leathwick, J., Lehmann, A., Li, J., G. Lohmann, L., A. Loiselle, B., Manion, G., Moritz, C., Nakamura, M., Nakazawa, Y., McC. M. Overton, J., Townsend Peterson, A., E. Zimmermann, N. (2006). Novel methods improve prediction of species distributions from occurrence data. Ecography, 29(2), 129–151. https://doi.org/10.1111/j.2006.0906-7590.04596.x
- Elith, J., Phillips, S. J., Hastie, T., Dudik, M., Chee, Y. E., & Yates, C. J. (2011). A statistical explanation of Maxent for ecologist. Diversity and Distribution, 17(1), 43–57. https://doi.org/10.1111/j.1472-4642.2010.00725.x
- Engler, R., Guisan, A., & Rechsteiner, L. (2004). An improved approach for predicting the distribution of rare and endangered species from occurrence and pseudo-absence data. Journal of Applied Ecology, 41(2), 263–274. https://doi.org/10.1111/j.0021-8901.2004.00881.x
- Ernst, U. (2016). Following the wild bees: The craft and science of bee hunting. Bioscience, 66(10). https://doi.org/10.1093/biosci/biw105
- Estrada-Peña, A., & Salman, M. (2013). Current limitations in the control and spread of ticks that affect livestock: A review. Agriculture, 3(2), 221–235. https://doi.org/10.3390/agriculture3020221
- Fikadu, Z. (2019). The contribution of managed honeybees to crop pollination, food security, and economic stability: Case of Ethiopia. The Open Agriculture Journal, 13(1), 175–181. https://doi.org/10.2174/1874331501913010175
- Franklin, J. (2009). Mapping species distributions: Spatial inference and prediction. Cambridge University Press.
- Gallien, L., Douzet, R., Pratte, S., Zimmermann, N. E., & Thuiller, W. (2012). Invasive species distribution models–how violating the equilibrium assumption can create new insights. Global Ecology and Biogeography, 21(11), 1126–1136. https://doi.org/10.1111/j.1466-8238.2012.00768.x
- Garnery, L., Cornuet, J. M., & Solignac, M. (1992). Evolutionary history of the honey bee Apis mellifera inferred from mitochondrial DNA analysis. Molecular Ecology, 1(3), 145–154. https://doi.org/10.1111/j.1365-294X.1992.tb00170.x
- Gill, N. S., & Sangermano, F. (2016). Africanised honeybee habitat suitability: A comparison between models for southern Utah and southern Califonia. Applied Geography, 76, 14–21. https://doi.org/10.1016/j.apgeog.2016.09.002
- González-Fernández, A., Manjarrez, J., García-Vázquez, U., D’Addario, M., & Sunny, A. (2018). Present and future ecological niche modeling of garter snake species from the Trans-Mexican Volcanic Belt. Peer Journal, 6, e4618. https://doi.org/10.7717/peerj.4618
- Groh, C., Tautz, J., & Rössler, W. (2004). Synaptic organization in the adult honeybee brain is influenced by brood-temperature control during pupal development. Proceedings of National Academy of Science, 101, 4268–4273. https://doi.org/10.1073/pnas.0400773101
- Guerin, E. (2020). Apis dorsata Honey Hunting and Honey Trading in Mondulkiri (EasternCambodia). Bee World, 97(2), 34–38. https://doi.org/10.1080/0005772X.2019.1692644
- Guisan, A., & Zimmermann, N. E. (2000). Predictive habitat distribution models in ecology. Ecological Modelling, 135(2–3), 147–186. https://doi.org/10.1016/S0304-3800(00)00354-9
- Guisan, A., Edwards, T. C., & Hastie, T. (2002). Generalized linear and generalized additive models in studies of species distributions: Setting the scene. Ecological Modelling, 157(2–3), 89–100. https://doi.org/10.1016/S0304-3800(02)00204-1
- Guisan, A., & Thuiller, W. (2005). Predicting species distribution: Offering more than simple habitat models. Ecology Letters, 8(9), 993–1009. https://doi.org/10.1111/j.1461-0248.2005.00792.x
- Guy, P. R. (1977). Notes on the vegetation types of the Zambezi Valley. Rhodesia, between the kariba and mpata gorges. Kirkia, 10(2), 543–557. http://www.jstor.org/stable/23502161
- Hennessy, G., Harris, C., Eaton, C., Wright, P., Jackson, E., Goulson, D., & Ratnieks, F. F. (2020). Gone with the wind: Effects of wind on honeybee visit rate and foraging behaviour. Animal Behaviour, 161, 23–31. https://doi.org/10.1016/j.anbehav.2019.12.018
- Hirt, C., Filmer, M. S., & Featherstone, W. E. (2010). Comparison and validation of the recent freely available ASTER-GDEM ver1, SRTMver4.1 and GEODATA DEM- 9S ver3 digital elevation models over Australia. Australian Journal of Earth Sciences, 57(3), 337–347. https://doi.org/10.1080/08120091003677553
- Hirzel, A. H., Hausser, J., Chessel, D., & Perrin, N. (2002). Ecological-niche factor analysis: How to compute habitat-suitability maps without absence data? Ecology, 83(7), 2027–2036. https://doi.org/10.1890/0012-965820020832027ENFAHT2.0.CO2
- Human, H., Brodschneider, R., Dietemann, V., Dively, G., Ellis, J. D., Forsgren, E., Zheng, H. Q., Hatjina, F., Hu, F.-L., Jaffé, R., Jensen, A. B., Köhler, A., Magyar, J. P., Özkýrým, A., Pirk, C. W. W., Rose, R., Strauss, U., Tanner, G., Tarpy, D. R., … Zheng, H.-Q. (2013). Miscellaneous standard methods for Apis mellifera research. Journal of Apicultural Research, 52(4), 1–53. https://doi.org/10.3896/IBRA.1.52.4.10
- Isack, H. A., & Reyer, H. U. (1989). Honeyguides and honey gatherers: Interspecific communication in a symbiotic relationship. Science, 243(4896), 1343–1346. https://doi.org/10.1126/science.243.4896.1343
- Jones, J. C., & Oldroyd, B. P. (2007). Nest thermoregulation in social insects. Advances in Insect Physiology, 33, 154–191. https://doi.org/10.1016/S0065-2806(06)33003-2
- Joshi, S. R., & Gurung, M. B. (2005). Non-destructive method of honey hunting. Bee World, 86(3), 63–64. https://doi.org/10.1080/0005772X.2005.11417313
- Keenan, T., Maria Serra, J., Lloret, F., Ninyerola, M., & Sabate, S. (2011). Predicting the future of forests in the mediterranean under climate change, with niche‐and process‐based models: CO2 matters! Global Change Biology, 17(1), 565–579. https://doi.org/10.1111/j.1365-2486.2010.02254.x
- Kumar, S., & Stohlgren, T. J. (2009). Maxent modelling for predicting suitable habitat for threatened and endangered tree canacomyrica monticola in New Caledonia. Journal of Ecology and Natural Environment, 1(4), 094–098. https://doi.org/10.5897/JENE.9000071
- Lensky, Y. (1964). Comportement d’une colonie d’abeilles a des temperatures extremes. Journal of Insect Physiology, 10(1), 1–12. https://doi.org/10.1016/0022-1910(64)90090-3
- Lobo, J. M., Jiménez‐Valverde, A., & Real, R. (2008). AUC: A misleading measure of the performance of predictive distribution models. Global Ecology and Biogeography, 17(2), 145–151. https://doi.org/10.1111/j.1466-8238.2007.00358.x
- Ma, B., & Sun, J. (2018). Predicting the distribution of stipa purpurea across the Tibetan plateau via the MaxEnt model. BMC Ecology, 18(1), 1–12. https://doi.org/10.1186/s12898-018-0165-0
- Makori, D. M., Fombong, A. T., Abdel-Rahman, E. M., Nkoba, K., Ongus, J., Irungu, J., Landmann, T., Makau, S., Mutanga, O., Odindi, J., Raina, S., & Landmann, T. (2017). Predicting spatial distribution of key honeybee pests in Kenya using remotely sensed and bioclimatic variables: Key honeybee pests distribution models. ISPRS International Journal of Geo-Information, 6(3), 66. https://doi.org/10.3390/ijgi6030066
- Marshman, J., Blay-Palmer, A., & Landman, K. (2019). Anthropocene crisis: Climate change, pollinators, and food security. Environments, 6(2), 22. https://doi.org/10.3390/environments6020022
- McFarlane, B. (2007). Beginning AutoCAD 2007. Routledge).
- Morin, X., & Thuiller, W. (2009). Comparing niche‐and process‐based models to reduce prediction uncertainty in species range shifts under climate change. Ecology, 90(5), 1301–1313. https://doi.org/10.1890/08-0134.1
- Naimi, B. (2017). Package ‘usdm uncertainty analysis for species distribution models. Accessed 03 January 2022. Wien. www.cran.r-project.org
- Ong, M., Bulmer, M., Groening, J., & Srinivasan, M. V. (2017). Obstacle traversal and route choice in flying honeybees: Evidence for individual handedness. PLoS One, 12(11), e0184343. https://doi.org/10.1371/journal.pone.0184343
- Pearce, J. L., & Boyce, M. S. (2006). Modelling distribution and abundance with presence-only data. Journal of Applied Ecology, 43(3), 405–412. https://doi.org/10.1111/j.1365-2664.2005.01112.x
- Peterson, A. T., Papeş, M., & Soberón, J. (2008). Rethinking receiver operating characteristic analysis applications in ecological niche modelling. Ecological Modelling, 213(1), 63–72. https://doi.org/10.1016/j.ecolmodel.2007.11.008
- Phillips, S. J., Dudik, M., & Schapire, R. E. (2004) A maximum entropy approach to species distribution modelling. 21st International conference on machine learning, 2004., Banff, Canada: AT&T Labs − Research, 1–8. https://doi.org/10.1145/1015330.1015412
- Phillips, S. J., Anderson, R. P., & Schapire, R. E. (2006). Maximum entropy modelling of species geographic distributions. Ecological Modelling, 190(3–4), 231–259. https://doi.org/10.1016/j.ecolmodel.2005.03.026
- Ren, Z., Peng, H., & Liu, Z. W. (2016). The rapid climate change-caused dichotomy on subtropical evergreen broad-leaved forest in Yunnan: Reduction in habitat diversity and increase in species diversity. Plant Diversity, 38(3), 142–148. https://doi.org/10.1016/j.pld.2016.04.003
- Rinnan, D. S., & Lawler, J. (2019). Climate‐niche factor analysis: A spatial approach to quantifying species vulnerability to climate change. Ecography, 42(9), 1494–1503. https://doi.org/10.1111/ecog.03937
- Ruttner, F. (1988). Morphometric analysis and classification. Biogeography and taxonomy of honeybees (pp. 66–78). Springer. https://doi.org/10.1007/978-3-642-72649-1_6
- Schouten, C., Lloyd, D., Ansharyani, I., Salminah, M., Somerville, D., & Stimpson, K. (2020). The role of honey hunting in supporting subsistence livelihoods in Sumbawa, Indonesia. Geographical Research, 58(1), 64–76. https://doi.org/10.1111/1745-5871.12380
- Seeley, T. D. (1982). How honeybees find a home. Scientific American, 247(4), 158–168. https://doi.org/10.1038/scientificamerican1082-158
- Southwick, E. E., & Heldmaier, G. (1987). Temperature control in honeybee colonies. Bioscience, 37(6), 395–399. https://doi.org/10.2307/1310562
- Spottiswoode, C. N., Begg, K. S., & Begg, C. M. (2016). Reciprocal signalling in honey guide-human mutualism. Science, 353(6297), 387–389. https://doi.org/10.1126/science.aaf4885
- Tagwireyi, P., Wenga, T., Ndaimani, H., & Mpakairi, K. S. (2020). Environmental correlates of cheetah (acinonyx jubatus) space-use in a savanna landscape. African Journal of Wildlife Research, 50(1). https://doi.org/10.3957/056.050.0000
- Tarakini, G., Chemura, A., Tarakini, T., & Musundire, R. (2021). Drivers of diversity and community structure of bees in an agroecological region of Zimbabwe. Ecology and Evolution, 11(11), 1–12. https://doi.org/10.1002/ece3.7492
- Tautz, J., Maier, S., Groh, C., Rössler, W., & Brockmann, A. (2003). Behavioral performance in adult honeybees is influenced by the temperature experienced during their pupal development. Proceedings of National Academy of Sciences, 100, 7343–7347. https://doi.org/10.1073/pnas.1232346100
- Thuiller, W., Georges, D., Engler, R., & Breiner, F. (2016). Ensemble platform for species distribution modeling R Package Version. 1–3.
- Visscher, P. K., & Seeley, T. D. (1982). Foraging strategy of honeybee colonies in a temperate deciduous forest. Ecology, 63(6), 1790–1801. https://doi.org/10.2307/1940121
- Wood, B. M., Pontzer, H., Raichlen, D. A., & Marlowe, F. W. (2014). Mutualism and manipulation in Hadza–honeyguide interactions. Evolution and Human Behavior, 35(6), 540–546. https://doi.org/10.1016/j.evolhumbehav.2014.07.007
- Zhu, H., Wang, D., Wang, L., Fang, J., Sun, W., & Ren, B. (2014). Effects of altered precipitation on insect community composition and structure in a meadow steppe. Ecological Entomology, 39(4), 453–461. https://doi.org/10.1111/een.12120