
 ?Mathematical formulae have been encoded as MathML and are displayed in this HTML version using MathJax in order to improve their display. Uncheck the box to turn MathJax off. This feature requires Javascript. Click on a formula to zoom.
ABSTRACT
Spatio-temporal analysis of waterbodies in terms of detection of morphological change could serve as a guiding tool to restore the lentic ecosystem. This research analysed the loss of lake extent within 50 years (1969–2019) through natural, anthropogenic reasons, as well as a lack of attention to protecting lakes in the Tarai region. In 1969, 75 lakes were found, but now only 46 lakes are alive. Among the 75 lakes, seventeen transformed into large ponds after reduction in extent, and twelve lakes either appeared as waterlogging zones during the rainy season or were permanently extinct and used as agricultural fields’ built-up activities. The spatial vulnerability index (SVI) measured the level of deterioration and urgency of lake restoration. 8 lakes were determined to be highly vulnerable (below 29.26%) and lost about 311.20 hectares of potential area of lake beds due to gradual increasing shallowness. Regression analysis measured a very weak correlation between the reducing percent of lake extent (during 50 years) and current lake extent (R2 = 0.1336), average depth (R2 = 0.0035), circumference (R2 = 0.0543), and volume (R2 = 0.0728) of 46 lakes. This study elucidated the restoration practices of the lakes to prevent their gradual extinction.
1. Introduction
In the era of climate change, water-bodies (lakes, rivers, ponds, tanks) are the proxy for climate change studies. Change detection is defined as “the process and mechanism of recognition, identification, and quantification. It creates differences in the state of any object, phenomenon and fact by observing their different spatial and temporal references” (Lu et al., Citation2004; Singh, Citation1989; and Salman et al., Citation2021) with the help of multi-date imagery data (Coppin & Bauer, Citation1996). This analysis is essential to understand the inter-relationship among deteriorating lake ecosystem, climate change, reducing inland lake extent and the impact of anthropogenic activities over a long period (Mukherjee et al., Citation2023). Surface water bodies of floodplains are a more sensitive factor to analyse climate change (Karim et al., Citation2016). It is tried to discover the changes in the extent of surface water bodies to understand the natural as well as anthropogenic impact on it (Donia & Farag, Citation2012 and Chen et al., Citation2023). Hence, this technique of detection can be elaborated as means of recognition, identification, and quantification of temporal differences among the sets of the same phenomena covering a well-known spatial extent (Lu et al., Citation2004). Classification and mapping with high precision of lakes detected their consistent change in the area. It depicted the relevance of variation comes in the lake regime such as climate change, crucial imbalance in lake ecology, and their surrounding economic development (Hossen & Negm, Citation2016; Cunha et al., Citation2013; and Gilarranz et al., Citation2023) of the study site in the Tarai region. The change in the area and volumetric extent of the lake affects the local and regional environment. Lakes are an essential feature of the Earth’s ecosystem. Lakes are transitional areas between permanent aquatic ecosystems and dry terrestrial regions. They provide a variety of values and are used such as for the supply of fishery, food, water, fodder, fuel, aquaculture, ecotourism, transport, cultural heritage, aesthetic enjoyment, research and educational values, etc. It plays a major role in the sensitive change to the natural components to rightly need to serve essentially and hence control spatio-temporal environmental variations (Mason et al., Citation1994). Approximately, all lakes are suffered from this situation and lack of implementation of restoration programs. This situation largely deteriorated their morphological as well as ecological dimensions (Deka et al., Citation2011; Ramachandra, Citation2008). Deteriorating water quality, shrinking extent, reducing depth, and associated littoral weeds could be key indicators of the depletion of lake ecosystems in the study region (Giweta & Worku, Citation2018; Gebretsadik & Mereke, Citation2017; Bekele et al., Citation2018; Zekarias & Gelaw, Citation2023). In the recent time, alteration of cropland to urban built-up regions, increasing use of chemical fertilizers, undesirable droughts, floods, water pollution and their unsustainable management are generated eutrophication, massive littoral weeds, and shallowing lake beds. These are the major artificial as well as natural driving forces of the extinction of lake wetlands (Davidson, Citation2014; Galatowitsch, Citation2018). The homeostatic mechanism, water retention time of water-body maintained the balance of physical extent and ecological health. But the gradual deposition of fine silt particles on the bottom floor of lake bed leads to an increase in organic matter, and massive littoral coverage pushed towards the path of extinction in near the future (Birk et al., Citation2020). Remote sensing imageries have been widely functioning in environmental studies. This technique observe the dramatic alteration occurred through anthropogenic and natural factors on the surface water extent (Haack, Citation1996; Mercier et al., Citation2010). If actions and protections of resources are not accurately implemented then identity of the particular resources is damaged of any kind of phenomenon due to a change in behaviour of surroundings within the specific temporal frame (Sowmyashree & Ramachandra, Citation2012).
In the Tarai region, shallowness is the crucial mark of the lentic ecosystems due to the huge amount of gradual silt deposition from the flowing channels, surface runoff, agricultural runoff etc. (De Voogt et al., Citation2000). The novel purpose of this study was to analyse the change in identical nomenclature and surface extent of lakes within 50 years (1969 – 2019). In 1969 (, and Supp Table S4), 75 lakes were found but up to 2019 only 46 lakes are currently alive (). Many medium and small-extent lakes were transformed into small lakes, large ponds, and disappeared lakes in this study site. The spatial vulnerability index (SVI) was measured to find the level of deterioration and urgency of restoration of lakes. Regression analysis measured the significant correlation between percentage reducing extent and the current morphometric parameters of 46 lakes in Tarai within 50 years. This analysis depicted the lake morphometric features are more to less distort through increasing reduced extent of the lake due to natural and anthropogenic interferences on lakes in the study area. The implication of the study in Tarai lakes comes to revive the hydrology, morphology, and ecology. It creates aquatic and terrestrial biome, which finally control the losing ecological function, values, ethical enjoyment, and pleasure with nature for nature and by nature. Environmental planners, government and non-government stakeholders, decision-makers, and resource managers essentially develop optimum mechanisms to evaluate the problem and give an alternative for surface water (lakes in Tarai) restoration (rejuvenate homeostatic mechanism of the lake) and conservation (El-Hattab, Citation2015). Thereby, aforesaid reason ensures the sustainability of aquatic ecology, consistent in water quality, and offered a habitat for enriched biodiversity (Turner et al., Citation1994).
Figure 1. Rivers, lakes, and ponds in the Rapti river plain.
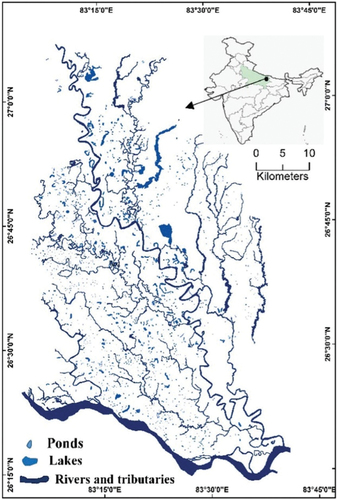
Figure 2. Lakes in 1969 and 2019 in the study site.
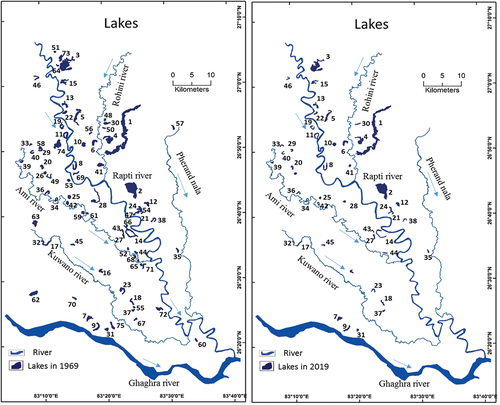
Figure 3. Lakes transformation into large pond and disappeared lakes within 50 years (1969–2019).
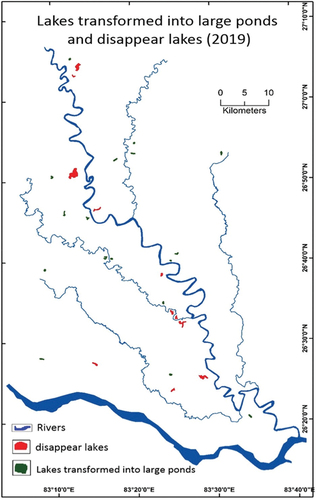
Table 1. Change in area of lakes within 50 years (1969 – 2019).
2. Research methodology
2.1. Description of study area
In the study site, Rapti river is the main stream and join with the Ghaghara river in the south of the district and many other stream like the Ami river, Rohini river, Kuwano river, Gaura nadi, and Pherand nala, () drained the entire area. About 46 lakes are identified as ox-bow lake (Mitra, Citation2010; Singh & Sharma, Citation2019) of all the above mentioned rivers. These river systems are collectively occupied 204.472-kilometer squares area; 46 lakes are covered 16.057-kilometer squares area; wet and dry ponds occupy 17.734-kilometer square and 12.001-kilometer squares, respectively in the Gorakhpur district (3484 square kilometers).
Figure 4. Lakes transformed into different extent; current lakes, large ponds and disappeared lakes within 50 years (1969 – 2019) in Tarai region.
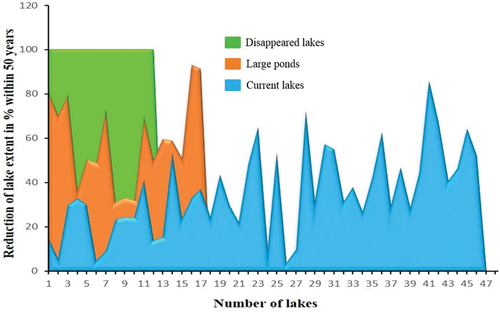
Table 2. Transformation of lake into large pond within 50 years (1969 – 2019).
Existing lake water bodies are part of channels abandoned of mentioned rivers that have been blocked and gradually became shallow due to silt deposition. It developed meander to ox-bow shape through the accumulation of silt through surface runoff or the deep natural depressions and upper water surface store without presence of any adequate outlets (Vyas, Citation1990).
2.2. Data acquisition
This research work was dealing with the morphological change detection analysis of the lentic ecosystem of the Rapti river basin. The present study detected the changes in the reduction of lake extent, typology, and identifiable nomenclature. The nomenclature or identity of lakes is approved by the standard extent of the surface water cover of the lake after digitized of topographical maps (1969) and Google Earth Images (2019). This nomenclature recognised as a medium, small, very small size lake, large pond and disappeared lake in the study area. The spatial extent of lakes measured based on topographical sheets (1967–1974; 63 M/4, 63 M/8, 63N/1, 63N/2, 63N/3, 63N/5, 63N/6, 63N/7, 63N/9, 63N/10, 63N/11, and 63N/12), Survey of India on the scale of 1:50000. Google Earth Images (February 2019) from the high resolution (65 cm *65 cm) are used to measure the extent of lakes and circumference in 2019. The average depth of the lake was measured at the different sites on the lake’s bed through Stadia, rope with Plum-bob, hard bamboo stick, boat (Hutchinson, Citation1957; Jorgensen et al., Citation2013). However, these instruments are not used in some lakes due to physical limitations (shallowness, massive weeds) and unavailability of boat. For those lakes, a simple random sampling method is used through interview schedules. 10 respondents were taken from 500 meters buffer area of each lake whose livelihood (fishing) depends on lakes. Depth on many sites of lake beds taken from those respondents and calculated the average depth in feet (Supp Table S5) of remaining lakes (Messager et al., Citation2016; Taube, Citation2000).
where, “N” = many number of depths taken on the bottom floor of lake bed.
Volume of lakes (meter cube) is measured in the category of large, moderate, and low-containing zone (Schneider, Citation2000; Taube, Citation2000) using this formula (Table 8).
2.3. Data analysis
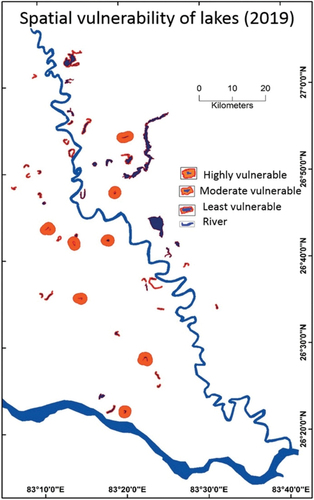
Spatial vulnerability index measured of current 46 lentic water-bodies within 50 years (1969–2019) approximately. This analysis done by range of reducing extent in lake size within temporal reference and focus on urgent attention of restoration of the Tarai lakes in study site. It measured through the value of mean and standard deviation (SD) of surface water extent of 46 lakes. Spatial vulnerability index analysed in three categories; least vulnerable (mean − 2SD), moderate vulnerable (mean − 1SD), and high vulnerable (mean +1SD). This analysis explores low concern of restoration for least vulnerable lakes, modest concern considered as moderate vulnerable while threatening concern recommend for high vulnerable lakes. The map of SVI is shown through the buffer zone surround lakes. The wider buffer (1000 meters) zone depicts high spatial vulnerable index, whereas moderate buffer (100 meters) zone depicts moderate vulnerable index and narrow buffer (10 meters) zone seen by least vulnerable index of lakes ().
Figure 5. Change in identifiable nomenclature of lakes within 50 years (1969 to 2019).
where, – Mean value of lake extent
where, - Standard Deviation, xi – reduced lake extent of one lake,
– mean value of lake extent, n – number of total lakes.
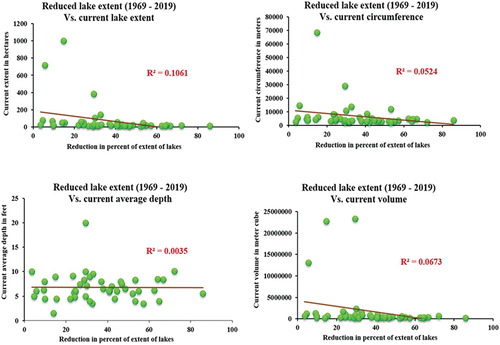
This study further analysed the regression model between percent reduction of lake extent (within 50 years) and current morphometric parameters (lake extent, average depth, circumference, and volume) of 46 lakes ().
Figure 6. Spatial vulnerability index of alive lakes during 50 years (1969 – 2019).
3. Results and discussion
This study detect to morphological change in identifiable nomenclature and extent of lakes within 50 years (1969 – 2019). Surface water-bodies (lakes and ponds) are classified according to coverage of water surface extent on the earth’s surface ().
3.1. Change detection in area of lakes within 50 years (1969 – 2019)
This study finds approximately 2223.70 hectares ( Figure 1 and 2) area of lake water-bodies reduced. This extent of lakes have large ecological platform for residing thousands of habitats, living and non-living creatures (Dodds, Citation2002; Madgwick, Citation1999). Therefore, deterioration of such natural bountiful gift (natural lakes) took 50 years (1969 – 2019).
The morphological change detection technique is used to explore the percent reduction in lake extent (Ramchandra, Citation2009). In this Tarai region, 75 lakes are identified in 1969 based on surface water extent (above 10 hectares). But, dramatically reduction in extent of lake beds up to 2019, 46 lakes were left as alive status during 50 years. Among all Tarai lakes in 2019 (), 46 lentic water bodies determine as lakes, 17 lakes measured as large ponds, and 12 lakes were either seasonal disappeared or permanently extinct. This situation evolved through the transformation of shallowing lake beds into agricultural land, seasonal water-logged beds, residential encroachment etc. Among 75 Tarai lakes, 46 lakes covered an area of 4735.60 hectares in 1969, and this active lake area remained 3552.80 hectares in 2019 after a loss of 1182.80 hectares. The total loss of aquatic extent is 2223.70 hectares area from 5776.50 hectares during 50 years only. Therefore, among the total reduced (2223.70 hectares) lake beds, 1182.80 hectares of lakes area were lost through reduction in the extent of present lake area; 130.90 hectares of the area became large ponds after a reduction of 365.90 hectares of lake extent; 544.10 hectares lentic aquatic extent disappeared through the natural and anthropogenic actions (, ).
Figure 7. Regression analysis between reduced lake extent (50 years) and morphometric parameters of lakes in Tarai region.
Lake Sarua is largely shrunk which is 156.50 km square due to the high rate of siltation. It is possible due to a lack of proper embankment, people encroaching activity like cropping, vegetable farming, solid waste dumping, and infrastructural development. Lack of awareness among government authorities, stakeholders, local people etc. supports the lake deterioration and increases the attention to stewardship practices (Horne & Goldman, Citation1994). Whereas Jatia Lake is less shrunk which is 2.50 km square due to local people or fishermen’s concerns. They flourish their fishing activity and get livelihood after their economic and physical efforts. Such as they dredged out the silt, harvested the aquatic weed, did not dump the solid wastes and put them into the seeds of fish, etc. Huge siltation from surface runoff and silt deposits during flood season from Rapti river is the major cause to reduce the lake extent. 85% area of Lake Chaura was reduced within the given period according to per cent whereas the least reduction was found in Bharsara lake (3.59%). This lake was sustained due to the feasible use (fishing, irrigation, bathing, etc.) of lake water by the surrounding locality (Supp Table S1 and Figure S3).
3.2. Reduction in lake area and transformed into large pond
Out of 75 lakes, 17 lakes (2019) come out from the category of the lake according to an extent (less than 0.1 km square). The surface water extension of the lake is shrunk due to natural (silt deposition from surface runoff) causes. However, anthropogenic causes (agricultural practice, residential encroachment, dumping of solid wastes), lack of awareness among government bodies and locals are converting them into non-eco-friendly resources due to their uncontrolled greed (Ramachandra, Citation2008). Chorwa, Arnar, Narkhata, Bharua, and Kusmi lakes were least comparatively shrunk. Whereas, the lake Chappia and Bhadarkhi was lost their area 93.09% and 91.12%, respectively, due to gradually encroached by agricultural practices on each year dry out beds of lake zone during dry season and unawareness and reckless people left the lake as pond within the distant of 50 years ( and Figure 4). Therefore, these facts about lakes were revealed the shameless anthropogenic interferences on natural resources (Supp Table S2, and Figure S4).
3.3. The disappearance of the lake ecosystem
In 1969, out of 75 lakes, 12 lakes (Supp Table S3 and Figure S3) either seasonal disappeared or permanently vanished due to human interferences up to 2019. Lakes beds transformed into agricultural fields (production of cereal crops, and vegetables) and encroached through built-up (roads, houses, schools shops etc.) A very wondering matter about the area reduction of lakes (Kotwa, Singha, Barohi, Urwa, Bijra lakes, etc.) in the Tarai region of this sub-continent. This Tarai region has an enriched aquifer with high moisture-holding capacity and high groundwater level. But despite this above condition the beds of those lentic water-bodies gradually become shallow and move towards the path of extinction (Kerekes, Citation1977). It is a very poor sign for the preservation of resources for future generations and the sustainability of resources (Singh & Sharma, Citation2019). The medium extent of Singha lake disappeared and agricultural fields developed on the lake beds. Barohi and Chetra small extent lakes were also used as agricultural fields. 9 lakes (Bijra, Pokhngaon, Urwa, Kotwa, lakes, etc.) remained and used either farming land during the dry season or water-logged beds during the rainy season (Supp Table S3 and Figure S4). Therefore, the extent of reduced lake beds and loss of nominal identity of such lentic ecosystems are very shameful for the whole society, authorities, and stakeholders (Figure 2). Because all are very familiar to know about creating an artificial lake ecosystem is very expensive (Jeppesen et al., Citation2017).
3.4. Change detection in nomenclature of lakes within 50 years (1969 – 2019)
In the study area, there were 75 lakes existed in 1969, of which 9 lakes covered a total surface area of 1–100 square kilometers and recognised as medium size lakes (Chilua lake, Ramgarh lake, Sarua lake, Singha khurd lake, Jahda lake, Komar lake, Chhapia lake, Bhadarkhi lake, Jhura lake). About 16 lakes covered an area of 0.5–1.0 square kilometers and termed as small lakes (Jamwar lake, Rohuwa lake, Kaso lake, etc.). About 50 lakes covered the 0.1 to 0.5 and are considered as very small lake category. After 50 years, reduction in lake extent is detected due to many natural as well as anthropogenic reasons. Unfortunately, the identity of 9 medium-extent lakes are either changed or lost up to 2019. In which, 5 lake considered medium-size lakes (Chilua, Ramgarh, Sarua, Jahda, Komar lakes,) followed by Jhura lake, 2 lakes (Chappia and Bhadarkhi lakes), Singha lake transformed into very small size lake, large pond (below 0.1 kilometer square), disappeared lake respectively. Next, since 1969, 16 lakes (Nanwan, Kaso, Chetra, Barohi, matiari, Rohuwa lakes etc.) transformed into 8 small lakes, 6 very small lakes, 2 disappeared lakes (Chetra and Barohi lakes) up to 2019. After that, the remaining 50 small lakes (Senhaura, Sakra, Bakuchi, Jatia, Chanaila, Kulhi, Kwado lakes etc.) transformed into 26 very small lakes (Jatia, Chanaila, Kulhi, Kwado lakes etc.), 15 large ponds (Sarda, Chora, Narkhata lakes etc.) and 9 disappeared lakes (Urwa, Pokhagon, Bijra lakes etc.) upto 2019 (Supp Table S1, 2, 3, 4, Figure S5 and ).
3.5. Spatial vulnerability index (SVI) of alive 46 lakes (2019)
Spatial vulnerability index (SVI) analysis explores the level of vulnerability and its index is calculated by per cent of reducing the extent of lake size within a temporal reference of 50 years (1969–2019). This analysis focused on the urgent attention to the restoration of studied surface water bodies (lakes and ponds). SVI evaluated in three categories ( and ); 13 lakes (Ramgarh, Chilua, Jamwar, Jatia, Nanwan, Likhia etc. lakes) are measured as least vulnerable (below 29.26%) and lost about 311.20 hectares of potential area of such lakes. 25 lakes (Kulhi, Katal, Jhura, Sonra, Barhya etc. lakes) are calculated as moderately vulnerable (29.26–53.31%) and vanished about 619.90 hectares area of those lake beds. 8 lakes (Jhalla, Karpaicha, Chamraihya, Barj etc. lakes) are considered by high vulnerable (Above 53.31%) and lost about 290 hectares extent of the lake bottom floor.
Table 3. Spatial vulnerability index of alive lakes during 50 years (1969–2019).
3.6. Correlation between extent of lake and per cent of reduction in area of lake within 50 years
Regression analysis measured the significant correlation between current morphometric parameters (lake extent) and per cent of reduction in lake extent within 50 years (1969 – 2019) in the study area. Very weak correlation and close association of influenced variable with the trend line shown between the variables. Only two or three lakes are less influenced by per cent of the reduction in the extent of the lake due to either large area (Sarua, Chilua lakes) or implementation of management practices (Ramgarh lake). In this way, the reduction in lake extent depends on natural surface runoff as well as anthropogenic factors (rapid and haphazard urbanization, illegal settlement, solid waste dump and sewage entering into the lake, agriculture on the shallow lake bed, lack of stewardship, etc.). This regression (R2) analysis depicted the lake’s morphometric features. These morphological parameters are more to less distort through increasing reduced extent of the lakes between given time course. A very weak positive correlation was found between reducing per cent of the extent and current extent of the lake (R2 = 0.1336), average depth (R2 = 0.0035), circumference (R2 = 0.0543), and volume (R2 = 0.0728) of 46 lakes except for Ramgarh, Sarua, and Chilua lakes (). The extent of lakes is either large, medium or small, which has been considered by no effect on the average depth of lakes. It means, a small lake possibly exists at a greater average depth and similarly large lake poses to a lesser average depth and vice-versa is also possible to find. However, the reduction of average depth and volume of lakes depends on silt deposition through surface runoff, storm runoff, freely entering sewage sources, solid waste dump, no dredging activity (Ramsankaran et al., Citation2023; Berlinches, Citation2023) and lack of awareness etc. But, among these Tarai lakes, 3 lakes attained a very high value of morphometric parameters than the remaining lakes. These 3 lakes were gain very high value and are seen specifically on this scatter plot. The volume of Ramgarh, Sarua, and Chilua lakes are 13,078,325.09 meter cube 23,322,350.94 meter cube, and 22,804,003.20 meter cube, respectively. Whereas, the average depth of Sarua lake is 20 feet. The circumference of Chilua and Sarua lakes are 68,387.78 meters and 29,062.70 meters, respectively. The extent of Chilua, Ramgarh, and Sarua lake are 997.55 hectares, 708.13 hectares, and 382.58 hectares, respectively, attained much higher values than the rest of the lakes in Tarai region (Supp Table S5).
3.7. Restoration of lentic water bodies
Lakes and ponds act as filtering systems of water through pores of their bottom floor. These lentic water-bodies store and release the surplus water during rainy and drought, respectively (Jeppesen et al., Citation2017). These aquatic ecosystems maintain the hydrological circulation from precipitation to evaporation and again infiltration (Hyangya et al., Citation2021). In this way, the porosity of this Tarai region district had given a bountiful, pleasure, sustainable environment. So, we need to be custodians of nature but our shameless greed reached the exploitation level of resource utilization (Singh & Sharma, Citation2018). Hence, we are seen now falling water table, drying surface water, disappearing species (flora and fauns), disrupting of the ecosystem of aquatic bodies, plundering natural livelihood of people, lack to regulate the climate, flood, and drought (Heino et al., Citation2021). Thus, finally disturbing and degrading our sustainable environment. Urgent attention is also needed to check the hampering activity and understand the economic and environmental importance of lakes. For the conservation and restoration of the lake and other streams, some steps need to be taken. At first, fencing of the lakes with concrete proper embankments. Embankments prevent the shore of lake from erosion through surface runoff. Afforestation, mini forest develop along the lake shoreline and then save the lake from human encroaching tendency for their purpose. Harvesting of massive exotic flora, dredging out the bottom deposit materials to get rid of the lakes from excess shallowness and hyper-eutrophic status (Sharip et al., Citation2016; Singh & Sharma, Citation2018). Moreover, monitoring of water quality and maintaining meso-trophic to eutrophic levels. Setting up high quality lab equipped with modern testing instruments, trained personnel, and financial allocation for conducting sample surveys for water quality testing in a professional manner (Chausson et al., Citation2020).
4. Conclusion
Morphological change detection analysis depicts the change in water extent, progressive littoral coverage, and shallow beds lead to hyper-eutrophic status of lake ecology. These characteristics of the lentic ecosystem is pushed to become extinct very soon. The natural (silt deposition from surface runoff, storm runoff) and anthropogenic (sewage entering source, illegal settlement, infrastructural development, agricultural practice, dump of solid waste etc.) activities and lack of stewardship practices are responsible. This study discovered the change in the extent and identifiable nomenclature of lakes within 50 years (1969 – 2019). In 1969, 75 lakes were found but in the present time, only 46 lakes are currently alive. Among 75 lakes, 17 lakes became ponds and couldn’t exist as lakes according to surface extent. 12 lakes were either seasonally appeared as water logging zone or permanently extinct. This gradual reduction process lost the 2223.70 hectares potential extent of the lake bottom floor. The SVI analysed the level of vulnerability of lakes based on area reduction and urgency of lake restoration. About 13, 25, and 8 lakes were considered least, moderate and highly vulnerable. Regression (R2) analysis measured a very weak correlation between reducing the percent of extent (within 50 years) and current extent of the lake (R2 = 0.1336), average depth (R2 = 0.0035), circumference (R2 = 0.0543), and volume (R2 = 0.0728) of 46 lakes except for Ramgarh, Sarua, and Chilua lakes due to their larger extent. Therefore, some urgent conservation and restoration measures are essentially required through the planners and managers to save those lake ecosystems otherwise this growing rate of change will lead to a path of extinction in due course of period.
Corrected table of paperhighlightedCleanVersion.docx
Download MS Word (36.8 KB)Acknowledgments
The datasets analyzed here were combined with funding from the University Grant Commission, India, Banaras Hindu University. We thank all the organizations and people involved with this research work and the collection of these data.
Disclosure statement
No potential conflict of interest was reported by the author(s).
Data availability statement
Data will be made available if asked and required.
Supplementary material
Supplemental data for this article can be accessed online at https://doi.org/10.1080/24749508.2024.2328896
References
- Bekele, T., Lemma, B., & Mengistou, S. (2018). Interaction of local community and wetlands: The case of Lake Ziway shore area, Ethiopia. International Journal of Scientific and Research Publications, 420.
- Berlinches de Gea, A., Hautier, Y., & Geisen, S. (2023). Interactive effects of global change drivers as determinants of the link between soil biodiversity and ecosystem functioning. Global Change Biology, 29(2), 296–307. https://doi.org/10.1111/gcb.16471
- Birk, S., Chapman, D., Carvalho, L., Spears, B. M., Andersen, H. E., Argillier, C., Auer, S., Baattrup-Pedersen, A., Banin, L., Beklioğlu, M., Bondar-Kunze, E., Borja, A., Branco, P., Bucak, T., Buijse, A. D., Cardoso, A. C., Couture, R.-M., Cremona, F., de Zwart, D.… Hering, D. (2020). Impacts of multiple stressors on freshwater biota across spatial scales and ecosystems. Nature Ecology & Evolution, 4(8), 1060–1068. https://doi.org/10.1038/s41559-020-1216-4
- Chausson, A., Turner, B., Seddon, D., Chabaneix, N., Girardin, C. A., Kapos, V., Seddon, D., Key, I., Roe, D., Smith, A., Woroniecki, S., & Seddon, N. (2020). Mapping the effectiveness of nature‐based solutions for climate change adaptation. Global Change Biology, 26(11), 6134–6155. https://doi.org/10.1111/gcb.15310
- Chen, X., Zhao, X., Zhao, Y., Wang, R., Lu, J., Zhuang, H., & Bai, L. (2023). Interaction of Climate Change and Anthropogenic Activity on the Spatiotemporal Changes of Surface Water Area in Horqin Sandy Land, China. Remote Sensing, 15(7), 1918.
- Coppin, P. R., & Bauer, M. E. (1996). Change detection in forest ecosystems with remote sensing digital imagery. Remote Sensing Reviews, 13(3–4), 207–234. https://doi.org/10.1080/02757259609532305
- Cunha, D. G. F., Do Carmo Calijuri, M., & Lamparelli, M. C. (2013). A trophic state index for tropical/subtropical reservoirs (TSItsr). Ecological Engineering, 60, 126–134. https://doi.org/10.1016/j.ecoleng.2013.07.058
- Davidson, N. C. (2014). How much wetland has the world lost? long-term and recent trends in global wetland area. Marine and Freshwater Research, 65(10), 934–941. https://doi.org/10.1071/MF14173
- Deka, J., Tripathi, O. M., & Khan, M. L. (2011). A multi-temporal remote sensing approach for monitoring changes in spatial extent of freshwater lake of deepor beel ramsar site, a major wetland of Assam. Journal of Wetland Ecology, 5, 40–47. https://doi.org/10.3126/jowe.v5i0.4696
- De Voogt, K., Kite, G., Droogers, P., & Murray-Rust, H. (2000). Modelling water allocation between a wetland and irrigated agriculture in the Gediz Basin, Turkey. International Journal of Water Resources Development, 16(4), 639–650. https://doi.org/10.1080/713672530
- Dodds, W. (2002). Freshwater ecology: Concepts and environmental applications. Elsevier.
- Donia, N., & Farag, H. (2012). Monitoring Burullus lake using remote sensing techniques. Sixteenth International Water Technology Conference (Vol. 16, p. 2012), IWTC, Istanbul, Turkey.
- El-Hattab, M. M. (2015). Change detection and restoration alternatives for the Egyptian lake maryut. The Egyptian Journal of Remote Sensing & Space Science, 18(1), 9–16.
- Galatowitsch, D. M. (2018). Natural and anthropogenic drivers of wetland changes. In The wetland book II: Distribution, description, and conservation (pp. 359–367). Springer Nature.
- Gebretsadik, T., & Mereke, K. (2017). Threats and opportunities to major rift valley lakes wetlands of Ethiopia. Agricultural Research & Technology, 9(1), 1–6. https://doi.org/10.19080/ARTOAJ.2017.09.555751
- Gilarranz, L. J., Narwani, A., Odermatt, D., Siber, R., & Dakos, V. (2022). Regime shifts, trends, and variability of lake productivity at a global scale. Proceedings of the National Academy of Sciences, 119(35), e2116413119.
- Giweta, M., & Worku, Y. (2018). Reversing the degradation of Ethiopian wetlands: Is it unachievable phrase or a call to effective action. International Journal of Environmental Sciences & Natural Science, 14(5), 136–146. https://doi.org/10.19080/IJESNR.2018.14.555898
- Haack, B. (1996). Monitoring wetland changes with remote sensing: An East African example. Environmental Management, 20(3), 411–419. https://doi.org/10.1007/BF01203848
- Heino, J., Alahuhta, J., Bini, L. M., Cai, Y., Heiskanen, A. S., Hellsten, S., Kortelainen, P., Kotamäki, N., Tolonen, K. T., Vihervaara, P., Vilmi, A., & Angeler, D. G. (2021). Lakes in the era of global change: Moving beyond single‐lake thinking in maintaining biodiversity and ecosystem services. Biological Reviews, 96(1), 89–106. https://doi.org/10.1111/brv.12647
- Horne, A. J., & Goldman, C. R. (1994). Lake ecology overview limnology. McGraw-Hill Co.
- Hossen, H., & Negm, A. (2016). Change detection in the water bodies of Burullus Lake, Northern Nile Delta, Egypt, using RS/GIS. Procedia Engineering, 154, 951–958. https://doi.org/10.1016/j.proeng.2016.07.529
- Hutchinson, G. E. (1957). A treatise on limnology: Geography, physics and chemistry (Vol. 1). Wiley.
- Hyangya, B. L., Riziki, J. W., Masilya, P. M., Zabene, F. Z., Alunga, G. L., Kaningini, B. M., & Kankonda, A. B. (2021). Physico‐chemical characterization of littoral water of Lake Kivu (southern basin, Central Africa) and use of water quality index to assess their anthropogenic disturbances. World Water Policy, 7(2), 166–193. https://doi.org/10.1002/wwp2.12059
- Jeppesen, E., Søndergaard, M., & Liu, Z. (2017). Lake restoration and management in a climate change perspective: An introduction. Water, 9(2), 122. https://doi.org/10.3390/w9020122
- Jorgensen, S., Tundisi, J. G., & Tundisi, T. M. (2013). Handbook of Inland aquatic ecosystem management, applied ecology, and environment management. Taylor and Francis Group. (Vol. 5). CRC Press.
- Karim, F., Petheram, C., Marvanek, S., Ticehurst, C., Wallace, J., & Hasan, M. (2016). Impact of climate change on floodplain inundation and hydrological connectivity between wetlands and rivers in a tropical river catchment. Hydrological Processes, 30(10), 1574–1593.
- Kerekes, J. (1977). The index of lake basin permanence. Internationale Revue Der Gesamten Hydrobiologie Und Hydrographie, 62(2), 291–293. https://doi.org/10.1002/iroh.1977.3510620207
- Lu, D., Mausel, P., Brondizio, E., & Moran, E. (2004). Change detection techniques. International Journal of Remote Sensing, 25(12), 2365–2401. https://doi.org/10.1080/0143116031000139863
- Madgwick, F. J. (1999). Strategies for conservation management of lakes. In The Ecological Bases for Lake and Reservoir Management: Proceedings of the Ecological Bases for Management of Lakes and Reservoirs Symposium, held 19–22 March 1996, Leicester, United Kingdom (pp. 309–323). Springer. https://link.springer.com/content/pdf/10.1023%2FA%3A1017086626140.pdf
- Mason, I. M., Guzkowska, M. A. J., Rapley, C. G., & Street-Perrott, F. A. (1994). The response of lake levels and areas to climatic change. Climate Change, 27, 161–197. https://doi.org/10.1007/BF01093590
- Mercier, G., Derrode, S., Trouvé, E., & Bombrun, L. (2010). Change detection in remote sensing observations. Multivariate Image Processing: Methods and Applications, 95.
- Messager, M. L., Lehner, B., Grill, G., Nedeva, I., & Schmitt, O. (2016). Estimating the volume and age of water stored in global lakes using a geo-statistical approach. Nature Communications, 7(1), 13603. https://doi.org/10.1038/ncomms13603
- Mi, H., Fagherazzi, S., Qiao, G., Hong, Y., & Fichot, C. G. (2019). Climate change leads to a doubling of turbidity in a rapidly expanding Tibetan lake. Science of the total environment, 688, 952–959.
- Mitra, A. (2010). Saving a dying lake: The case of Ramgarh Tal in Gorakhpur, Uttar Pradesh. Unpublished Sectoral Study. Gorakhpur Environmental Action Group, Asian Cities Climate Change Resilience Network (ACCCRN).
- Mukherjee, S., Rizvi, S. S., Biswas, G., Paswan, A. K., Vaiphei, S. P., Warsi, T., & Mitran, T. (2023). Aquatic Eco‐systems Under Influence of Climate Change and Anthropogenic Activities: Potential Threats and Its Mitigation Strategies. Hydrogeochemistry of Aquatic Ecosystems, 307–331.
- Ramachandra, T. V. (2008). Spatial analysis and characterisation of lentic ecosystems: A case study of Varthur Lake, Bangalore. International Journal of Ecology & Development, 9(W08), 39–56.
- Ramchandra, T. V. (2009). Conservation and management of Urban Wetlands: Strategies and challenges. http://wgbis.ces.iisc.ernet.in/energy
- Ramsankaran, R. A. A. J., Verma, P., Majeed, U., & Rashid, I. (2023). Kayak-based low-cost hydrographic surveying system: A demonstration in high altitude proglacial lake associated with drang drung glacier, Zanskar Himalaya. Journal of Earth System Science, 132(1), 9. https://doi.org/10.1007/s12040-022-02021-w
- Salman, M. A., Nomaan, M. S. S., Sayed, S., Saha, A., & Rafiq, M. R. (2021). Land use and land cover change detection by using remote sensing and gis technology in Barishal District, Bangladesh. Earth Sci Malaysia, 5(1), 33–40.
- Schneider, J. C. (2000). Manual of fisheries survey methods II: With periodic updates (no. 25). Lansing, MI: Michigan Department of Natural Resources, Fisheries Division.
- Sharip, Z., Suratman, S., & Shaaban, A. J. (2016). A national research and development blueprint for sustainable lake basin management in Malaysia. Lakes & Reservoirs: Research & Management, 21(4), 269–283. https://doi.org/10.1111/lre.12146
- Singh, A. (1989). Review Article Digital change detection techniques using remotely-sensed data. International Journal of Remote Sensing, 10(6), 989–1003. https://doi.org/10.1080/01431168908903939
- Singh, A., & Sharma, V. N. (2018). A stewardship of Ramgarh Lake in Gorakhpur district: Uses, problems and management, transaction. Institute of Indian Geographers, 40(1), 33–43.
- Singh, A., & Sharma, V. N. (2019). A comparative assessment of anthropogenic pressure and trophic levels of urban (Ramgarh lake) and rural (chilua lake) lakes of Gorakhpur District, U.P. National Geographical Journal of India, 65(4), 340–349.
- Sowmyashree, M. V., & Ramachandra, T. V. (2012, November). Temporal analysis of water bodies in mega cities of India. In LAKE 2012: International Conference on Conservation and Management of Wetland Ecosystems, Mahatma Gandhi University, Kottayam, Kerala, India (pp. 6–9).
- Taube, C. M. (2000). Instructions for winter lake mapping. Chapter 12 in Schneider, James C. (ed.) 2000. Manual of fisheries survey methods II: With periodic updates. Fisheries Special Report, 25. Michigan Department of Natural Resources.
- Turner, B., Meyer, W. B., & Skole, D. L. (1994). Global land-use/land-cover change: Towards an integrated study. Ambio Stockholm, 23(1), 91–95.
- Vyas, L. N., Sharma, K. P., Sankhla, S. K., & Gopal, B. (1990). Primary production and energetics. In Ecology and management of aquatic vegetation in the Indian subcontinent, (pp. 149–175).Dordrecht: Springer Netherlands.
- Zekarias, T., & Gelaw, A. (2023). Impacts of land use/land cover change on wetland ecosystem services of Lake Abaya-Chamo wetland, Rift Valley of Ethiopia. Geology, Ecology, and Landscapes, 1–12. https://doi.org/10.1080/24749508.2023.2202436