
ABSTRACT
Most devices are now connected through the Internet, so cybersecurity issues have raised concerns. This study proposes network services in a virtual environment to collect, analyze and identify network attacks with various techniques. Our contributions include multi-fold. First, we deployed Honeynet architecture to collect network packets, including actual cyber-attacks performed by real hackers and crackers. In the second contribution, we have leveraged some techniques to normalize data and extract header information with 29 features from 200,000 samples of many types of network attacks for abnormal packet identification with machine learning algorithms. Furthermore, we introduce an Adaptive Cybersecurity (AC) system to detect attacks and provide warnings. The system can automatically collect more data for further analysis to improve performance. Our proposed method performs better than Snort in detecting dangerous malicious attacks. Finally, we have experimented with different cyber-attack approaches to exploit the ten website security risks recommended by the Open Web Application Security Project (OWASP). From the research results, the system is expected to be able to detect cybercriminal attacks and provide early warnings to prevent a potential cyber-attack.
1. Introduction
The fourth industrial revolution has pushed many countries to focus on developing digital government and digital businesses, leading to users preferring to interact with cyberspace to serve life needs such as business, shopping, and entertainment. Furthermore, the Coronavirus Disease of 2019 (COVID-19) pandemic is an infectious pandemic that spreads quickly among people, so cyber activities have replaced face-to-face communication activities. In addition, the pandemic is still complicated. Hence, organizations have transformed their traditional business models into cyberspace. As a result, cybercrime has increased in cyberspace in the working environment of governments, businesses, and citizens. Furthermore, it poses new cybersecurity challenges that need to be managed.
Cyberattack is the intentional exploitation of cyberspace and the illegal exploitation of information and information systems. Thousands of websites and applications are being attacked daily because of software vulnerabilities, attachments, and improper configuration on servers. As stated by Sun (Citation2016), when cyberattacks occur, attackers use malicious code to change a computer system's code, logic, or data of a computer system. It can lead to destructive consequences, from a warning to severe cybercriminals, such as identity and information theft, that can harm critical data. In order to fully appreciate these destructive consequences and take preventive action, it is necessary to obtain detailed information about attacks and identify attack points of origin. Cyberattacks taking place worldwide can be instantly tracked through several Special Purpose Websites. Some of these systems, belonging to several private companies, display the source of the attack, the type of attack, the target of the attack, the attacker's IP address, the service port, and the attacker's geographic location.
Attacks on cyberspace, data, and information systems are possible because information technology systems are enormous and complex. Through their size and complexity, vulnerabilities exist that can be exploited. For example, a smartphone was designed by one company in Vietnam but assembled abroad using materials from another country. It runs on software developed by one company, but the operating system borrows code from other companies. All that complexity exists before the device reaches the user. When the user has the device, it can be connected to various networks such as a home wireless network, a corporate network, or a mobile network, each with its infrastructure and sharing the common Internet infrastructure. Although the interconnected nature of all these services is necessary to ensure the smartphone works, this vast, complex interconnection will present security holes in the system. In our study, abnormal packets refer to packets that can be used for attacks and are harmful to computers.
Cybercriminals' many consecutive actions carry out a cyberattack. United States Army Cyber Command (ARCYBER) inFootnote1 reported a seven-stage cyberattack cycle for cybercriminals. By interrupting any action in the cybercriminal's attack cycle, we can prevent their attack. Numerous methodologies for data collection in networks have been proposed for further analysis. Since then, many network intrusion detection systems (IDSs) have been developed with solutions to improve cyber security efficiency. Professional organizations in network security often develop IDSs, with security solutions continually being improved by the highly specialized team to ensure users' safety in cyberspace. On the other hand, researchers have introduced network penetration detection models with many Machine learning techniques such as k Nearest Neighbors, Genetic Algorithms, Neural Networks, presented by Su (Citation2011), Kaur (Citation2016), and Subba et al. (Citation2016), respectively. However, previous studies have not fully presented the stages of intrusion detection system development and lack of detailed description of data collection and data processing.
In this study, we develop a self-adaptive intrusion detection system (IDS) that effectively detects intrusion detection and network attack warning from the above research results. Furthermore, the IDS can be utilized by individuals possessing self-update technician qualifications to improve system performance, detect novel attacks, and safeguard their networks. Our contributions are multi-fold:
We have successfully developed an effective Intrusion Detection System-Adaptive Cybersecurity (IDS-AC) in intrusion detection and network attack warning. The IDS-AC is designed to be easy to upgrade and improve the efficiency of detecting novel attack patterns by users at a technical level.
We have deployed Honeynet to collect data in Can Tho city, Vietnam. Various experts attacked our server, and the data were used to investigate and evaluate the proposed method's efficiency. The HNET20 dataset was obtained in the practical cases for eight months. HNET20 includes 29 features extracted from the packet header information.
We have leveraged robust classic machine learning and deep learning algorithms to perform the classification tasks on packets in the form of one-dimensional (1D) data. Important hyper-parameters of such algorithms (the number of filters, the number of convolutional layers for convolutional neural networks, and the number of trees for tree-based classifiers) are taken into account to select the appropriate setting for deployment. Moreover, we have attempted a scaling algorithm for preprocessing data before fetching them into machine learning algorithms. As observed from the experiments, scaling can be incredibly effective in convolutional neural networks.
The rest of the paper is organized as follows (Section 1). Then, we will discuss several related studies on detecting abnormal network streams (Section 2). After that, we will elaborate on our architecture and algorithms (Sections 3 and 4). Subsequently, our experiments for the system will be explained in Section 5, evaluated and compared in Section 5.4. Finally, we will summarize our studies' key features and development directions (Section 6).
2. Related work
Many scientists have been attracted to Honeynet architectures in numerous research related to classifying and detecting abnormal Network Streams. Maesschalck et al. (Citation2022) provided a survey on deployments of honeypots for Industrial Control Systems. In addition, the authors discussed how honeypots could aid in fulfilling regulatory goals. Staudemeyer and Omlin. (Citation2014) introduced salient features for network intrusion detection on KDD Cup '99 datasets. Ren et al. (Citation2021) presented Theory on Honeynet to evaluate honeynet potency. In addition, Perkins and Howell (Citation2021) gave us an overview of honeypot research in computer and social science. With more comprehensive information, Sheikh (Citation2021) presented a valuable overview of evading Intrusion Detection Systems, Firewalls, and Honeypots for administrators to protect their networks. Franco et al. (Citation2021) gave an overview of applications of honeypots and honeynets for the Internet of Things (IoT), the Industrial Internet of Things (IIoT), and Cyber-Physical Systems (CPS) with taxonomy and extensive analysis. Sheng et al. (Citation2021) introduced a mathematical approach for intelligent Honeynet to analyze and prevent the propagation of industrial viruses in the Supervisory Control and Data Acquisition network. In addition, Krishnaveni and Prabakaran (Citation2019) leveraged Honeynet to collect Network Streams on cloud environments that were then classified by supervised learning and Unsupervised learning algorithms. Wang et al. (Citation2022) presented another work using 462 honeypots located in 22 countries to obtain real-world attack activities and then introduce an algorithm to identify control periods.
Numerous types of research were done on abnormal packet detection with classic machine learning algorithms. Dong (Citation2021) deployed Support Vector Machines (SVM) to classify to detect abnormal packets with a false positive rate of abnormal communication packets of less than 3%. In another work of Spiekermann and Keller (Citation2021), scientists considered and explored highly flexible networks and their inherent on-demand changes, including the migration of virtual machines, SDN-programmability, and user customization, and provided good performance in the detection of anomalies. Mishra (Citation2021) also deployed SVM to stratify Distributed Denial of Service (DDoS) attacks with an accuracy reaching 98.8%. The scientists, including the work of Aung and Htaik (Citation2020), attempted to incorporate entropy with SVM in anomaly detection on the features with four parameters source IP, destination IP, source port, and fixed destination port. A random forest algorithm was also presented by Niandong et al. (Citation2020) for robe flow anomaly detection in a highly reliable security detection. Li et al. (Citation2020) introduced a method, Auto-Encoder Intrusion Detection System (AE-IDS), which used a random forest algorithm for the prediction. Albaqami et al. (Citation2021) proposed an Automatic detection method of abnormal electroencephalogram signals using Wavelet Packet Decomposition (WPD) techniques to decompose the electroencephalogram signals into frequency sub-bands and extract a set of statistical features to do detection tasks. Song et al. (Citation2020) integrated and leveraged the benefits of the high true positive rate of Network-based IDS (NIDS) and the ability of Host-based IDS (HIDS) to monitor system behaviour and perform the detection with a decision tree which obtained a 97.8% detection rate.
Deep learning approaches have been presented in various studies to detect abnormal packets. As mentioned by Park et al. (Citation2020), the authors used a Long Short-term memory architecture with a two-gram and a sliding window of N-gram to perform cosine similarity as a scoring function for anomaly detection tasks. Abd et al. (Citation2020) implemented an Artificial Neural Network (ANN) to monitor the state of the car by information collected from internal buses and to achieve security, the safety of the internal network obtained a false-positive rate of 1.7%, a false-negative rate of 24.6%, and an average accuracy of 92.10%. Another work of Larriva-Novo et al. (Citation2020) performed tasks to determine which learning algorithm and hyper-parameters can provide higher performance depending on Cybersecurity Dataset Characteristics. Kwon et al. (Citation2019) explored the transport layer attack in data acquisition and the protocols with one bidirectional recurrent neural network (RNN) to detect cyberattacks. The convolutional neural network-based payload classification approach (PL-CNN) and a recurrent neural network-based payload classification approach were attempted in (PL-RNN) by Liu et al. (Citation2019) to detect attacks and to reach accuracies of 99.36% and 99.98%, respectively. Another study proposed by Feng et al. (Citation2017) implemented a stacked Long Short-Term Memory (LSTM) network-based softmax classifier to extract package signatures to predict package traffic. The framework, namely CANnolo, was introduced by Vinayakumar et al. (Citation2019) and Longari et al. (Citation2021) using LSTM-autoencoders to identify anomalies in Controller Area Networks (CANs). Some works related to LSTM were presented by Jo et al. (Citation2020), Zhong et al. (Citation2020), Salim et al. (Citation2021), and Wakui et al. (Citation2021), which obtained high accuracy in abnormal packet detection tasks.
3. The proposed architecture
This work aims to study and deploy Honeynet architecture for the data collection of cyber-attacks in Can Tho city, Vietnam. In addition, we construct a system based on artificial intelligence algorithms to detect and produce warnings of network attacks to protect administrative units and companies in Can Tho city. V. K. Nguyen et al. (Citation2019) implemented a data collection model in detail and tested the network attack for data collection, analysis, and feature extraction of network attack data. Since then, we have successfully proposed and deployed an IDS-AC workflow for data collection and network attack warning with three main components, as shown in Figure .
Figure 1. A workflow for Cyberattack alert and data collection by V. K. Nguyen et al. (Citation2019).
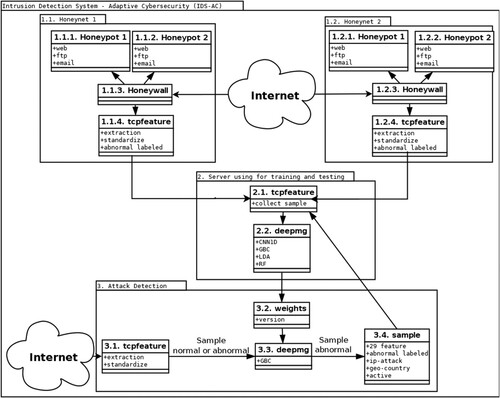
| (1) | Honeynets: These are considered vulnerable targets for cybercriminals to penetrate and exploit. Honeynets can store anomalous data flows and be extracted by tcpfeature into Samples with 29 features labelled as ‘abnormal’ to detect and provide warnings for network attacks. | ||||
| (2) | Server using for training and testing. This phase aggregates the records labelled ‘abnormal’ from Honeynets, Detect_attacks, and creates more data streams labelled ‘normal’ by performing normal user and administrative operations on Hosting with Internet services. Then, we deployed deepmg (proposed by T. H. Nguyen et al. (Citation2019, 3)) to train to obtain the weighted from machine learning models and choose the best classifier that provides an update Detect_attacks system to increase accuracy in monitoring network data flow and warn if a prediction is ‘abnormal’. The algorithms, including Random Forests (RF), Gradient Boosting Classifier (GBC), Linear Discriminant Analysis (LDA), and Convolutional Neural Networks on 1D data (CNN1D), are considered for packet classification tasks. Then, we select the best one from the experimental results to deploy in our system to provide warnings on abnormal packets. | ||||
| (3) | Attack Detection: The distributed online system can monitor the network systems and provides warnings when an ‘abnormal’ data flow enters the system. This module also collects Messages labelled ‘abnormal’ and information such as the cybercriminal computer's IP address, geographic location, and the administrator's troubleshooting action when they encountered the warning. Records that are marked as ‘unusual’ can provide more samples for further training to improve the accuracy of the model. | ||||
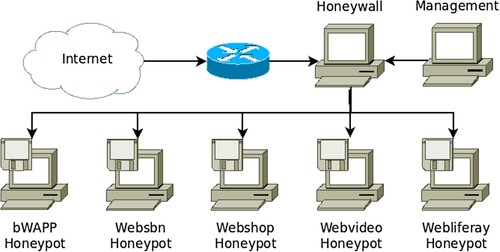
3.1. Honeynet architecture to collect data
The experiments have run on Windows Server 2012 R2 operating system machines, with VMware Workstation 12 to set up Honeynet system on physical Server CPU Xeon(R) 2.13 GHz; 32 GB RAM; 500 GB HDD.
We have deployed a data collection model based on Gen II Honeynet architecture (proposed by Provos and Holz (Citation2007)), with a design as exhibited in Figure including three components:
| (1) | Honeypots are designed to attract attackers using older operating systems, frameworks, and libraries with vulnerabilities. Moreover, the Honeypot is an effective tool to monitor and save traces of attacks, helping scientists and network administrators catch the system's security holes. | ||||
| (2) | Honeywall is a transparent Gateway for highly interactive Honeypots in the Honeynet and is undetectable by an attacker. Honeywall performs logging and control of access to and from Honeypot by Snort. Snort is an open-source network penetration detection system capable of performing real-time network traffic analysis and network packet logging using Internet protocols. In addition, it can perform protocol analysis, aggregation, or content search. Moreover, it can detect many types of attacks and probes, such as Buffer Overflow, Stealth Port Scan, CGI Attack, SMB Probe, OS Fingerprinting Attempts, etc. | ||||
| (3) | Management connects SSH to Honeywall to retrieve analytical data. In addition, an SSH connection makes remote Honeywall access secure. | ||||
Figure 2. Honeynet architecture collects network attack data.
The Honeynet architecture requires a component that provides Gateway functionality called a Honeywall. The Honeywall is the first element of the Honeynet with which the attacker will interact and is the router for the attacker to penetrate the Honeypot. The authors use CentOS 7 and Snort 2.9.16.1 operating systems in the research content to set up Honeywall. The steps to install and configure Snort on CentOS are on www.snort.org.
We installed CentOS 7 on a virtual machine with the configuration: 4 Core CPU, 4GB RAM, 500GB HDD, and 03 network interfaces. The network interface ‘ens33’ type (NAT) connects to the Internet to set up settings, monitor logs, and retrieve acquired data. The network interface ‘ens34’ type (Bridge) and ‘ens35’ type (Host-only) connect through the bridge ‘br0’ to connect from the network are outside the Internet to the Honeypot system. The setting ups for the bridge, the interface ‘ens34’ and the interface ‘ens35’ are listed below.
The setting up information for the bridge:
$vi /etc/sysconfig/network-scripts/ifcfg-br0
DEVICE=br0
NAME=br0
TYPE=Bridge
STP=off
ONBOOT=yes
BOOTPROTO=none
IPADDR=192.168.1.10
NETMASK=255.255.255.0
NM_CONTROLLED=no
The setting up information for the network with the interface ‘ens34’:
$vi /etc/sysconfig/network-scripts/ifcfg-ens34
TYPE=Ethernet
NM_CONTROLLED=no
DEVICE=ens34
ONBOOT=yes
BRIDGE=br0
The setting up information for the network with the interface ‘ens35’:
$vi /etc/sysconfig/network-scripts/ifcfg-ens35
TYPE=Ethernet
NM_CONTROLLED=no
DEVICE=ens35
ONBOOT=yes
BRIDGE=br0
3.2. Honeypots setting
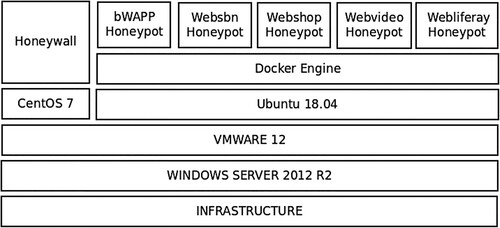
Containerization excels in the microservices architecture increasingly identified with cloud-native web applications. Furthermore, the introduction of containerization engines such as Docker and Linux Containers motivated organizations to utilize the service for cloud scalability. As a result, containerization is becoming increasingly popular among cloud providers (as mentioned by Sturm et al. (Citation2017)). Docker is the industry standard for Container solutions and an open-source platform with a global support community. In addition, Docker is used for deploying Honeypots. We investigated the technological status of websites for administrative assistants in Can Tho city. Furthermore, we simulated Honeypots as vulnerable targets and deployed them as Honeynets to collect actual data as illustrated in Figure . Furthermore, we deployed some frameworks such as WordPress, OpenCart, YouPHPtube, and Liferay Portal that were transformed into WebSBN Containers, Webshop Containers, Web video Containers, Webliferay Containers, and bWAPP.Footnote2 In addition, they can contain more than 100 Website Vulnerabilities, including all known Major Website Vulnerabilities and OWASP's Top 10 Project Risks.
Figure 3. Container of a Honeynet Architecture for actual data collection.
3.3. Honeynet access authorization
Vetterl et al. (Citation2019) introduced Implicit authorization for many system access rights. The website servers expect visitors to visit and use the established functions. For example, anonymous FTP servers provide access to files when the user has authenticated an anonymous 'Anonymous' account, which is conventionally provided with an Email address and password.
This study has pointed to two problems. The first problem is that the object identification stage, i.e. IPv4 address scanning, is legal because the systems are implicitly allowed to interact by connecting to the Internet. In addition, accessing identified Honeypots also avoids behaviour that is considered illegal. Another problem is that when installing a highly interactive Honeypot on the Internet, the installer wants users to send commands to it. As a result, the Honeypot deployment team might be disappointed if no one interacts with their Honeypot.
3.4. Data collected from Honeynet
We deployed Honeynet for eight months and obtained 1GB of data. The alert file provided much information (as shown in Table ) to help us visualize the cyber attack situation of Can Tho city. Tcpdump binary also allows feature extraction to train machine learning models and provide warnings of network attacks.
Table 1. Information extracted from alert.
The data extraction results according to the standard attack pattern (Table ) show the most dangerous traffic flow and protocol decryption with the most warning. Next is to override administrative privileges with Website attacks and denial of service. Finally, attack types such as user overriding, information leakage, and Trojan take place lower.
Table 2. General attack type collected.
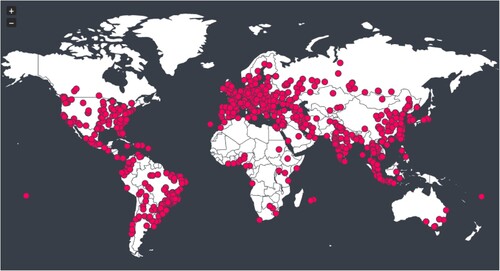
According to the chart in Figure (a), the density of the IP scanning network in Can Tho city from many countries with many IP addresses and very high scanning density, the highest falls in the last months of the considered year. Figure shows the geographical locations of IPs that have scanned the network of Can Tho city Footnote3 to indicate the IP address JvectormapFootnote4 and visualize the address on the map. With 115 countries with IP addresses scanning Honeynet in 8 months of deployment.
Figure 4. Threats detected by various approaches. (a) Honeynet. (b) Firewall.
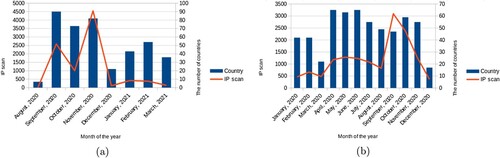
Figure 5. Distribution of locations where accessed our experimental servers exhibited on a world map.
We have extracted data from the Firewall system to protect the network of administrative websites of Can Tho city. Figure (b) shows that the scanning density of IP is very high, and in many countries, the highest density at the end of the year is similar to the data obtained from Honeynet. The lowest has 17 countries where the hackers scanned the network, while at a period, there were numerous hackers from 65 countries performing the IP scanning. Furthermore, in many countries, they have made efforts to ensure network security, adapt to the constantly changing cybersecurity situation, and ensure that they are always ahead of crimes committed a step. Table illustrates some samples with spam and malware threats collected by our server firewall.
Table 3. Emails of spam and malware in 2020 collected via Firewall.
As seen from Figure , the density of IP scans in the last months of the year increases abnormally. When Can Tho city and the whole country occurred, the critical event of organizing Party congresses at all levels led to the 13th National Party Congress, so cybercriminals actively infiltrated. Hackers can take secret information or destroy information systems when they successfully attack the network. Cybercriminals can now be hostile forces at home and abroad. In addition, cybercriminals can exploit information to make profits from the collected information.
4. Machine learning for packets classification
4.1. Normalization of HNET20 dataset obtained from Honeynet
The study of V. K. Nguyen et al. (Citation2019) proposed 29 data characteristics of network packets (Table ) effective in applying Artificial Intelligence, Machine Learning, and Deep Learning to the classification of abnormal and normal data streams. The proposed 29 features were extracted basing on exploring the KDDCup'99 dataset (Tavallaee et al., Citation2009). Features 1 to 9 build on the header information of the network packet, ten based on domain knowledge, and the remaining features build on statistics in time 2 seconds of connections.
Table 4. 29 characteristics of network attack data.
This phase includes three steps to normalize the dataset for training Machine Learning and Deep Learning models. The topic uses DELL Latitude 4620 Laptop, 2.5GHz Core i5 CPU, 8GB RAM, 250GB HDD, and Ubuntu 18.04 operating system to standardize datasets for training Machine Learning and Deep Learning models.
Step 1: We extracted data obtained from the Honeynet with the proposed 29 features (presented in Table ). Execution time is about 96 hours to extract data with such features. Data are classified and assigned with labels of ‘High’, ‘Medium’, and ‘Low’ by Snort's rules.
Step 2: We performed normal administrative and user operations on our hosting with normal Internet services to create samples labelled as ‘normal’ packets. We obtained 0.9GB of such network packet data and extracted it with 29 features.
Step 3: We merged two datasets in Step 1 and Step 2, respectively, into a dataset, namely HNET20, and scaled the samples with some techniques such as Quantile Transformation. The data were then fetched into machine learning algorithms for abnormal packet detection.
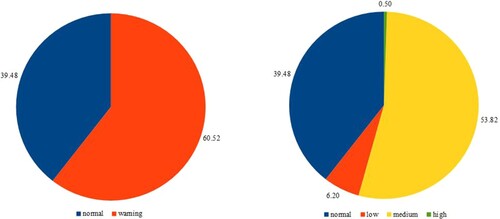
HNET20 consists of four labels (‘Normal’, ‘Low’, ‘Medium’, ‘High’ described in Table ) with a total of 198,986 samples. In addition, We created another dataset, the HNET20a dataset from HNET20, with only two classes, including normal and abnormal packets, with a warning including Low, Medium, and High levels for the binary classification tasks.
Table 5. Information about the number of records of the two experimental datasets.
Figure shows the proportional distribution between classes of tasks. The number of normal network data lines accounts for nearly 40%. The alarm data accounts for 60%, mainly about medium level warnings (medium) with over 50%, high warnings about 0.5%, and low about 6.2%. In the experimental part, we also evaluate the effectiveness of Machine Learning algorithms when running on binary and multi-class classification problems (4 classes as described above).
Figure 6. Percentage distribution of classes in collected data. The left chart reveals the data class distribution of the binary classification tasks, while the other exhibits 4-class classification tasks.
4.2. Data visualization with LDA
As stated by Yusof et al. (Citation2022), the use of visualization can assist in identifying any data distortion prior to developing good classifier models. Linear Discriminant Analysis (LDA), as presented by Tharwat et al. (Citation2017), is a supervised machine learning to find linear combinations of objects and can provide good visualization for data. Like Logistic Regression, LDA is a linear classification technique with the following additional capabilities compared to Logistic Regression. First, LDA can be applied to two-class or multi-class classification problems. Second, unlike Logistic Regression, LDA performs better when the layers are well separated. In addition, LDA performs relatively well compared to Logistic Regression, even when we have little data.
LDA is also a dimensionality reduction technique. As the name implies, dimensionality reduction techniques reduce the number of dimensions (i.e. variables or dimensions or features) in the data set while retaining as much information as possible. With the advantages of the LDA algorithm, we use the LDA algorithm to represent the collected data on the 2D graph. After transforming the data with the LDA algorithm, we have shown the distribution of records on the histogram as shown in Figure . The green points (medium risk) account for the highest proportion distributed on the right side of the graph. The second-highest proportion is the unwarranted network flows occupying the upper left part. From the graph, it can be concluded that the 29 proposed features effectively classify the network attack data stream.
Figure 7. LDA-based classification data representation.

4.3. Machine learning algorithms for of network data classification
The classification tasks are performed using commonly-used machine learning algorithms, including Random Forest (RF), Gradient Boostin Classifier (GBC), Linear Regression, and Convolutional Neural Network (CNN).
With different data distributions of features, we use Quantile Transformation (QTF) algorithm to convert all values to the range of values [0-1] that Deep Learning algorithms can converge. QTF is a non-linear transformation, considered a powerful preprocessing technique because it reduces the influence of Outlier values. After the transformation, we proceed to ‘Binning’ the data. This technique has been used and evaluated in studies of T. H. Nguyen and Zucker (Citation2019).
In the implementation phase, we deployed two groups of algorithms. The first group includes classical machine learning algorithms such as Random Forest, Linear Discriminant Analysis, and Gradient Boosting Tree, and the second consists of a deep learning algorithm, Convolutional Neural Networks on 1D data (CNN1D), that has been commonly used in a vast of studies related to classifying network packets. These algorithms are also evaluated with various values of hyper-parameters. Finally, we use LDA as a baseline to compare with robust algorithms such as Random Forest, Gradient Boosting Tree, and CNN1D.
5. Experimental results
The experiments aim to evaluate the efficiency of scaling algorithms in data preprocessing (Section 5.1). In addition, hyper-parameters of the considered algorithms on packet classification tasks are examined to choose appropriate values to obtain good results (Section 5.2). Then, we compare the performance based on selected hyper-parameters on various task types to select the best one for deploying in IDS-AC (Section 5.3). Finally, we present a performance comparison with Snort.
The dataset is divided and evaluated by dividing the training set and the test set according to the stratified five-cross-validation approach. Therefore, we have 80% of the records used for the training set, and the test set occupies 20%. Next, we train the model on the training dataset and test the effectiveness of the test set. The performance of each classifier is measured by an average result over five times repeated five folds with metrics of ACCuracy (ACC) and Area Under the Curve (AUC).
Convolutional Neural Networks use batch sizes of 10,000, using Adam's optimal function with a learning rate of 0.001. Each filter has a size of 3. To reduce the overfitting problem, we use the Early Stopping technique with an epoch patience of 5. If, after five epochs, the training results still improve, then training will be continued. In the case we do not face overfitting issues, the experiment can run to a maximum of 500 epochs.
All experiments are run on a server installed with Ubuntu 20.04 with 72 cores clocked at 2.2GHz for each and a RAM of 300GB. Experiments are performed with commands in the Python programming language.
5.1. Data preprocessing
Figure , we present the results without preprocessing and preprocessing on the dataset with Binning technique presented in the study of T. H. Nguyen and Zucker (Citation2019). As can be seen that the CNN1D has a very significant improvement, while the LDA algorithm only gives a slight improvement. With algorithms like RF, there is no change. There was a difference in the case of CNN1D with raw data. The results showed that CNN1D on the raw data met underfitting issues. With the underfitting issues, CNN1D on raw data could not capture the dominant trend within the data, leading to low results in both training and test sets. As observed, CNN1D poorly performed the classification tasks on the raw data that looked like a random prediction with performances of 0.52 and 0.56 in the training and test set, respectively. In the case of random prediction, there may be a significant performance difference between the training set and the test set. In addition, the results revealed that scaling might not be necessary for random forests. These results are similar to the study of Ozsahin et al. (Citation2022) where the authors stated that ‘The random forest model performed significantly well without implementing any feature scaling technique’.
Figure 8. Performance comparison of classic machine learning and deep learning algorithms. The X-axis includes abbreviations of the method names, while Y-axis shows the accuracy metric.
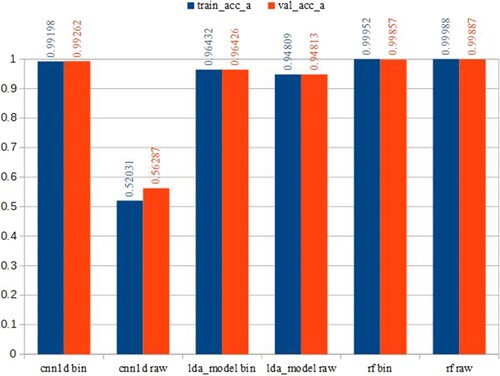
The results are shown on the training dataset (train_acc_a) and the test dataset (val_acc_a). ‘Raw’ in the name of the horizontal axis values indicates that we use unprocessed raw data. On the other hand, before binning, we preprocess the data with QTF and Binning according to the analysis method and divide the intervals by width. In the following sections, with the results of Convolutional Neural Networks and LDA algorithms, we will only present the results with preprocessed datasets.
5.2. Abnormal packet detection using various machine learning algorithms with different sets of hyper-parameters
This section presents experimental results to investigate predictive performance with different hyper-parameters distinguishing abnormal and normal packets. Figure illustrates the results of different numbers of trees (50, 500, and 1000) on two RF and GBC Machine Learning algorithms. Figures and reveal the results performed with different numbers of convolution layers and different numbers of Filters.
Figure 9. Training and testing results with ACC and AUC measurements. The X-axis includes abbreviations of the method names while Y-axis shows the numbers ranging from 0.5 to 1 to reveal the performance in accuracy and AUC.
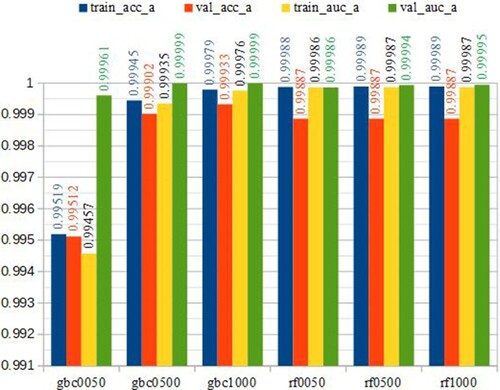
Figure 10. Results of ACC and AUC with different filters on CNN1D.
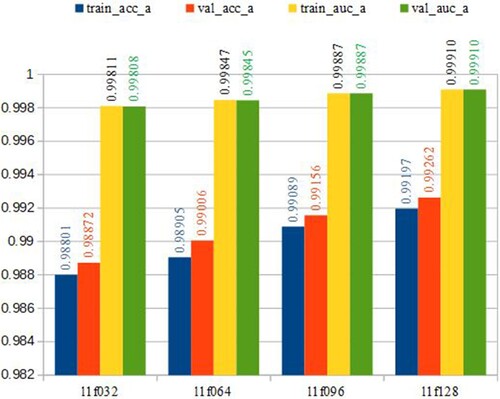
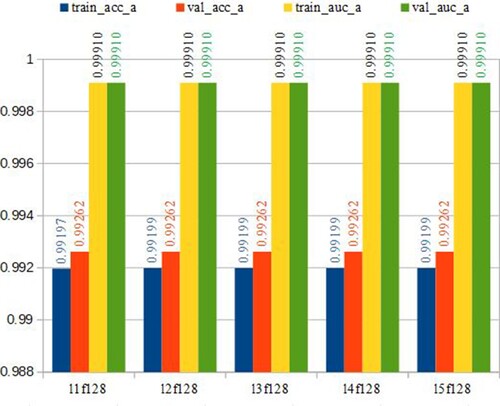
Figure 11. ACC and AUC results with different numbers of convolution layers.
The results are shown on the training dataset (train_acc_a with the ACC measure and train_auc_a with the AUC measure) and the test dataset (val_acc_a with the ACC measure and val_auc_a with AUC measure)). In addition, ‘gbc0050’, ‘gbc0500’, ‘gbc1000’ means using the Gradient boosting tree algorithm with the number of trees 50, 500, 1000. Similarly, ‘rf0050’, ‘rf0500’, ‘rf1000’ using a Random Forest with 50, 500, and 1000 trees, respectively.
As observed in Figure , the classification results increase for GBC as we gradually increase the number of trees, while the RF results do not vary much. A comparison of the results found that GBC had better results than RF with 1000 trees and 500 trees, with the best results obtained with GBC using 1000 trees at 0.9993366375 with ACC measure and 0.999992724 with AUC measure on the test set.
We also experiment with various numbers of filters on the CNN1D algorithm. We keep the number of CNN1D layers at one and gradually increase the Filters from 32 to 128. Figure shows that the accuracy increases when we expand CNN1D to the width of the number of Filters. The accuracy achieved was 0.9926175714 with the ACC measure and 0.9991010636 with the AUC measure. The performance difference between the training and test sets is minor. The accuracy in the training set reached 0.98801, 0.98905, 0.99089, 0.99199, while the test set obtained 0.98872, 0.99006, 0.99155, 0.99262 for architectures of l1f032, l1f064, l1f096, l1f128, respectively. The differences are minor, only 0.00071, 0.00101, 0.00066, and 0.00063, almost under 0.1%. We used large zoom values, which are adaptive according to maximum and minimum values, to plot the results in the chart. For the y-axis in Figure , with the minimum value of the y-axis set as 0.985 and the maximum value set as 1.000; hence, the very minor differences can be easily observed.
Similarly, we experiment with increasing convolutional layers from 1 to 5, as shown in Figure . Again, the number of convolutional layers does not create a difference in the performance. Thus, we can experiment with 128 filters and one convolutional layer in the following sections to save experimental time.
5.3. Performance with different types of abnormal packets
In this section, we conduct experiments and evaluate the effectiveness of Machine Learning models on datasets with different classifications. One set consists of 2 classes: the data streams will be classified into ‘normal’ or ‘risk’, and the other set of more detailed classifications, including normal (Normal), low-risk (Low) ), medium risk (Medium), and high risk (High).
Figure presents the results of the selected learning models after comparing the experimental results with different hyper-parameters. In Section 4.3, we have used LDA as a fascinating data representation tool to represent the distribution of the collected records as 2-D histograms. In this section, taking LDA as a Baseline to compare with other Machine Learning models, we see that although LDA achieves high classification efficiency, it is still inferior to Random Forests, Gradient Boosting Trees, and Neural Networks. As seen from Table , there is a correlation between the 2-class classification and 4-class classification tasks in accuracy where the accuracy for 4-class classification reduced by 0.3 for tree-based machine learning algorithms while the reduction is around 0.6 for the others.
Figure 12. The results in the accuracy of training and testing phases for the 2-class and 4-class classification problems.
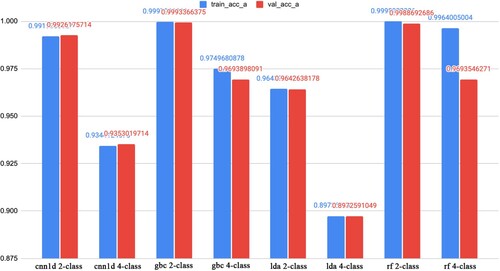
Table 6. Performance comparison in accuracy on the test set between 2-class and 4-class classification tasks with various learning algorithms.
Overall, when we add more layers, the accuracy decreases. For example, the convolutional neural network decreased from 0.9926175714 to 0.9353019714, while the Random Forest decreased from 0.9988692686 to 0.9693546271 with the ACC measure. The Gradient Boosting Tree also has the same reduction as the Random Forest. As observed, the performance on the training and testing datasets is similar.
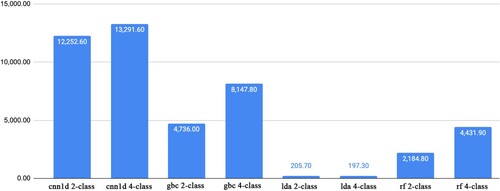
Figure shows the time required to experiment with classification problems. LDA results are speedy and have relatively low accuracy, while CNN1Ds take so much time to complete the training. The random forest gives results significantly faster than CNN1D and achieves better accuracy. GBC gives better results and also consumes more time than Random Forest. With the multi-class problem, we also spend much time on the 2-class problem. Especially with Random Forest, we spend almost twice as much time on the experimental process as between the 2-class and the multi-class classification problems on HNET20.
Figure 13. Training time (in seconds in the y-axis) of the classification task.
We have presented machine learning algorithms to predict the collected data set. Experimental results are very positive. Especially by recognizing only high-risk streams, we achieve very high efficiency with classical Machine Learning algorithms. With algorithms like Deep Learning and LDA, we need to preprocess the data to get better results, but this result is still lower than Random Forest and Gradient Boosting tree. Experimental results also show that the results can improve when we gradually increase the number of trees in the Gradient Boosting algorithm. At the same time, this will also improve performance slightly when we use Random Forest.
Furthermore, we can extend the number of filters to improve the result for the convolutional network. An increment in ‘width’ can be more effective than ‘depth’ for convolutional networks in this problem. However, there is a slight decrease in accuracy with more classifiers, and some algorithms can be improved to achieve greater efficiency. The experiment also shows that training multi-class models may take longer than the models running the 2-class classification.
From the experiments on various algorithms, Gradient Boosting Tree performed promising results compared to other algorithms. Therefore, we recommend using Gradient Boosting Tree to deploy in IDS-AC to detect abnormal packets.
5.4. Performance evaluation and comparison
We collaborated with 02 experts in the field of cybersecurity to investigate and penetrate the Honeynet network before and after deploying our method, IDS-AC. The first objective is to test whether the Honeypots are hijacked. The second goal is to increase many new attack types to evaluate the effectiveness of providing warnings between Snort and IDS-AC. Experts leveraged some techniques and procedures in exploiting systems, including collecting on systems' configurations, detecting active services and ports on the systems, detecting security weaknesses that exist on the systems, exploiting vulnerabilities, testing system penetration, and exploiting samples of resources available on the systems. Table is the general attack patterns after ten days collected from Honeynet when combined with hiring experts to attack the network and collect data. Furthermore, Table compares alerts by IDS-AC and Snort.
Table 7. General attack type obtained after ten days.
Table 8. Comparison of providing warnings between IDS-AC and Snort.
Snort has an outstanding advantage in detecting common attacks (medium and low level). Snort was commonly leveraged to deploy in current intrusion detection systems such as monitoring wireless networks by Farey et al. (Citation2023), edge routers by Patel et al. (Citation2023), Windows 10 by Putri et al. (Citation2023), intrusion detection and prevention by Sharma et al. (Citation2022). Therefore, we use Snort to compare results shown in Table . The proposed method can detect high-level attacks but misses many mid-level and low-level attacks. It shows that systems requiring high security still have to use IDS-AC. Starting with low and medium alerts, Snort gives better results. Thus, Snort can support attack warnings for public services and small and medium enterprises. Snort provides a higher number of alerts than IDS-AC. However, IDS-AC gives better accuracy in detecting abnormal packets. Therefore, IDS-AC can produce more meaningful warnings to users.
Records of the HNET20 dataset are classified as ‘High’, ‘Medium’, and ‘Low’ by Snort rules according to the level of the negative influence of the network data stream. Gradient Boosting Classifier can reach 99.9% accuracy for abnormal packet detection. In addition, the total of warnings of IDS-AC is lower than Snort. Hence, IDS-AC can provide fewer false warnings to users than Snort. After a long deployment, exploiting attacks' density is higher. The honeynet is very effective at collecting network attack data. The results of the IDS-AC warning less than Snort also show the effectiveness of the proposed model. The prediction results are fewer, with false positives in abnormal packet detection.
6. Conclusion
We have developed a system, namely IDS-AC, deployed with an interface on the web platform, highly effective in detecting and warning of online network attacks. In addition, the IDS can allow users with technical qualifications to self-update and improve performance to detect new types of attacks after a good enough time of data collection. We also attempted a scaling that can greatly improve the performance of CNN1D. Furthermore, based on the experiments, we selected appropriate hyper-parameters for each considered classifier. The experiments show that Gradient Boosting Classifier can perform well in both 2-class and 4-class classification.
According to the classification of Snort rules, there are about 34 general attack types. However, within the 8-month study period, only 11 general attack patterns grouped into four labels were collected. Therefore, the following studies can continue to collect data on Honeynet with missing attack patterns to fully collect the general attack pattern and deploy a secure IDS-AC as a realistic cyber defense.
Disclosure statement
All authors declare that they have no conflicts of interest.
Availability of data, code, and material
Data and experimental scripts and data of this study are published at the Github repository link https://github.com/dzokha/ids-ac.
Additional information
Funding
Notes on contributors
Kha Van Nguyen
Kha Van Nguyen completed his Master's degree in Computer Science from Can Tho University. He serves as an administrative civil servant at the Can Tho Department of Science & Technology. He is responsible for the administrative management of provincial-level scientific projects in the field of information technology (2010-2019), supporting the application of information technology in enterprises (2019-2021), and supporting the development of intellectual property for individuals and businesses (2021 to present). His research interests include data security in cyberspace and intellectual property protection.
Hai Thanh Nguyen
Hai Thanh Nguyen is a lecturer of the College of Information and Communication Technology, Can Tho University, Vietnam. He received his master's degree in Computer Science and Engineering from National Chiao Tung University, Taiwan, in 2014, and his Ph.D. degree in Computer Science from Sorbonne University, France, in 2018. His current research includes bioinformatics, healthcare system, recommendation systems, and machine learning-based applications.
Thang Quyet Le
Thang Quyet Le received his Master' and Doctor's Degrees in Mathematics from Orsay University, Paris, France. He worked for a long time at Cantho University as a lecturer and researcher on Statistics and Computer of Science. His research interests include Machine Learning and Cyphergraphy. Currently, he is retired, and he works as a collaborator with Cantho University.
Quang Nhat Minh Truong
Quang Nhat Minh Truong is a senior lecturer at the College of Information Technology, Cantho University of Technology. He completed the Master's program in Information Technology at the Institute of Francophone International (IFI) in 1997 and the Ph.D. in Mathematical Assurance for Computers and Computational Systems at the University of Science and Technology, Vietnam National University, Ho Chi Minh City in 2009. His research field includes Soft Computing, Machine Learning, Artificial Intelligence.
Notes
1 https://www.arcyber.army.mil, accessed on 01 September 2021.
References
- Abd, N., Alheeti, K. M. A., & Al-Rawi, S. S. (2020, December). Intelligent intrusion detection system in internal communication systems for driverless cars. Webology, 17(2), 376–393. https://doi.org/10.14704/WEB/V17I2/WEB17039
- Albaqami, H., Hassan, G. M., Subasi, A., & Datta, A. (2021, September). Automatic detection of abnormal EEG signals using wavelet feature extraction and gradient boosting decision tree. Biomedical Signal Processing and Control, 70, Article 102957. https://doi.org/10.1016/j.bspc.2021.102957
- Aung, K. M., & Htaik, N. M. (2020). Anomaly detection in SDN's control plane using combining entropy with SVM. In 2020 17th international conference on electrical engineering/electronics, computer, telecommunications and information technology (ECTI-CON) (pp. 122–126). Phuket: IEEE. https://doi.org/10.1109/ECTI-CON49241.2020.9158222
- Dong, Y. (2021, June). Design of an automatic detection system for abnormal communication data packets of electronic equipment. Wireless Personal Communications, 127(2), 1503–1516. https://doi.org/10.1007/s11277-021-08701-y
- Farey, G. L. U., Adha, M., Kurniawan, S. Y., Salsabilla, C. A., Rahman, A., & Reza, M. (2023). Wireless network monitoring using snort. JComce - Journal of Computer Science, 2(2). https://jurnal.teknologiriau.net/index.php/jcomce/article/view/11.
- Feng, C., Li, T., & Chana, D. (2017). Multi-level anomaly detection in industrial control systems via package signatures and LSTM networks. In 2017 47th annual IEEE/IFIP international conference on dependable systems and networks (DSN) (pp. 261–272). Denver, CO: IEEE. https://doi.org/10.1109/DSN.2017.34
- Franco, J., Aris, A., Canberk, B., & Uluagac, A. S. (2021). A survey of honeypots and honeynets for internet of things, industrial internet of things, and cyber-physical systems. IEEE Communications Surveys & Tutorials, 23(4), 2351–2383. https://doi.org/10.1109/COMST.2021.3106669
- Jo, W., Kim, S., Lee, C., & Shon, T. (2020, July). Packet preprocessing in CNN-based network intrusion detection system. Electronics, 9(7), Article 1151. https://doi.org/10.3390/electronics9071151
- Kaur, G. (2016). A preventive approach to mitigate the effects of gray hole attack using genetic algorithm. In 2016 international conference on advances in computing, communication, and automation (ICACCA) (spring) (pp. 1–8). Dehradun: IEEE. https://doi.org/10.1109/ICACCA.2016.7578899
- Krishnaveni, S., & Prabakaran, S. (2019, May). Ensemble approach for network threat detection and classification on cloud computing. Concurrency and Computation: Practice and Experience, 33(3). https://doi.org/10.1002/cpe.5272
- Kwon, S., Yoo, H., & Shon, T. (2019). RNN-based anomaly detection in dnp3 transport layer. In 2019 IEEE international conference on communications, control, and computing technologies for smart grids (SmartGridComm) (pp. 1–7). IEEE. https://doi.org/10.1109/SmartGridComm.2019.8909701
- Larriva-Novo, X. A., Vega-Barbas, M., Villagrá, V. A., & Sanz Rodrigo, M. (2020). Evaluation of cybersecurity data set characteristics for their applicability to neural networks algorithms detecting cybersecurity anomalies. IEEE Access, 8, 9005–9014. https://doi.org/10.1109/ACCESS.2019.2963407
- Li, X., Chen, W., Zhang, Q., & Wu, L. (2020, August). Building auto-encoder intrusion detection system based on random forest feature selection. Computers & Security, 95, Article 101851. https://doi.org/10.1016/j.cose.2020.101851
- Liu, H., Lang, B., Liu, M., & Yan, H. (2019, January). CNN and RNN based payload classification methods for attack detection. Knowledge-Based Systems, 163, 332–341. https://doi.org/10.1016/j.knosys.2018.08.036
- Longari, S., Nova Valcarcel, D. H., Zago, M., Carminati, M., & Zanero, S. (2021). Cannolo: An anomaly detection system based on LSTM autoencoders for controller area network. IEEE Transactions on Network and Service Management, 18(2), 1913–1924. https://doi.org/10.1109/TNSM.2020.3038991
- Maesschalck, S., Giotsas, V., Green, B., & Race, N. (2022, March). Don't get stung, cover your ICS in honey: How do honeypots fit within industrial control system security. Computers and Security, 114, Article 102598. https://doi.org/10.1016/j.cose.2021.102598
- Mishra, S. (2021). Detection and mitigation of attacks in SDN-based IoT network using SVM. International Journal of Computer Applications in Technology, 65(3), Article 270. https://doi.org/10.1504/IJCAT.2021.116009
- Nguyen, T. H., Prifti, E., Sokolovska, N., & Zucker, J. (2019, 3). Disease prediction using synthetic image representations of metagenomic data and convolutional neural networks. In Proceedings of the 13th IEEE-RIVF international conference on computing and communication technologies (pp. 231–236). IEEE.
- Nguyen, T. H., & Zucker, J.-D. (2019). Enhancing metagenome-based disease prediction by unsupervised binning approaches. In The 2019 11th international conference on knowledge and systems engineering (KSE-IEEE) (pp. 381–385). IEEE. ISSN 978-1-7281-3003-3. https://doi.org/10.1109/KSE.2019.8919295
- Nguyen, V. K., Nhat Quang Truong, M., Le, V. L., Thang Le, Q., & Nguyen, T. H. (2019). A novel approach for data collection and network attack warning. In 2019 11th international conference on knowledge and systems engineering (KSE) (pp. 1–6). IEEE. https://doi.org/10.1109/KSE.2019.8919494
- Niandong, L., Yanqi, S., Sheng, S., Xianshen, H., & Haoliang, M. (2020, July). Detection of probe flow anomalies using information entropy and random forest method. Journal of Intelligent and Fuzzy Systems, 39(1), 433–447. https://doi.org/10.3233/JIFS-191448
- Ozsahin, D. U., Taiwo Mustapha, M., Mubarak, A. S., Said Ameen, Z., & Uzun, B. (2022). Impact of feature scaling on machine learning models for the diagnosis of diabetes. In 2022 international conference on artificial intelligence in everything (pp. 87–94). IEEE. https://doi.org/10.1109/AIE57029.2022.00024
- Park, S. H., Park, H. J., & Choi, Y.-J. (2020). RNN-based prediction for network intrusion detection. In 2020 international conference on artificial intelligence in information and communication (ICAIIC) (pp. 572–574). IEEE. https://doi.org/10.1109/ICAIIC48513.2020.9065249
- Patel, N., Mehtre, B., & Wankar, R. (2023). A snort-based secure edge router for smart home. International Journal of Sensor Networks, 41(1), Article 42. https://doi.org/10.1504/IJSNET.2023.128505
- Perkins, R. C., & Howell, C. J. (2021). Honeypots for cybercrime research. In A. Lavorgna, & T. J. Holt (Eds.), Researching cybercrimes (pp. 233–261). East Lansing, MI: Springer International Publishing. https://doi.org/10.1007/978-3-030-74837-1_12
- Provos, N., & Holz, T. (2007, July). Virtual honeypots. Addison-Wesley Educational.
- Putri, A. A., Agustina, C., Fauzan, H., Saputra, M. R. E., Erdiansyah, M., & Wardani, P. S. (2023, January). Network security implementation with snort-based intrusion detection system using windows 10. JComce - Journal of Computer Science, 1(1). https://jurnal.teknologiriau.net/index.php/jcomce/article/view/49.
- Ren, J., Zhang, C., & Hao, Q. (2021). A theoretical method to evaluate honeynet potency. Future Generation Computer Systems, 116, 76–85. https://doi.org/10.1016/j.future.2020.08.021
- Salim, M. M., Singh, S. K., & Park, J. H. (2021, December). Securing smart cities using LSTM algorithm and lightweight containers against botnet attacks. Applied Soft Computing, 113, Article 107859. https://doi.org/10.1016/j.asoc.2021.107859
- Sharma, S., Nand, P., & Sharma, P. (2022). Intrusion detection and prevention systems using snort. In S. Borah, S. K. Mishra, B. K. Mishra, V. E. Balas, & Z. Polkowski (Eds.), Advances in data science and management (pp. 473–486). Springer Nature Singapore. https://doi.org/10.1007/978-981-16-5685-9_46
- Sheikh, A. (2021). Evading intrusion detection systems, firewalls, and honeypots. In Certified ethical hacker (CEH) preparation guide (pp. 153–164). Apress. https://doi.org/10.1007/978-1-4842-7258-9_13
- Sheng, C., Yao, Y., Fu, Q., Yang, W., & Liu, Y. (2021, September). Study on the intelligent honeynet model for containing the spread of industrial viruses. Computers and Security, 111, Article 102460. https://doi.org/10.1016/j.cose.2021.102460
- Song, Y., Bu, B., & Yang, X. (2020). Hybrid intrusion detection with decision tree and critical state analysis for CBTC. In B. Liu, L. Jia, Y. Qin, Z. Liu, L. Diao, & M. An (Eds.), Lecture notes in electrical engineering (pp. 153–161). Springer Singapore.
- Spiekermann, D., & Keller, J. (2021, June). Unsupervised packet-based anomaly detection in virtual networks. Computer Networks, 192, Article 108017. https://doi.org/10.1016/j.comnet.2021.108017
- Staudemeyer, R. C., & Omlin, C. W. (2014, June). Extracting salient features for network intrusion detection using machine learning methods. South African Computer Journal, 52, 82–96. https://doi.org/10.18489/sacj.v52i0.200
- Sturm, R., Pollard, C., & Craig, J. (2017). Managing containerized applications. In Application performance management (APM) in the digital enterprise (pp. 177–185). Elsevier. https://doi.org/10.1016/b978-0-12-804018-8.00013-9
- Su, M.-Y. (2011). Real-time anomaly detection systems for denial-of-service attacks by weighted k-nearest-neighbor classifiers. Expert Systems with Applications, 38(4), 3492–3498. https://doi.org/10.1016/j.eswa.2010.08.137
- Subba, B., Biswas, S., & Karmakar, S. (2016). A neural network based system for intrusion detection and attack classification. In 2016 twenty second national conference on communication (NCC) (pp. 1–6). IEEE. https://doi.org/10.1109/NCC.2016.7561088
- Sun, Y. (2016, April). The study on network information security. In 2016 international conference on network and information systems for computers (ICNISC). IEEE. https://doi.org/10.1109/icnisc.2016.028
- Tavallaee, M., Bagheri, E., Lu, W., & Ghorbani, A. A. (2009). A detailed analysis of the KDD cup 99 data set. In 2009 IEEE symposium on computational intelligence for security and defense applications (pp. 1–6). IEEE. https://doi.org/10.1109/CISDA.2009.5356528
- Tharwat, A., Gaber, T., Ibrahim, A., & Hassanien, A. E. (2017, May). Linear discriminant analysis: A detailed tutorial. AI Communications, 30(2), 169–190. https://doi.org/10.3233/AIC-170729
- Vetterl, A., Clayton, R., & Walden, I. (2019). Counting outdated honeypots: Legal and useful. In 2019 IEEE security and privacy workshops (SPW) (pp. 224–229). IEEE. https://doi.org/10.1109/SPW.2019.00049
- Vinayakumar, R., Alazab, M., Soman, K. P., Poornachandran, P., Al-Nemrat, A., & Venkatraman, S. (2019). Deep learning approach for intelligent intrusion detection system. IEEE Access, 7, 41525–41550. https://doi.org/10.1109/Access.6287639
- Wakui, T., Kondo, T., & Teraoka, F. (2021, August). GAMPAL: An anomaly detection mechanism for internet backbone traffic by flow size prediction with LSTM-RNN. Annals of Telecommunications, 77, 437–454. https://doi.org/10.1007/s12243-021-00874-8
- Wang, H., He, H., Zhang, W., Liu, W., Liu, P., & Javadpour, A. (2022, September). Using honeypots to model botnet attacks on the internet of medical things. Computers and Electrical Engineering, 102, Article 108212. https://doi.org/10.1016/j.compeleceng.2022.108212
- Yusof, M. H. M., Almohammedi, A. A., Shepelev, V., & Ahmed, O. (2022). Visualizing realistic benchmarked ids dataset: Cira-cic-dohbrw-2020. IEEE Access, 10, 94624–94642. https://doi.org/10.1109/ACCESS.2022.3204690
- Zhong, Y., Chen, W., Wang, Z., Chen, Y., Wang, K., Li, Y., Yin, X., Shi, X., Yang, J., & Li, K. (2020, March). HELAD: A novel network anomaly detection model based on heterogeneous ensemble learning. Computer Networks, 169, Article 107049. https://doi.org/10.1016/j.comnet.2019.107049