
 ?Mathematical formulae have been encoded as MathML and are displayed in this HTML version using MathJax in order to improve their display. Uncheck the box to turn MathJax off. This feature requires Javascript. Click on a formula to zoom.
ABSTRACT
Reconfigurable intelligent surfaces (RISs) are anticipated to constitute a critical component of forthcoming communication networks due to their ability to establish controllable wireless environments. Furthermore, RIS can be leveraged to solve infeasible localization problems. This paper presents a novel adoption of the geometric dilution of precision (GDoP) analysis in the design of non-line of sight (NLoS) single anchor millimetre wave (mmWave) large RIS-aided localization in the near-field. Considering downlink transmission, the time difference of arrival (TDoA) is used to estimate the positioning by extracting the signal contribution of each RIS tile. Considering the enriched time of arrival (ToA) measurements provided by RIS, the RIS tiles involved in TDoA-based estimation should be selected properly. Therefore, the GDoP adopted in this context is to select RIS tile combinations that achieve minimum GDoP values. It has been shown via numerical simulation that the proposed design of the RIS-aided localization outperforms other state-of-the-art techniques that adopt the signal-to-noise ratio (SNR) for the selection of the RIS tiles. It is demonstrated that the proposed scheme can provide sufficient localization accuracy involving only 10% of RIS tiles, whereas the SNR method requires about (70–80) % of the tiles to approximately achieve the same accuracy.
1. Introduction
Reconfigurable intelligent surface (RIS) is one of the newest emerging hardware technologies in communication systems that can significantly enhance communication performance and reduce energy consumption (Abdullah et al., Citation2022; Huang et al., Citation2019). Although RIS is a general term that has been recently used in the communication field, it has technology roots in the electromagnetic (EM) field (He et al., Citation2019; Tsilipakos et al., Citation2020). RIS is a metasurface with built-in electronic circuitry that can be programmed to modify the impinging EM field in a controllable method. Each RIS consists of many reflection elements arranged as an array of elements (Huang et al., Citation2018). These elements can be controlled by employing varactor diodes or another electrical method via a microcontroller to change the reflection coefficient for each element as illustrated in (Han et al., Citation2019). RIS technology has more than one name, such as intelligent reflecting surfaces (IRS) and software-controlled metasurfaces (Björnson et al., Citation2019). It ought to be considered as a broad idea for developing smart radio environments (Liaskos et al., Citation2018; Najafi et al., Citation2021; Wu & Zhang, Citation2020).
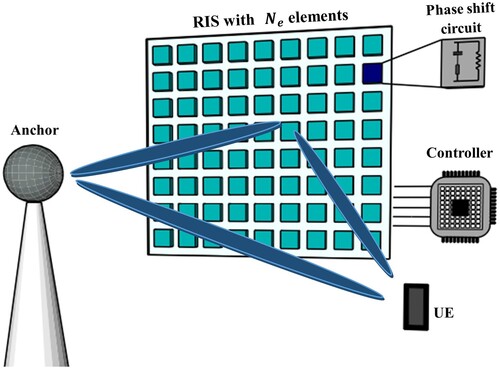
Figure 1. RIS-assisted network model.
1.1. RIS for communication and localization
The RIS represents an innovative technology that holds great promise for improving communication and localization in various applications, particularly in wireless communication systems.
Referring to , the incoming signals are reflected by the passive elements after changing their phases. The important characteristic of the RIS is that each element performs this change passively based on its local impedance, this local impedance may be changed over time by an external controller. The RIS receives the impinging signals from any direction from the half-space that the RIS elements are facing and adjusts the reflection coefficients to reflect the signals in the desired method (Ozdogan et al., Citation2020).
Thanks to the RIS technology, not only the communication links can be boosted but also localization-based applications can be significantly improved (Tataria et al., Citation2021). In this sense, RISs can help to create a virtual line of sight (LoS) link between the transmitter and the receiver even in the presence of obstacles (Sarieddeen et al., Citation2020). Recently, wireless positioning and localization (He et al., Citation2020; Wymeersch et al., Citation2019) have received significant attention in the context of RIS-aided communication systems. This can be an important factor in improving the accuracy of the position and orientation estimations for a variety of 6G applications (Hu et al., Citation2018; Mohammad Razavizadeh & Svensson, Citation2020), and it adds the advantage of making localization possible in situations where it otherwise is impossible (Keykhosravi et al., Citation2021; Ozturk et al., Citation2022).
1.2. Related works and contributions
In the past few years, the research efforts in the scope of RIS-based localization systems have been dedicated to many aspects such as establishing the theoretical bounds of the localization and RIS profile design of phase reflection coefficients. Furthermore, near-field and far-field propagation conditions have been discussed in the literature.
Keykhosravi et al. (Citation2021) presented a single-input single-output (SISO) system with a three-dimensional RIS-aided localization and synchronization procedure. In He et al. (Citation2020), the Cramér–Rao lower bound (CRLB) is used to calculate the positioning performance limit of a single transmitter localization system supported by RIS with the mmWave and multi-input-multi-output (MIMO) system. In He et al., (Citation2020), an adaptive hierarchical codebook for localization and data transmission was devised for the same systems. Zhang et al. (Citation2021) suggest a received signal strength (RSS)-based positioning technique in their discussion of positioning algorithms. However, in the above research, i.e. He et al. (Citation2020), He et al. (Citation2020) and Zhang et al. (Citation2021), the far-field propagation model is considered in which the wavefront is plane and that will not be the case for large RIS operating with high frequency. Hence, the authors in Elzanaty et al. (Citation2021) used a model that is applicable for near-field taking into consideration the localization performance restrictions in RIS-aided scenarios while exploiting the spherical wavefront to enrich the localization process and increase the localization accuracy. In addition, the aforementioned scenarios assume LoS conditions while the multipath effect is taken into account by Ma et al. (Citation2021) where the localization strategy in the multipath RIS-assisted localization paradigm is examined in the far-field propagation model. A simultaneous localization and mapping facilitated using passive RISs is studied in Yang et al. (Citation2023). Furthermore, as an extension to the aforementioned research on RISs, a study by Abu-Shaban et al. (Citation2021) exploited wavefront curvature for positioning purposes through the utilization of RIS-based working as a lens with an RF chain.
As in the above discussion, some literature research studied the augmentation of large RIS operating with high frequency for localization applications which will produce near-field regimes with the consideration of LoS/NLoS multipath scenarios. However, the research in this field is still in its infant stage and there is room for improvement that can be investigated for RIS-aided localization in the near field. With enriched radio measurements provided in the near-field regime, one of the research questions that needs to be addressed is how to select the appropriate radio measurements for the RIS (e.g. time of arrivals (ToAs) for each RIS element) in the formulation of the localization algorithm.
The geometric dilution of precision (GDoP) is a measure that indicates the proportional relation between the limitations in precision of a positional fix and the accuracy of the measurements being conducted. It is an important metric that quantifies how the geometric arrangement of anchors can affect the accuracy of position estimates in a localization system, or for assessing how the geometric relationship between anchors and user equipment (UE) affects their abilities to determine positions accurately (Deng et al., Citation2019). In this paper, the GDoP is adopted in the design of a large RIS-aided localization algorithm with a single anchor. Specifically, the use of a large RIS to overcome inadequate coverage in situations where the NLoS environment is considered and diverges the propagation into the near-field regime.
The main contribution of this paper can be summarized as follows, a localization paradigm is considered where a single anchor is used to localize a UE with the assistance of RIS, despite the blockage of the direct link between the anchor and the UE in the presence of multipath. The UE and the anchor are in a near-field region concerning the RIS, thanks to the large strip-like RIS in addition to the use of high frequency. The RIS, which is large in one direction, is subdivided into tiles where the ToA from each tile is used in the formulation of the TDoA localization algorithm. Typically, RIS tiles with a high measurement signal-to-noise ratio (SNR) can be selected to be involved in the location estimation algorithm (Dardari et al., Citation2022). To reduce the number of tiles involved in the TDoA procedure, and hence reduce the complexity, the RIS-assisted localization scheme is proposed based on the GDoP to select the appropriate tiles that achieve an improvement in positioning accuracy where this approach, to the best of our knowledge, has not been reported in the literature.
The remainder of this paper is organized as follows. In Section 2, the signal and system model are explained. Section 3 explains the RIS-aided localization using TDoA in the near-field, where the localization procedure is explained in Section 3.1 while theoretical bounds and Fisher information analysis are explained in Section 3.2. GDoP analysis for TDoA positioning is discussed in Section 4. Then, the proposed GDoP-based method is described in Section 5. The simulation model and its numerical results will be presented in Section 6. Finally, the conclusion, discussion and future ideas are outlined in Section 7.
Notations: Vectors are represented by boldface lowercase letters (e.g. ) and matrices by boldface uppercase letters (e.g.
), while scalars are represented by non-bold letters (e.g. x or
). The element in the
row and
column of matrix
is specified by
. Similarly,
indicates the
element of vector
. Invers, conjugate and transpose operators are represented by
,
and
, respectively. Besides,
is used for statistical expected value operator,
denotes the trace of the matrix,
is the operator that transforms the vector to a diagonal matrix and
is the covariance of the matrix,
calculates the norm of vectors, and
represents a complex Gaussian random variable with mean
and variance
.
2. Signal and system model
In this research, a system model for asynchronous downlink wireless system utilizing orthogonal frequency division multiplexing (OFDM) with SISO technology is considered. The system consists of an anchor, UE, as well as a RIS. The positions of the RIS and the anchor are known that are denoted by and
, respectively, whereas the position of the UE that is to be estimated is represented by
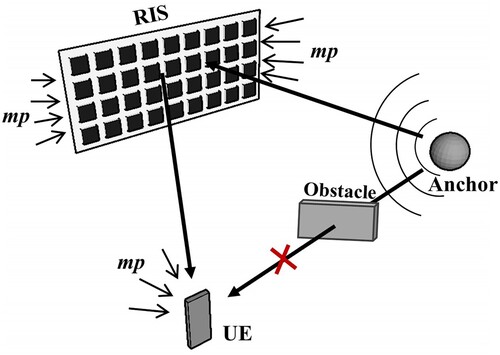
. The anchor transmits downlink signal, this signal reaches the UE through the RIS assuming that the direct path between the anchor and the UE is blocked by an obstacle. In addition, the signal model considers the multipath effect of anchor-RIS and RIS-UE channels, i.e. the signal reaches the RIS from the anchor and from the uncontrollable multipath, also reaches the UE from the RIS and from uncontrollable multipath too, as seen in .
Figure 2. Signal model for RIS-aided localization.
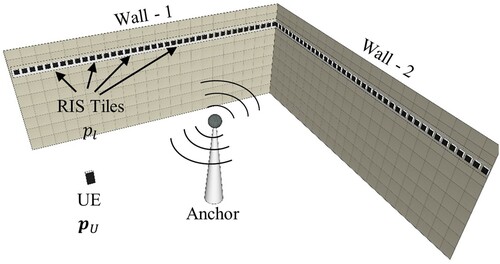
Following the considered framework in Najafi et al. (Citation2021) and Dardari et al. (Citation2022), the sub-wavelength elements of the RIS are subdivided to subsets or groups named tiles, these tiles arranged linearly to be as stripe-like RIS. Introducing this arrangement would result that the RIS becoming less expensive and more straightforward to mount on structures or walls. In addition, this arrangement helps to provide a spherical wavefront propagation of the near-field regime for the RIS overall, but each tile (not entire RIS) will be in the far-field regime. Hence, an adequately large RIS with respect to the wavelength and/or operates at high frequency is required. The RIS is assumed to be installed into two equal lengths perpendicular walls, so the working zone is all the area surrounded by the two walls. The anchor located at the centre of the area and UE can be at any point in the considered region of interest, see .
Figure 3. Considered system scenario.
Each tile has elements arranged as the uniform planer array (UPA) with
elements with spacing
respectively. Then, there are
tiles in the RIS where the position of each tile is denoted as
,
. Each element within the RIS possesses the capability of being configured individually to modulate the phase of the incident signal and reflect it back. It should be noted that the same reflection coefficient is used for all the constituent elements of each tile. The elements present within one tile have the potential to be regarded as an array antenna and exhibit an array factor, each tile is traded as one RIS element and typically has a single dominant propagation channel.
For the signal model, for one positioning occasion, an OFDM signal has subcarriers
and with
pilot symbols being transmitted by the anchor at certain time
The central frequency of the carrier is
and subcarriers are spaced by
. Upon the consideration of being each tile (not the entire RIS) working in the far-field condition, the reconfigurable reflection coefficient of the
tile has an amplitude of
and
phase and it is changed according to the designed profile. Hence, the reflection coefficient at time
of tile
can be expressed as
(1)
(1) It should be noted that the phase
might take any value between
and
, and it is updated at each symbol transmission.
The signal observed by the UE at symbol time and subcarrier
can be represented as
(2)
(2)
(3)
(3)
(4)
(4)
(5)
(5) where
Is the direct channel coefficient between the UE and the anchor.
is the known pilot symbol to be transmitted.
is the forward channel coefficient from the anchor to the RIS.
is the backward channel coefficient from the RIS to the UE.
is an additive Gaussian Noise.
Noting that the channel from the anchor to the UE through the RIS is a cascaded channel consisting of forward and backward coefficients, then the cascaded channel for subcarrier
is given by
(6)
(6) Furthermore, each channel of
,
and
consists of direct-path and L-tap multi-path coefficients. The additive noise
is represented as
which is a complex Gaussian random variable with mean of
and variance of
. The observation signal received by UE is an OFDM signal with
pilot transmissions and
subcarriers. Subsequently, the collection of observed signals is exploited to estimate the position of the UE as described in the next section.
3. RIS aided near-field localization using TDoA
In this section the estimation procedure in addition to the theoretical bounds and Fisher information analysis are presented.
3.1. Localization procedure
This section outlines the RIS-assisted localization procedure outlined in Dardari et al. (Citation2022), which presents a two-step localization algorithm. The initial stage comprises processing the observed signal in (2) and extracts both the direct signal, which is from the anchor to UE (if exist) and reflected signal through the RIS. If the direct path is not blocked, then both extracted components (direct and reflected) will be used to estimate the ToA. Otherwise, the ToA will be estimated only for the reflected paths. In addition, it is important to design the reflection coefficients profile, i.e. the RIS phase profile, in an appropriate manner to ensure this extraction. So, it should be satisfying the orthogonality property as illustrated in Equations (7) and (8),
(7)
(7) and
(8)
(8) As a result, with the assumption of
, the extracted direct signal component of the observed signal is given as (Dardari et al., Citation2022)
(9)
(9) Noting that in (9), the summation over
in third part will approximately approach zero, thanks to the property given in (7), thereby eliminating the RIS components and the observed signal will only accommodate the direct component, i.e.
(10)
(10) Consequently, to extract the reflected signal components via the RIS, the separated direct path in (10) is subtracted from the observed UE signal given in (2) as shown,
(11)
(11) The TDoA scheme is used to find the estimated position of the UE. To develop a closed-form TDoA positioning scheme for the RIS aided localization system, at least three TDoA measurements in the two-dimensional (2D) space are required. Therefore, it is needed to obtain the contribution from each tile of the RIS separately to formulate TDoA localization scheme by leveraging the property of the phase profile in (8). Accordingly, the RIS reflected components of the observed signal
given in (11) are correlated with the complex conjugate of the known
belong to each tile. Consequently, the separated reflected signal contribution for each tile is given as
(12)
(12) where
in (10) and
in (12) are
. Thus, the ToA for the direct path, if exists, and the ToA for reflected paths from each tile (
) can be estimated by oversampling the extracted OFDM frequency domain symbols with a factor of
. Then, taking the inverse discrete Fourier transform (IDFT) and evaluating the peak value of the profile as follows:
(13)
(13) where
is the oversampled frequency domain symbols of the extracted direct or reflected paths. The peak value in this case is the channel's first arriving path which denotes the ToA. The Quasi-Newton approach described in Keykhosravi et al. (Citation2021) is then used to further refine the expected time of arrivals
to a sufficient level of precision.
Afterwards, the least square (LS) method is used to solve the TDoA problem and find the estimated UE location (Alhafid & Younis, Citation2020). Ideally, if the direct path does not exist, then there are of TDoA (if all tiles used) are obtained from the
measurements of ToAs. Each one will multiply by the speed of light to convert to distances. Assuming that the reference ToA is the direct path if exists, and is the first tile in case of blockage with M tiles (Wu et al., Citation2019), then the closed-form solution for TDoA localization problem is given as
(14)
(14) where
(15)
(15)
(16)
(16)
is the
tiles/anchors position and
is the estimated distance of difference between the UE and two tiles/anchors.
3.2. Estimation bounds
Within this section, the performance limitation, i.e. CRLB, for the localization scenario, which is to find the positioning error bound (PEB) for UE estimated position using TDoA is proposed. The CRLB can be used to analyse the lower bound on the variance of any unbiased estimator of a parameter in a statistical model (Rahal et al., Citation2021; Wymeersch, Citation2020). To find the PEB, first it is needed to find the likelihood function for the unknown parameter which is the joint probability distribution function (PDF) with respect to the observation vector parameterized by the unknown parameter. The observation vector is the estimated TDoAs which can be denoted by
. So, the likelihood function
(17)
(17) where
is the measurement error variance of the TDOA estimates (Dardari et al., Citation2022). The PEB which is the lower bound of the variance of the estimator can be calculated as
(18)
(18) where
is the statistical expectation and the denominator is the Fisher information matrix (FIM) which can be written as
(19)
(19) then,
(20)
(20) The above equation will be used in the simulation model and in the numerical results section to benchmark the localization procedure presented in this paper.
4. GDoP for TDoA positioning
The GDoP is a crucial metric that measures the impact of the geometric configuration of anchors on the precision of position estimations in a localization system or it refers to the proportional relationship between the imprecision limitation of a positional fix and the precision accuracy of the measurements being made (Deng et al., Citation2019). The value of GDoP depends on the anchor positions (or tile here) and UE. To calculate the GDoP value about variously chosen anchor combinations, an intuitive approach involves comparing and analysing alterations to the positioning capability induced by the different positions of the selected anchors (Laveti et al., Citation2016). When the height of antennas on anchors is approximately equal, it results in a high vertical dilution of precision, making the system incapable of providing reliable vertical positioning estimation (Deng et al., Citation2020). Hence, only the horizontal positioning is considered in this paper.
Employ the notation to denote the result of the position estimation, while the notation
is used to signify the functional relationship between the estimated position and measurement errors of the TDoA. As mentioned previously, the position of UE is denoted by
, anchor positions
,
, where the anchors here refer to the tiles used in positioning and may include the main transmitting anchor if no blockage exists, then the actual distance between UE and the
anchor is expressed as follows:
(21)
(21) Consequently, the TDoA range result is written as
(22)
(22) where
is the estimated distance of difference between the UE and two anchors, or is defined as the ranging difference computed by TDoA measurement,
is the measured ToA from the
anchor to the UE,
is the real distance of difference between the UE and two anchors and
is the measurement error. Using (22), the TDoA measurement equations
can be written as follows:
(23)
(23) To obtain the GDoP for TDoA positioning, it is needed to linearize the measurement equations. Utilizing first-order Taylor series to approximate
when UE is located at
it is achieved (Deng et al., Citation2019) as follows:
(24)
(24) when there are no measurement errors, the position estimation result
corresponds to the real location of the UE, which is
. Then (23) will be:
(25)
(25) In contrast, when there are measurement errors which are expressed by
, Equation (23) will be:
(26)
(26) Thereupon, the error in position estimation in
direction is
, and in
direction is
, then the positioning error vector can be written as
. Now by subtracting (24) from (25),
(27)
(27) Using
instead of
in (23), then use it in the derivation of (27) resulting (Deng et al., Citation2019; Deng et al., Citation2020; Laveti et al., Citation2016):
(28)
(28)
(29)
(29)
(30)
(30)
by using the matrix form:
(31)
(31) where
(32)
(32) It is reasonable to assume that the measurement errors
,
will be independent and identically distributed (Deng et al., Citation2019). The ranging errors have the following statistical properties for every element of the error vector
,
(33)
(33) The variance of TDoA measurement error
is
(34)
(34) The solution of (30) can be obtained from the least square (LS) (Wu et al., Citation2019) as follows:
(35)
(35) The estimated position error covariance matrix
can be written as follows:
(36)
(36) Subsequently, agreeing with the definitions, GDoP is characterized as the ratio of the positioning error to position signal measurement error (Deng et al., Citation2019). The GDoP of the TDoA positioning is given by the trace of the inverse of the
matrix (Teng et al., Citation2018).
(37)
(37)
5. Proposed GDoP-based tile selection for RIS aided TDoA near-field localization
As mentioned in Section 4, the localization in the near-field with the assistance of RIS requires the knowledge of contribution from each tile to estimate the ToA and then the TDoA between the reference and other anchors. Here, the anchors in the context of the TDoA localization technique represent the tiles. The use of large RIS consequences enormous number of tiles and using all the titles in the TDoA formulation will increase the computational complexity of the system, additionally some ToAs measurements might not be reliable. In addition, using all the tiles might not reflect a significant effect on the estimation accuracy while adding more complexity to the localization algorithm. Therefore, this research focuses on tile selection for the TDoA scheme in the context of RIS-aided localization in the near field. One approach for tile selection is to select ToA measurements with SNR greater than 10 dB among a per cent of best selected ToA measurements to formulate TDoA estimation as discussed in Dardari et al. (Citation2022). However, as these selection methods employ SNR metric most of the selected tiles might be in proximity with no geometric diversity in their locations. In such a scenario high dilution of precision will be produced resulting in unreliable positioning performance. A high GDoP may be highly probable in the framework considered in this research because of the strip-like arrangement of the RIS. In addition, the most unfavourable case that could happen is when all the selected anchors are in close range on one side of the RIS.
To overcome these challenges, the GDoP-assisted tile selection has been investigated in this research to achieve accurate localization estimation while using a limited number of tiles that have reliable measurements with sufficient geometric diversity. The following explains our proposed localization scheme using the GDoP metric:
Divide the working area into sub-working areas, for example, the sub-areas are A, B, C and D, i.e. four quarters or more fine-grained areas can be used if necessary.
Cluster the
RIS tiles
Calculate GDoP for the whole working area using diverse group selection combinations and observe the combinations that give minimum GDoP values in each sub-working area.
The probability of the total number of the tiles groups can be calculated according to the combination method, as shown in the equation (Albaidhani & Alsudani, Citation2021),
In each sub-working area, for example, area ‘C’,
The mentioned selections, i.e.
Estimate an initial position for the UE (coarse estimation) using (14).
When the initial position is located in one of the sub-areas, appropriate tile combinations which produce minimum GDoP value in that sub-area will be used to re-estimate UE position using (14).
The following algorithm illustrates the steps of the proposed procedure:
Table
6. Simulation model and results
The RIS-aided localization system described in Section 2 and illustrated in has been simulated considering the parameters described in . Simulation analysis has been carried out to verify the effectiveness of adopting the GDoP metric in the design of TDoA positioning in the RIS-aided localization system under different RIS tiles combinations and the numerical results are discussed in this section. At first, the GDoP distribution of the TDoA positioning is calculated for different percentages of a total number of tiles (10% to 60% of total tiles) as shown in . These percentages are selected from the largest SNR for ToA measurements in each wall of the mentioned scenario. Then, the tiles in each wall are divided into two subsets or segments, and the GDoP distribution of the TDoA positioning is calculated for different percentages of total number of tiles like in the previous step as shown in . Also, the GDoP distribution of the TDoA positioning is calculated for different proposed tiles combinations depending on the combination method shown in Algorithm I, each combination consists of only 10% of the total number of the tiles in the RIS. Some of those combinations use 5% of the tiles on each wall as shown in , and some of selected combinations use 7% and 3% of the tiles in the 1st and 2nd walls, respectively, and vice versa as shown in .
Figure 4. GDoP for 10–60% of total tiles, (a) to (f) respectively, from the largest SNR for ToA measurements in each wall.
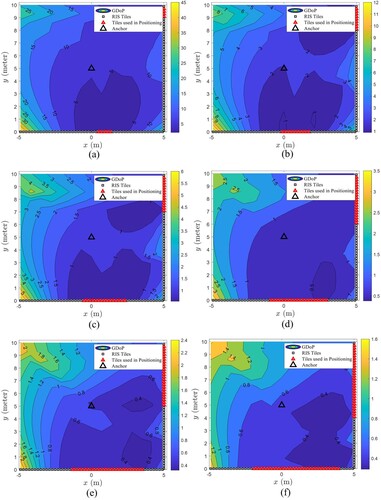
Figure 5. GDoP for 10–60% of total tiles, (a) to (f) respectively, from the largest SNR for ToA measurements in each subdivided wall.
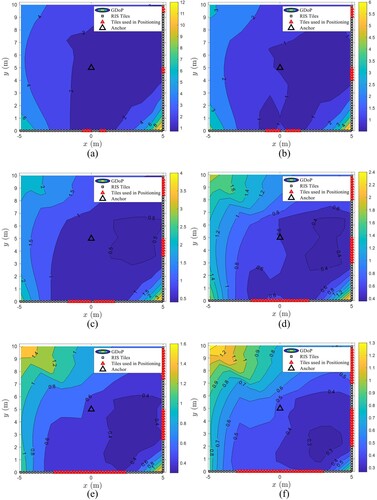
Figure 6. GDoP for some combinations use 5% of the tiles on each wall.
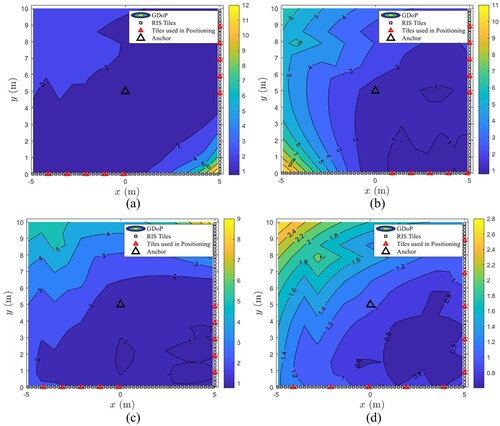
Figure 7. GDoP for some combinations use 7% and 3% of the tiles 1st and 2nd wall.
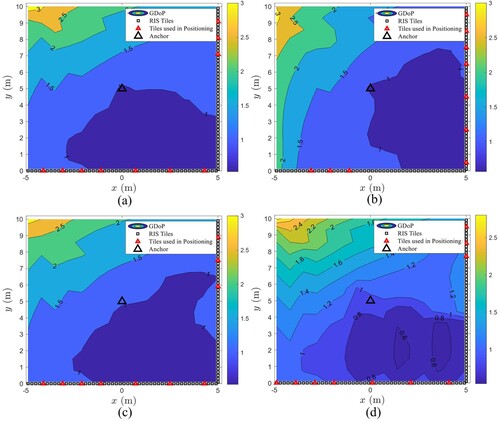
Table 1. Used notations and parameters.
In , it can be noticed that the GDoP distribution of the serving area was between 5 and 45 using only 10% of RIS tiles and decreased to between 0.4 and 1.5 when using 60% RIS tiles. Whereas, in the case of dividing the RIS on each wall into two segments, the GDoP distribution becomes between 1 and 12 for the case of using 10% of RIS tiles and decreased to be between 0.3 and 1.3 when 60% of RIS tiles are used as depicted in . In contrast, using the proposed method produced GDoP values between 0.8 and 12 in the case of using only 10% of RIS tiles (5% on each wall) and approximately between 0.6 and 3 in the case of using also only 10% of RIS tiles (3% and 7%) as shown in and respectively.
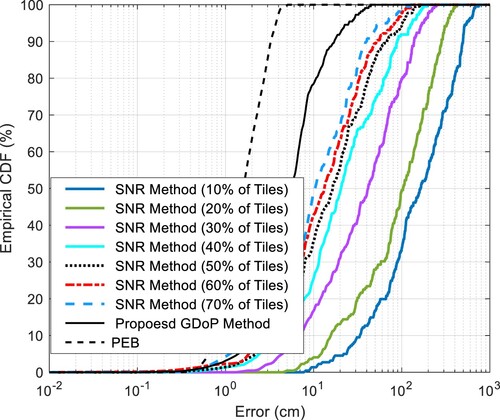
According to the above analyses, and to intuitively show the effect of the GDoP metric on the simulation cases, we counted the GDoP values in the serving area according to the proposed method with different tiles selection combinations and chose the best combination which satisfies minimum GDoP in the desired area. With the exploitation of the proposed steps in Section 5 (Algorithm I) simulation results of cumulative distribution function (CDF) curves for the estimation error in NLoS condition between the anchor and the UE are depicted in . The CDF curves demonstrated that the GDoP metric has a significant effect on positioning accuracy. It can be noted that, using the SNR method, the increase in the number of tiles used in the TDoA calculations to estimate the UE position will increase the positioning accuracy, but that will increase the complexity. However, using the proposed GDoP metric, it can be observed that the performance of the proposed tile selection method using only 10% of the tiles can outperform the performance of using 70% of the tiles in the case of using the SNR method. This result, in fact, will dramatically reduce the computational complexity and speed up the calculation process of the estimation and at the same time provide comparable performance for using a large number of tiles in terms of localization accuracy.
Figure 8. Empirical CDF of the estimation error for different percentages of selected tiles compared with the proposed GDoP method.
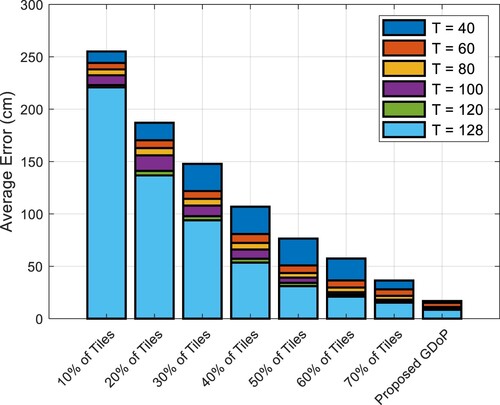
Correspondingly, the performance of the proposed method compared with the SNR method has been investigated in terms of average localization error as a function of a number of OFDM symbol transmissions. The average localization error is evaluated for different numbers of used tiles taken as percentages (from 10% to 7%) from a total number of tiles of best ToA measurements that are used to form TDoA as illustrated in . It can be noticed that using a small percentage of the tiles does not provide sufficient localization accuracy in the case of using the SNR method and the localization performance improves as the number of tiles increases. On the other hand, the performance of the proposed GDoP method produces improved performance and sufficient accuracy outperforming the performance of the SNR method using a smaller number of tiles. More results are depicted in as a bar chart for an average localization error versus different percentages of selected tiles compared with the proposed GDoP for different numbers of symbol transmission.
Figure 9. Average localization error vs number of symbols transmission for different percentages of selected tiles compared with the proposed GDoP method (a) The overall CDF curves; (b) enlarged view of CDF curves.
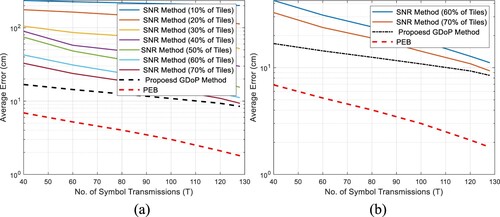
Figure 10. Bar chart for average localization error vs different percentages of selected tiles compared with the proposed GDoP for different number of symbol transmission (T).
Accordingly, to investigate the GDoP distribution in the serving area, the CDF of the GDoP is plotted in . It depicts a comparison between the GDoP distribution for the SNR method using 20% and 30% of the tiles with the proposed method that involves only 10% of the tiles in the localization procedure.
Figure 11. The cumulative distribution functions of the GDoP.
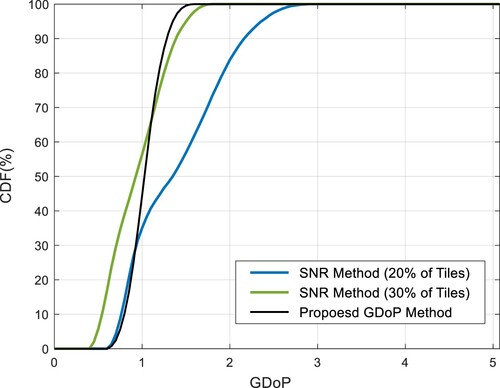
It can be observed that the proposed method achieves a better GDoP metric compared with the SNR method that utilizes 20% of the tiles while the CDF of the GDoP values for the SNR method that involves 30% of the tiles are comparable to the proposed method that only utilizes 10% of the tiles. Consequently, this improvement in the GDoP reflects upon decreasing the positioning error (at 90% of the CDF values) from about 45 cm using 70% of the tiles to about 18 cm using only 10% of the tiles as illustrated in .
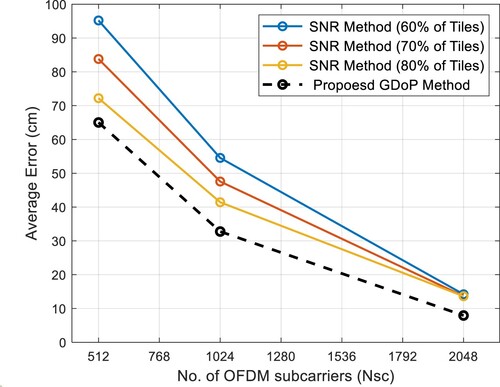
Furthermore, the empirical CDF of the positioning error is evaluated for different numbers of OFDM subcarriers as illustrated in . In this figure, the SNR method uses 60% of the tiles while the proposed scheme involves only 10% of the tiles. The localization performance of both methods improves as the number of subcarriers increases. However, the proposed system outperforms the SNR method for all the cases particularly when the number of subcarriers is less than 1024. Likewise, the average localization errors are obtained and plotted in for different numbers of OFDM subcarriers using 60%, 70% and 80% of the tiles for the SNR method compared with the proposed GDoP method. The estimation error decreases when the number of subcarriers increases because the ToA estimation accuracy is limited by the signal bandwidth however, the proposed localization scheme outperforms the SNR method that employs 60%−80% of the tiles in the localization estimation.
Figure 12. Empirical CDF of the estimation error for different numbers of OFDM subcarrier numbers at 60% of the tiles compared with the proposed GDoP method.
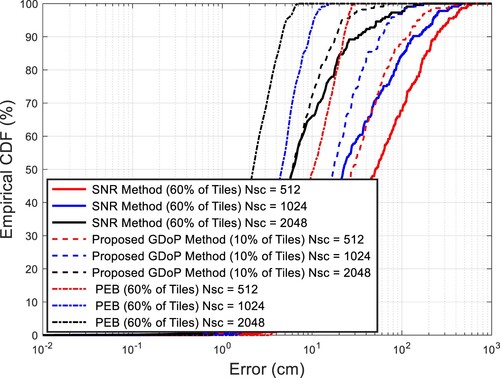
Figure 13. Average localization errors for different numbers of OFDM subcarrier at 60%, 70% and 80% of the tiles for SNR method compared with the proposed GDoP method.
7. Conclusion
This paper presented an investigation of NLoS single anchor RIS-aided localization based on GDoP analysis in the near-field for asynchronous OFDM systems. The signal and system scenario have been analysed and modelled. Subsequently, GDoP analysis has been presented for RIS tile selections based on the SNR selection method. Then, the RIS tiles selection method is proposed based on GDoP analysis and verified via numerical simulation. Consequently, it follows that the analysis offered in this research offers helpful guidelines for the design of RIS-aided localization system. The performance evaluation of the proposed system demonstrated that using radio measurements provided by 10% of the RIS tiles can provide sufficient localization accuracy compared with measurements provided by 70% of the tiles when the SNR metric is used for selection. Future extensions of this work could include developing tile selection methods based on GDoP using artificial intelligence and machine learning techniques. Also, using RIS or muti-RIS-aided localization in the far field is one of the suggested future works.
Disclosure statement
No potential conflict of interest was reported by the authors.
Correction Statement
This article has been corrected with minor changes. These changes do not impact the academic content of the article.
References
- Abdullah, Z., Kisseleff, S., Martins, W. A., Chen, G., Sanguinetti, L., Ntontin, K., Papazafeiropoulos, A., Chatzinotas, S., & Ottersten, B. (2022). Cooperative hybrid networks with active relays and RISs for B5G: Applications, challenges, and research directions. IEEE Wireless Communications, 1–7. https://doi.org/10.1109/MWC.012.2200292
- Abu-Shaban, Z., Keykhosravi, K., Keskin, M. F., Alexandropoulos, G. C., Seco-Granados, G., & Wymeersch, H. (2021). Near-field localization with a reconfigurable intelligent surface acting as lens. IEEE International Conference on Communications. https://doi.org/10.1109/ICC42927.2021.9500663
- Albaidhani, A., & Alsudani, A. (2021). Anchor selection by geometric dilution of precision for an indoor positioning system using ultra-wide band technology. IET Wireless Sensor Systems, 11(1), 22–31. https://doi.org/10.1049/wss2.12006
- Alhafid, A. K., & Younis, S. (2020). Observed time difference of arrival based position estimation for LTE systems: Simulation framework and performance evaluation. Eastern-European Journal of Enterprise Technologies, 3(9–105)), 20–28. https://doi.org/10.15587/1729-4061.2020.201382
- Björnson, E., Sanguinetti, L., Wymeersch, H., Hoydis, J., & Marzetta, T. L. (2019). Massive MIMO is a reality—What is next? Digital Signal Processing, 94, 3–20. https://doi.org/10.1016/j.dsp.2019.06.007
- Dardari, D., Decarli, N., Guerra, A., & Guidi, F. (2022). Los/NLOS near-field localization with a large reconfigurable intelligent surface. IEEE Transactions on Wireless Communications, 21(6), 4282–4294. https://doi.org/10.1109/TWC.2021.3128415
- Deng, Z., Wang, H., Zheng, X., Fu, X., Yin, L., Tang, S., & Yang, F. (2019). A closed-form localization algorithm and GDOP analysis for multiple TDOAs and single TOA based hybrid positioning. Applied Sciences, 9(22), 4935–4957. https://doi.org/10.3390/app9224935
- Deng, Z., Wang, H., Zheng, X., & Yin, L. (2020). Base station selection for hybrid TDOA/RTT/DOA positioning in mixed LOS/NLOS environment. Sensors, 20(15), 4132–4149. https://doi.org/10.3390/s20154132.
- Elzanaty, A., Guerra, A., Guidi, F., & Alouini, M. (2021). Reconfigurable intelligent surfaces for localization: Position and orientation error bounds. IEEE Transactions on Signal Processing, 69, 5386–5402. https://doi.org/10.1109/TSP.2021.3101644
- Han, Y., Tang, W., Jin, S., Wen, C. K., & Ma, X. (2019). Large intelligent surface-assisted wireless communication exploiting statistical CSI. IEEE Transactions on Vehicular Technology, 68(8), 8238–8242. https://doi.org/10.1109/TVT.2019.2923997
- He, J., Wymeersch, H., Kong, L., Silven, O., & Juntti, M. (2020). Large intelligent surface for positioning in millimeter wave MIMO systems. IEEE Vehicular Technology Conference. (pp. 1–5). https://doi.org/10.1109/VTC2020-Spring48590.2020.9129075
- He, J., Wymeersch, H., Sanguanpuak, T., Silven, O., & Juntti, M. (2020). Adaptive beamforming design for mmWave RIS-aided joint localization and communication. 2020 IEEE Wireless Communications and Networking Conference Workshops, WCNCW 2020 - Proceedings, (pp. 1–6). https://doi.org/10.1109/WCNCW48565.2020.9124848
- He, Q., Sun, Sh., & Zhou, L. (2019). Tunable/Reconfigurable Metasurfaces: Physics and Applications. Research, 2019(2), 1–16. https://doi.org/10.34133/2019/1849272
- Hu, S., Rusek, F., & Edfors, O. (2018). Beyond massive MIMO: The potential of positioning with large intelligent surfaces. IEEE Transactions on Signal Processing, 66(7), 1761–1774. https://doi.org/10.1109/TSP.2018.2795547
- Huang, C., Alexandropoulos, G. C., Zappone, A., Debbah, M., & Yuen, C. (2018). Energy efficient multi-user MISO communication using Low resolution large intelligent surfaces. 2018 IEEE Globecom Workshops, GC Wkshps 2018 - Proceedings https://doi.org/10.1109/GLOCOMW.2018.8644519
- Huang, C., Zappone, A., Alexandropoulos, G. C., Debbah, M., & Yuen, C. (2019). Reconfigurable intelligent surfaces for energy efficiency in wireless communication. IEEE Transactions on Wireless Communications, 18(8), 4157–4170. https://doi.org/10.1109/TWC.2019.2922609
- Keykhosravi, K., Keskin, M. F., Seco-Granados, G., & Wymeersch, H. (2021, June 14–23). SISO RIS-Enabled joint 3D downlink localization and synchronization. IEEE International Conference on Communications, Montreal, QC, Canada. https://doi.org/10.1109/ICC42927.2021.9500281
- Laveti, G., Rao, G. S., Chaitanya, D. E., & Kumar, M. N. V. S. S. (2016). Tdoa measurement based GDOP analysis for radio source localization. Procedia Computer Science, 85(Cms), 740–747. https://doi.org/10.1016/j.procs.2016.05.261
- Liaskos, C., Nie, S., Tsioliaridou, A., Pitsillides, A., Ioannidis, S., & Akyildiz, I. (2018). A New wireless communication paradigm through software-controlled metasurfaces. IEEE Communications Magazine, 56(9), 162–169. https://doi.org/10.1109/MCOM.2018.1700659
- Ma, T., Xiao, Y., Lei, X., Xiong, W., & Ding, Y. (2021). Indoor localization with reconfigurable intelligent surface. IEEE Communications Letters, 25(1), 161–165. https://doi.org/10.1109/LCOMM.2020.3025320
- Mohammad Razavizadeh, S., & Svensson, T. (2020, February 18–20). 3D beamforming in reconfigurable intelligent surfaces-assisted wireless communication networks. WSA 2020 - 24th International ITG Workshop on Smart Antennas, Hamburg, Germany.
- Najafi, M., Jamali, V., Schober, R., & Poor, H. V. (2021). Physics-Based modeling and scalable optimization of large intelligent reflecting surfaces. IEEE Transactions on Communications, 69(4), 2673–2691. https://doi.org/10.1109/TCOMM.2020.3047098
- Ozdogan, O., Bjornson, E., & Larsson, E. G. (2020). Intelligent reflecting surfaces: Physics, propagation, and pathloss modeling. IEEE Wireless Communications Letters, 9(5), 581–585. https://doi.org/10.1109/LWC.2019.2960779
- Ozturk, C., Keskin, M. F., Wymeersch, H., & Gezici, S. (2022). RIS-aided near-field localization under phase-dependent amplitude variations. 1–13. http://arxiv.org/abs/2204.12783
- Rahal, M., Denis, B., Keykhosravi, K., Uguen, B., & Wymeersch, H. (2021, September 27–30). RIS-Enabled localization continuity under near-field conditions. IEEE 22nd International Workshop on Signal Processing Advances in Wireless Communications (SPAWC), Lucca, Italy. https://doi.org/10.1109/SPAWC51858.2021.9593200
- Sarieddeen, H., Saeed, N., Al-Naffouri, T. Y., & Alouini, M. S. (2020). Next generation terahertz communications: A rendezvous of sensing, imaging, and localization. IEEE Communications Magazine, 58(5), 69–75. https://doi.org/10.1109/MCOM.001.1900698
- Tataria, H., Shafi, M., Molisch, A. F., Dohler, M., Sjoland, H., & Tufvesson, F. (2021). 6G wireless systems: Vision, requirements, challenges, insights, and opportunities. Proceedings of the IEEE, 109(7), 1166–1199. https://doi.org/10.1109/JPROC.2021.3061701
- Teng, Y., Wang, J., Huang, Q., & Liu, B. (2018). New characteristics of weighted GDOP in multi-GNSS positioning. GPS Solutions, 22(3), 1–9. https://doi.org/10.1007/s10291-018-0740-z
- Tsilipakos, O., Tasolamprou, A. C., Pitilakis, A., Liu, F., Wang, X., Mirmoosa, M. S., Tzarouchis, D. C., Abadal, S., Taghvaee, H., Liaskos, C., Tsioliaridou, A., Georgiou, J., Cabellos-Aparicio, A., Alarcón, E., Ioannidis, S., Pitsillides, A., Akyildiz, I. F., Kantartzis, N. V., Economou, E. N., & Tretyakov, S. (2020). Toward intelligent metasurfaces: The progress from globally tunable metasurfaces to software-defined metasurfaces with an embedded network of controllers. Advanced Optical Materials, 8(17), https://doi.org/10.1002/adom.202000783
- Wu, P., Su, S., Zuo, Z., Guo, X., Sun, B., & Wen, X. (2019). Time difference of arrival (TDOA) localization combining weighted least squares and firefly algorithm. Sensors, 19, https://doi.org/10.3390/s19112554
- Wu, Q., & Zhang, R. (2020). Towards smart and reconfigurable environment: Intelligent reflecting surface aided wireless network. IEEE Communications Magazine, 58(1), 106–112. https://doi.org/10.1109/MCOM.001.1900107
- Wymeersch, H. (2020). A fisher information analysis of joint localization and synchronization in near field. 2020 IEEE International Conference on Communications Workshops, ICC Workshops 2020 - Proceedings, 1–6. https://doi.org/10.1109/ICCWorkshops49005.2020.9145059
- Wymeersch, H., He, J., Denis, B., Clemente, A., & Juntti, M. (2019). Radio localization and mapping with reconfigurable intelligent surfaces. grant, 318927, 1–9. http://arxiv.org/abs/1912.09401
- Yang, Z., Zhang, H., Zhang, H., Di, B., Dong, M., Yang, L., & Song, L. (2023). Metaslam: Wireless simultaneous localization and mapping using reconfigurable intelligent surfaces. IEEE Transactions on Wireless Communications, 22(4), 2606–2620. https://doi.org/10.1109/TWC.2022.3213053
- Zhang, H., Zhang, H., Di, B., Bian, K., Han, Z., & Song, L. (2021). Metalocalization: Reconfigurable intelligent surface aided multi-user wireless indoor localization. IEEE Transactions on Wireless Communications, 20(12), 7743–7757. https://doi.org/10.1109/TWC.2021.3087354