
 ?Mathematical formulae have been encoded as MathML and are displayed in this HTML version using MathJax in order to improve their display. Uncheck the box to turn MathJax off. This feature requires Javascript. Click on a formula to zoom.
ABSTRACT
Human pose detection has attracted more attention in recent years, particularly with various applications such as human-computer interaction, motion recognition, action prediction, gaming, sign language translation, video surveillance and human tracking. For example, it is challenging to analyse the proportions of the human body in historical artwork collections for classifying genres, styles, and artists. Unfortunately, most of existing detection methods do not generalize well across artworks, resulting in poorly recognized differences in the proportions. Therefore, we present a large-scale analysis of 130,000+ paintings and ninety-nine human pose estimation (HPE) methods to show that different artistic styles have a distinct average degree of human proportions. We have further verified that the Topdown Heatmap + Scnet algorithm with a threshold of 0.3 can classify artworks effectively and fully distinguish historical epochs. This analysis is a baseline for researchers to discover new techniques towards finding the canon of art based on symmetry and proportions.
1. Introduction
In his famous and influential book on architecture, Vitruvius, the Roman architect and engineer, wrote (Pollio et al., Citation1914) that each architectural style is associated with the canon of art. This canon of art was supposed to be related to the proportions of the human body that prevailed in a given area and historical time. This subject was picked up by the Renaissance artist Leonardo Da Vinci, who noticed equivalent relationships almost 1000 years after Vitruvius. Interestingly, despite the passage of time, it turned out that the principle works in every historical era. The theses of Vitruvius, Da Vinci and other art historians (Corbusier, Citation2000; Gwilt, Citation2014) were not based on mathematical reasoning but on more reliable argumentation. Modern artificial intelligence methods allow us to check these statements from a different perspective. We can study the proportions of the human body in historical artworks using HPE technologies. In short, HPE aims to determine the position of the body's critical points of a person from a given image or video. In addition, we can analyse the results using statistical significance tests to separate hypotheses into those that should be believed and those that should be rejected and finally rank plausible theories according to relative credibility.
Literature studies (Borngasser et al., Citation2008; Koch & Koch, Citation1980; Thiersch, Citation1904) indicate an apparent relationship between the canon of art and body proportions in a given epoch. The study of body proportions in art explores a system based on mathematical ratios used to maintain balance when drawing a human figure. They describe the canon of art as a set of rules that lead to the creation of an object considered beautiful. These rules were in force in a given area at a given time and concerned, among other things, ideal human proportions. Despite apparent differences in the works of individual artists of a given era, historians of art and architecture can prove that such a set of rules exists. However, it prompts whether modern computer vision methods can register it. To put it simply, which of the current applications is so advanced that, apart from indicating the characteristic points of the body based on anthropological data, it can also notice the canon of art?
The issue was shown in depicting the Greek / Roman goddess Afrodyta / Venus – the personification and the idea of beauty. One of the pictures is a Roman copy of an original Greek sculpture from IV BCE. The second painting comes from the end of the Renaissance and is by Botticelli, and the third is from the 19th century. The analysis of human proportions based on data defining the critical nodes of human position with the DeepPose algorithm shows significant differences. A comparison of these results with the literature shows some convergence.
Figure 1. Comparison of human body proportions using OpenPose HPE library for body, face, hands, and foot estimation. (a) Capitoline Venus (2nd century C.E.). (b) The Birth of Venus by Botticelli (c. 1484–1486) and (c) Venus Pierre Paul Prud'hon (1810).
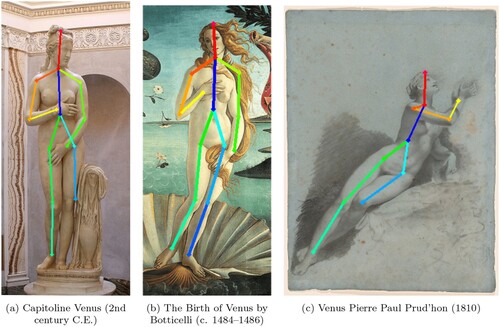
The proportions calculated for Capitoline Venus should be under the ancient canon of Polykleitos (5th century BC) and amount to 0.125. The ratios for Venus by Botticelli correspond to the principle of Leonardo Da Vinci (15th century), i.e. 0.1. On the other hand, the results of the selected algorithm give the following values: 0.16 (a), 0.14 (b), and 0.09 (c). These results are not even close to the canonical ones. However, they are different enough that we can suspect that computer vision algorithms will be able to distinguish between historical epochs based on human proportions.
We will address the problem from another angle, regardless of what we calculated. Understanding the canon of art is especially important in extending the previous results. Therefore, the first research question of this study is to find the answer to existing HPE methods. Can capture the differences in the proportions of the human body in historical paintings. However, capturing the differences in the proportions is not enough. We must find a strict relationship between the historical period and body proportions. To bridge this gap, the second research question of this study is to investigate whether the massive use of HPE methods on historical paintings will confirm the thesis that the canon of art is related to human proportions. In addition, selected modern HPE methods were reviewed, and the usefulness of these algorithms for art classification was assessed by comparing the results. The results obtained were subjected to statistical analysis. As a result, outliers were rejected, and the statistical significance of the received data was evaluated. The rest of the paper is organized as follows. We start with analysing human proportions in historical paintings. We present datasets and setup for selected testing models. Next, we propose the three significant measures for model evaluation. A detailed description of the methodology and results follows this. Theoretical and practical implications are discussed in the last two sections. The code and pre-trained models can be found in GitHub repository.Footnote1
In summary, our main contributions are:
First, we tested whether HPE architectures could be used to determine differences in the proportions of people depicted in historical images.
Secondly, we address the problem of verifying whether the results obtained in the mass examination of European painting from the Gothic to Romantic period using HPE justify the thesis that each era has its peculiar canon of art based on human proportions.
Finally, we test whether the obtained results are sufficient to build new deep-learning classifiers that allow recognition of the canon of art in historical painting and the work creation era.
Compared to the state of the art, using the proposed method may lead to the creation of a classifier not only of the canon of art but also of the architectural style and the estimation of the building construction period. Finally, the solution can assess real estate value, urban tissue records or smart city solutions.
2. Analysing human proportion in historical paintings
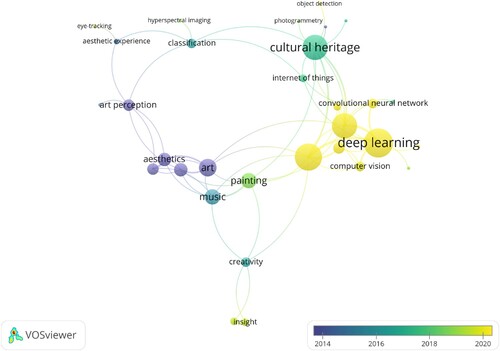
The problem of automatic classification of artworks has gained importance in recent years. Bibliometric analysis was performed using the VOSviewerFootnote2 software tool, which generates bibliometric maps by building a network of keywords and their occurrence density. Articles from the ScienceDirect database from 2010–2023 that answered the question ‘(artwork classification or painting classification) and automatic’ were downloaded for the analysis. Finally, 352 results were received and analysed by the keyword co-occurrence analysis method. The obtained bibliometric map () shows not only the density of the keyword but also, through colours, the period when the interest in the topic was the strongest. The map shows that the interest in the automatic classification of artworks shifted from the cultural heritage, art perception, and aesthetics to modern machine learning methods, stimulating creativity, gaining insight, and problem-solving. It is also worth noting that the size of the nodes responsible for the density of interest in a given keyword changes over time. Interest in the topic below 2015 is low and gains momentum after 2018.
Figure 2. Bibliometric graph of automatic artwork classification.
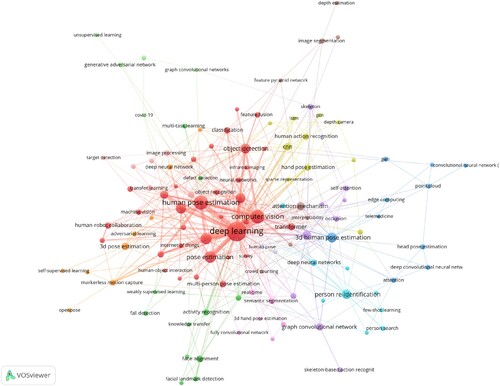
Another bibliometric analysis concerns the development of scientific works related to human pose estimation. shows a graph that grouped keywords into clusters that showed trends of scientific interest. The most extensive collection, with 35 items, focuses on methods. Deep learning is the element with the highest occurrence rank, which occurs 135 times. Cluster 2 contains 11 items, the largest of which is ‘face alignment’. Cluster 3 includes ten items, and the item with the most occurrences is ‘3D human pose estimation’. The following are: ‘human action recognition’ (4), ‘facial expression recognition’ (5), ‘person re-identification’ (6), ‘markerless motion capture’ (7), ‘attention mechanism’ (8), ‘3D hand pose estimation’ (9), ‘image classification’ (10), ‘generative adversarial network’ (11), ‘multi-person’ (12). Cluster 8 also contains the item ‘human parsing’, which describes the scope of our research. This element is related to two other nodes: ‘image segmentation’ and ‘skeleton’.
Figure 3. Bibliometric graph of human pose estimation.
The presented bibliometric maps indicate the dynamic development of the field in many directions. HPE is used in increasingly new areas of science.
Historically, the first work that analyses the relationship of the proportions of the human body to the canon of art is ‘Ten Books of Architecture’ by Vitruvius (Pollio et al., Citation1914). This work, which was created in antiquity, describes ancient styles and orders of art. For the first time in history, the author shows that the proportions of the human body also relate to architecture. The development of works in this area took place in the Renaissance (Dürer, Citation2011; Leonardo et al., Citation1949), but particular attention should be paid to the 19th century Encyclopedia of Architecture (Gwilt, Citation2014), where the accounts mentioned above are collected from the entire historical period and presented in an orderly manner. Attempts to create new relationships between the proportions of the human body and art and architecture can also be seen today, for example, in Le Corbusier's ‘Modulor’ (Corbusier, Citation2000).
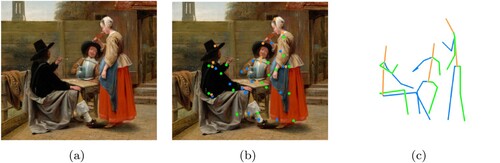
Body position in images that contain several persons is the image segmentation problem class and is estimated using one of two methods: top-down or bottom-up (Kumar et al., Citation2022; Samkari et al., Citation2023; Zheng et al., Citation2023). The top-down method, shown in , works in two steps. In the first stage, the detector searches for objects in the image and annotates the found objects by bounding them. In the second stage, each found object is fed to the HPE processor that estimates the position of the human body. The second method works differently (). First, all points that may be joints or distinguished parts of the human body are searched. Then, the BPA (Body Part Association) processor attempts to complete the skeletons.
Figure 4. Top-down approach. Image origin: Pieter de Hooch – The Dutch Courtyard (1658), Mauritshuis Museum in Hague.
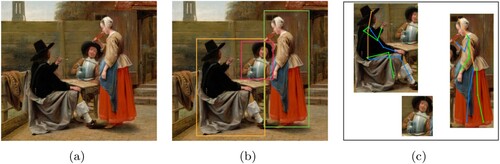
Figure 5. Bottom-up approach. Image origin: Pieter de Hooch – The Dutch Courtyard (1658), Mauritshuis Museum in Hague.
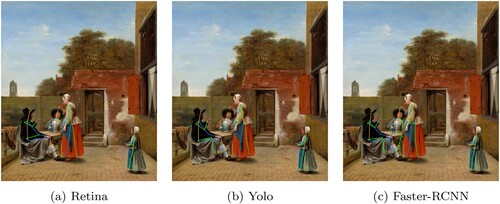
In the top-down approach, the figure detector selection performed in the algorithm's first step plays a key role. shows Pieter de Hooch's painting - Dutch Courtyard with HPE algorithms output: joints marked as points and skeleton parts as lines. To compare the impact of the figure detector on the HPE result, the second stage of the algorithm (finding the nodes responsible for the skeleton) is exactly the same for each test. The first stage differs, and three main detectors were compared: Retina (Lin et al., Citation2017), Faster-RCNN (Ren et al., Citation2017, June), and Yolo (Redmon & Farhadi, Citation2018). Each of these detectors correctly recognized four figures in the painting. However, the annotations limiting the area where these figures are located differ. Therefore, the data provided for the second stage of the algorithm and the result are different. For the Retina detector (a), Resnet-based HPE finds four skeletons but no legs. For Yolo (b), the figure sitting in the background is bounded by a rectangle for which Resnet cannot find the skeleton nodes. However, it is worth paying attention to the precision of the representation of the limbs. For this example, the Faster-RCNN detector (c) did the best job – all four characters are correctly mapped. This test does not determine the superiority of one detector over others, but it shows how important this step is for the final result. It is worth mentioning that detection and segmentation solutions are undergoing intensive development and new methods are constantly emerging.
Figure 6. HPE top-down Resnet result for the MPII dataset and selected detectors. Image origin: Pieter de Hooch – The Dutch Courtyard (1658), Mauritshuis Museum in Hague. (a) Retina. (b) Yolo and (c) Faster-RCNN.
Next, the way the skeleton is built is specific to each algorithm. All algorithms selected for evaluation are deep-learning solutions with complex architecture. The common feature is how these solutions were trained: they were all trained using the same computing resources and on the same training sets. There are several training sets, but two are essential:
Max Planck Institute for Informatics (MPII) Human Pose Dataset.
Microsoft Common Objects in Context (COCO).
The MPII dataset contains approximately 25,000 images with more than 40,000 people and 15 annotated body joints (key points) (Andriluka et al., Citation2014). The sets were collected based on the registration of the typical activities of 410 people. The COCO dataset includes 330,000 images and 200,000 items annotated with 17 key points (Lin et al., Citation2014). There is also an extension for the COCO dataset – COCO-WholeBody (Jin et al., Citation2020) with detailed annotations for all parts of the human body (BODY_25 – 25 key points is the most popular).
shows the result of the OpenPose model trained on selected datasets. The 18th-century painting by Thomas Gainsborough, ‘The Blue Boy’, was given as input to the HPE algorithm. This painting shows a standing boy (Jonathan Buttall) with visible limbs. Note that the critical points for the COCO set are a subset of BODY_25. In addition, for MPII, COCO and BODY_25, various critical issues on the human body within the head and torso are estimated. For example, the model trained with the MPI dataset highlights such vital points as the top of the head, chest, and the beginning of the neck. Thanks to these data, it is possible to estimate the height of a person and the proportions of his body parts. Models derived from COCO are more exact: eyes and ears are marked on the head. The torso is counted from the neck to the pelvis. Unfortunately, no point would be responsible for the top of the head in these models. Estimating the height of a figure is tricky. summarizes popular keypoint mapping.
Figure 7. HPE result for selected datasets. Source image: Thomas Gainsborough – The Blue Boy (Jonathan Buttall) (1770), Huntington Library, San Marino, California. (a) MPII dataset. (b) COCO dataset and (c) BODY_25 dataset.
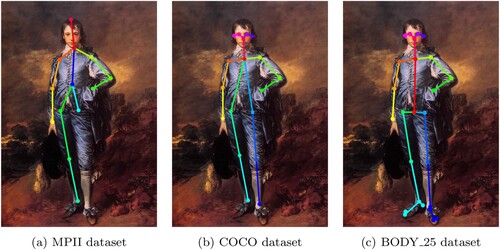
Table 1. Body part mapping for selected datasets.
The use of HPE algorithms can, through the correct mapping of critical points of the human body in historical paintings, reflect trends in the canons of art. Due to this, it would be possible to build a classifier that recognizes the style of art or maybe architecture as well. This hope is based on the conviction of many researchers that there is a relationship between the canon of art (and the related proportions of the human body) and architectural style (Corbusier, Citation2000; Gwilt, Citation2014; Koch & Koch, Citation1980; Pollio et al., Citation1914; Thiersch, Citation1904).
3. Methodology
3.1. Examining HPE architectures against correct detection of human proportion in historical paintings
HPE algorithms are usually trained on photos of living people performing activities typical of a modern man. The question of whether the selected HPE architecture will correctly recognize the figure of a man and estimate his pose in a historical painting is not groundless. Firstly, the texture of the presented material changes because we have a photograph of a painted image. It lacks depth of field presented in real photos related to the aperture, and everything is equally sharp (Jeong et al., Citation2021). Secondly, we are dealing with various painting techniques that are not identical to a representation of reality as in the photo. Ultimately, many of the typical human activities depicted in historical images are not present in modern life, and these types of exposures were not involved in training HPE applications, e.g.crucifixion.
Evaluating the selected HPE architecture would be simpler if there were correct answers from critical points on the examined painting. Unfortunately, we do not have such a collection for two reasons: we want to use an extensive collection of European paintings in testing and manually marking key points would be laborious, and secondly, we would not be sure that manual marking would be correct. Thus, statistical methods remain.
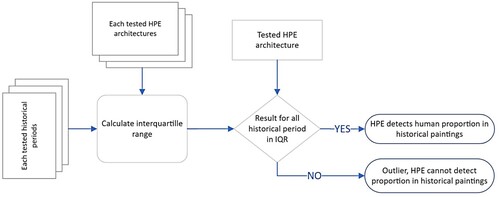
We cope with the problem by calculating the average value of human proportions for each historical period. The interquartile range was also determined in the same way. The algorithm that generated results outside the designated range was considered unable to correctly recognize human proportions in historical images. The method is illustrated in .
Figure 8. Finding outliers allows us to detect these HPE architectures, which cannot correctly detect human proportions in historical paintings.
3.2. Examining HPE architectures against detecting canon of art in artworks
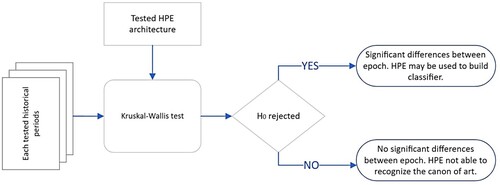
After rejecting the HPE architectures that generate outliers, we consider that the remaining HPE correctly recognize humans and can cause the correct skeleton corresponding to its position. These skeletons are the basis for determining the proportions proposed in the next chapter. We used a set of statistical tests to evaluate whether the selected HPE architecture detects the canon of art. The collection of paintings has been divided into six groups according to the epoch of the work's creation. Each group was one of the compared populations. First, the Shapiro-Wilk normality test was performed. The null hypothesis of the Shapiro-Wilk test assumes that data is normally distributed. The
is rejected if the p-value is greater than 0.05. For all test
is rejected, we assume that the dataset has non-normal distribution. Next, we perform Kruskal-Wallis test due the fact that compared population are not of equal size. The null hypothesis
of the Kruskal-Wallis test assumes the equality of distribution functions in the compared populations. Rejecting the null hypothesis
means that populations differ, i.e. the algorithm recognizes the canon of art only based on the proportions of the human body. Finally, post hoc Nemenyi's statistical test was performed for each population pair to answer the question how particular epoch differ. The idea is presented in .
Figure 9. The Kruskal-Wallis test makes it possible to check whether the population of the values of the calculated human proportions in epochs differs significantly.
3.3. Human proportion measures
Many training datasets mapping the human body exist. However, we decided to use MPII due to its compatibility with the literature of art history and the measures used there. Historically, the oldest measure is the head's proportion to the figure's height proposed by Vitruvius (Pollio et al., Citation1914). Further measures of proportions can be found in Albrecht Dürer's ‘Four Books on the Proportions of the Human Body’ (Dürer, Citation2011), Joseph Gwilt's ‘An Encyclopaedia of Architecture, Historical, Theoretical, and Practical’ (Gwilt, Citation2014) or Le Corbusier's ‘Le Modulor’ (Corbusier, Citation2000). Finally, we select three proportions whose calculation can be based on MPII key points.
Running experiments for all detectors, algorithms, and threshold parameters, we got critical points for any person detected in historical pictures. Next, body parts are calculated as the Euclidean distance in a 3-dimensional space. The head, marked , is the distance between the points annotated as 0-Head and 1-Neck. The shoulder,
, is calculated as the average of the right and left shoulder; it means the standard distance between the points annotated as 2-RShoulder and 1-Neck and 5-LShoulder and 1-Neck. If one of the shoulders is undetected, the second is
. The same rule for the shoulder is used to calculate the body
. If both paths: 0-Head, 1-Neck, 11-LHip, 12-LKnee, 13-LAnkle and 0-Head, 1-Neck, 8-RHip, 9-RKnee, 10-RAnkle exist, the
is calculated as average, and in other cases, the existent one is taken. Finally, the paths 0-Head, 1-Neck, 11-LHip and 0-HEad, 1-Neck, and 8-RHip are calculated according to the presented rules and are noted as
.
Now, let us define the basic proportion: (1)
(1)
(2)
(2)
(3)
(3)
The proposed proportions reflect trends in art history and are present in historical paintings. If the HPE algorithms can recognize the rules applicable in the canon of art, then paintings from different eras should differ regarding the proposed measures.
4. Experiment setup
The National Gallery of ArtFootnote3 has an open access policy for images of works of art. More than 50,000 images are available for download for commercial or noncommercial use. In addition, the National Gallery has Art Open Data ProgramFootnote4 that provides data records relating to the 130,000+ artworks in the collection. Because all works of art are described and labelled, we can collect images by style or creation epoch. Finally, six subsets were created: Gothic, Renaissance, Baroque, Rococo, Classicism, and Romantic, containing 5016 paintings.
presents a list of collected paintings from a selected historical period. There is a noticeably low representation of the Gothic and Classicism periods in terms of the number of works. It should also be noted that not all of the paintings in the collection contain scenes with people. Some are landscapes, still, life, and other works of art where there are either no human figures or they are not recognizable. An exciting conclusion can also be drawn from results from the Baroque era: more detection of figures than the works themselves. This is because, during this period, many paintings are group scenes.
Table 2. Size of the collected painting dataset and characters detected inside the paintings by epochs.
The experiment was built using the OpenMMLabFootnote5 environment, an ecosystem for building projects based on deep learning solutions. Model ZooFootnote6 was necessary for our experiment. Model Zoo assumes that all developed algorithms are trained in parallel on the same dataset and simultaneously. This approach allows for a fair comparison of algorithms. The models trained in this way were the basis for examining the differences in human proportions in historical paintings.
As we wrote in Section 2, many 2D Body Keypoint Datasets are suitable for checking whether the detected body proportions have changed historically. However, we chose only the MPII (Andriluka et al., Citation2014) set because it is the only one that allows you to measure the entire head. This is important if we want to compare the results with literature studies. Since antiquity, authors associated with the history of art or the history of architecture have assigned a unique role to the proportion of the height of the head to the size of the human body (Corbusier, Citation2000; Pollio et al., Citation1914). Without measuring the head height, the comparison would be difficult. An additional argument that makes the MPII dataset well suited to the experiment is that the size of the human body is counted from the top of the head to the heel through the points of the neck, hip, and knee. This seems like a narrow range compared to other modern datasets, but that is how human height was calculated in historical studies (Pollio et al., Citation1914). Reference to the literature will be more credible.
Model Zoo for the MPII set includes trained models: Resnet (K. He et al., Citation2016, June), Scnet (Liu et al., Citation2020, June), Resnetv1d (T. He et al., Citation2019, June), Seresnet (Hu et al., Citation2018, June), Shufflenetv1 (X. Zhang et al., Citation2018, June), Mobilenetv2 (Sandler et al., Citation2018), CPM (Wei et al., Citation2016, June), Hourglass (Newell et al., Citation2016), DarkPose (F. Zhang et al., Citation2020, June), Resnext (Xie et al., Citation2017, July), Litehrnet (Yu et al., Citation2021), Shufflenetv2 (Ma et al., Citation2018), Hrnet (Sun et al., Citation2019). Some of these models are top-down models, and others are bottom-up models. As we wrote earlier Section 2, top-down models require only one figure in the presented image. Pre-processing the historical image with a character detector is needed to ensure this requirement. At the input of the selected model, only a fragment of the recorded image containing the detected figure is presented. If there are several characters in the recorded image, each is extracted, and separately, the fragment with this character is the model's input. Bottom-up models do not have this limitation, and several symbols can be in the image. However, our task is not to compare which approach is better, top-down versus bottom-up, but to compare how the algorithms recognize body parts and whether the proportions resulting from reaching these body parts are historically variable. For this reason, we treated bottom-up algorithms as top-down: a fragment of a historical image containing one character is also given to the input. The added advantage is that the number of human images tested for each historical epoch is always the same.
In Section 2, it was shown that the choice of character detector is crucial for the operation of top-down algorithms. We chose three critical sensors: Retina (Lin et al., Citation2017), Faster-RCNN (Ren et al., Citation2017, June), and Yolo (Redmon & Farhadi, Citation2018), and tested each model using each of them. Additionally, each detector has a sensitivity parameter: bounding-box threshold (bbox_thr). Only bounding boxes with higher scores will be fed into the pose detector. If bbox_thr is None, all packages and 1 – no packets will be used. We built our experiments due to testing on bbox_thr in 0.3, 0.5, 0.7.
Finally, each experiment can be described by a three: detector, algorithm, and threshold parameter, and thus we get 99 stacks. Each one processes 5012 historical paintings.
5. Results
5.1. Detecting human proportion in historical paintings
Lemma 5.1
HPE algorithms correctly recognize human proportions in historical paintings.
In Section 2, examples of the pose of persons in paintings are shown. One is invalid due to a lack of . This problem also refers to the results of the experiments. Finding and omitting outliers is copped by comparing the mean of each body part in the selected experiment to the interquartile range based on the data of all the experiments. For example, for each of 99 experiments defined by the threes: detector, algorithm, and threshold, the mean of
is calculated, and then the interquartile range is appointed for all calculated means. Let the first quartile be indicated as
and the third as
, then the interquartile range
. Next, finding the upper and lower bounds of the data allows one to identify values large or small and, respectively, determine the outliers. The lower bound is
and the upper bound is
.
shows the calculation results for the range defining valid values. Proportions outside the given ranges are considered outliers, and the algorithms that produce them are treated as useless for further research. Analysing the data from the table shows that the average values for the proportion are different for each epoch. For the proportion
, the mean values for Gothic and Renaissance are identical, but the interquartile values are different. In general, it can be said that the ranges of values that are not outliers are close and strongly overlapping. This should not come as a surprise since among the algorithms considered. Some algorithms do not distinguish between historical epochs. We cannot throw them away at this stage because the proportions calculated by them are within the range of correct data. The following section will look at statistical significance analysis for historical periods.
Table 3. Calculated interquartile range and the bounds of valid proportion values.
contains experiments that do not meet the condition that the median is within the lb – ub range for all types of proportions of ,
, and
. The ‘+’ sign indicates the experiments for which the values are in the range, and the ‘−’ sign indicates the experiments that are out of the range. Experiments for which we get ‘−’ are experiments that do not correctly detect characters in historical images. shows an example of an incorrect mapping of a person's position.
Figure 10. Invalid output of (a) Faster-RCNN Topdown Heatmap + Shufflenetv1 on 0.3, (b) Retina Deeppose + Resnet on 0.3, (c) Yolo Topdown Heatmap + Shufflenetv1 on 0.7. Image origin: Pieter de Hooch – The Dutch Courtyard (1658), Mauritshuis Museum in Hague.
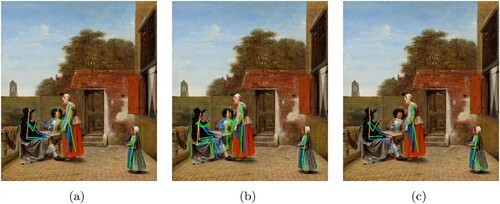
Table 4. Experiments that produce outliers.
In example (a) of , we have a terrible fit of the limb. The hands of the person in the middle are mapped to the hands of those around them. The same applies to the right knee. This incorrect mapping lengthens the limbs and alters the calculated proportions of the body . In example (b), the algorithm generated multiple skeletons for one person. These skeletons are significantly different, so that the statistics will be incorrect. In case (c), the girl on the right shares a knee node. This changes this character's proportions
.
Ultimately, only 13 of the 99 experiments showed problems detecting proportions in historical images. It can be assumed that the lemma presented at the beginning of the section is valid.
5.2. Human proportion statistical significance analysis
Lemma 5.2
HPE algorithms identify the canon of art in historical paintings.
Removing outliers from the collection of tested algorithms allows for a reliable comparison of the statistical significance of the difference between populations of proportions in historical epochs. Each set of parameters: detector, model, threshold parameter generated population sets of proportions ,
,
for the following epochs: Gothic, Renaissance, Baroque, Rococo, Classicism, Romanticism. The equality of distribution functions of these populations was compared during the Kruskal-Wallis test. The null hypothesis of the Kruskal and Wallis (Citation1952) test assumes that the population median of all groups is equal. Rejecting the null hypothesis does not indicate which of the groups differs. Post hoc comparisons between groups are required to determine which groups are different.
Tables: – summarize the results of the Kruskal-Wallis tests. ‘+’ means that the null hypothesis has been rejected for the selected body proportion, thus indicating that there are significant statistical differences in body proportions between populations associated with historical epochs. It is worth noting that most algorithms see differences in at least one type of human body proportion.
Table 5. Kruscal-Willis test for statistical signifcance selected human body proportion ,
,
during historical epoch.
Table 6. Kruscal-Willis test for statistical signifcance selected human body proportion ,
,
during historical epoch.
Table 7. Kruscal-Willis test for statistical signifcance selected human body proportion ,
,
during historical epoch.
The Topdown Heatmap + Scnet model for the threshold parameter 0.3 and the Faster-RCNN detector is the only one to reject the null hypothesis of the Kruskal-Wallis test for each type of proportion; therefore, the populations from this experiment were subjected to a post hoc test.
42 of 86 experiments showed the existence of a canon of art in a presented collection of paintings. The lemma at the beginning of the section is true for some HPE algorithms.
5.3. Analysis of statistical significance between epochs
Lemma 5.3
Basic human proportions /
/
are enough to recognize the era of the creation of the artwork.
The Kruscal-Walis test answers whether there are statistically significant differences between tested populations. Suppose the null hypothesis of no statistically significant differences between the sampled populations is rejected. In that case, the test does not answer which population are statistically significantly different. For this purpose, a post hoc test should be performed. In our case, we have populations with a distribution that is not normal and with different sizes. Nemenyi's statistical test (Nemenyi, Citation1963; Sachs, Citation2013) will be appropriate for such a configuration. Table shows the results for each pair of epochs, while the cells contain the results of the Nemenyi posthoc test for all three types of proportions. A value less than 0.05 rejects the null hypothesis that the populations are statistically similar. So, they are different and marked as bold.
Table 8. Nemenyi pairwise post hoc test for Topdown Heatmap + Scnet model with the threshold parameter of 0.3.
The tested set, Topdown Heatmap + Scnet for the Faster-RCNN detector with a threshold of 0.3, shows a high diversity of the canon of art for the Baroque, Rococo and Classicism eras. For other epochs, it cannot be said that the populations are statistically significantly different. The reason may be the low number of character detections for the Gothic and Romantic eras (). However, not very numerous Classicism is statistically significantly different.
We consider it enough to determine statistical significance for only one type of proportions to think that the set can distinguish between epochs based on the proportions of the human body. The use of HPE regressors as part of a more complex computer vision solution that classifies works of art according to the creation date can significantly affect the quality of such solutions.
6. Discussion and conclusions
We deliberately used the Zoo model of the OpenMMLab/MPose project, although there are newer HPE solutions (Liu et al., Citation2020; Xiao et al., Citation2020). We intend to show that the feature of recognizing a historical epoch by examining proportions is not the result of specific learning, its intensity, or the selection of learning patterns. In the Zoo model, all architectures were trained on the same data and with the same power. We have provided the right conditions for comparison. On the other hand, our work concerns a strongly developing discipline, and new solutions provide higher precision–new architectures of deep neural networks and new learning patterns. Studies comparing them with those we have received may be interesting.
The strength of the proposed solution is that the training data used are built on images that contain living people. There is a lot of this data compared to historical painting, so the learning process is more effective, and developing a new training set is possible. Despite the use of modern human images for learning, the solution can be used for historical images.
We asked three questions. The first was whether and which HPE architectures can be used to determine differences in the proportions of people depicted in historical paintings. The second was to justify the thesis that each era has its particular canon of art based on human proportions, and the third, if is it possible to use these methods to build new deep learning classifiers that allow recognition of the canon of art in historical painting and the creation era of artwork.
The results are fascinating. Ninety-nine modern algorithms were analysed, the vast majority of which are capable of classifying the epoch of the creation of the painting based on the analysis of the proportions of the human body. It is worth noting that the historical field of study is competitive because it spans epochs of unequal duration: the Middle Ages lasted much longer than the modern era. This is related to the number of artistic works available for analysis. In addition, the distinction between historical periods can be challenging: for example, Baroque and Rococo. The answer to the first question is to find an algorithm that can distinguish historical epochs based on the proportions of the human body depicted in the image. The relationship is confirmed by statistical significance analysis. This means that the concept of the canon of art is valid, and a mathematical relationship can assign the domain of depicted human figures to historical eras.
A summary of the results of the algorithms provides the answer to the third question. 42 of the 99 algorithms settings examined can notice differences between historical works. Most HPE algorithms are good at recognizing differences in the proportions of depicted figures in historical paintings. Also, after analysis of statistical significance, an algorithm has been found that can be considered to distinguish historical epochs based on human proportion analysis. It is a Topdown Heatmap + Scnet algorithm with a threshold of 0.3. This approach sheds new light on the issues related to the canon of art (perfection, symmetry, proportion, and pleasure to the eye).
In this work, we have shown that HPE algorithms can use the principle of historical proportions. Some of the existing HPE algorithms trained on images of living people are so precise that they can be used to recognize differences in the proportions of the human body over time. The exact proportions are valid in architectural compositions. Unfortunately, HPE solutions are not classifiers but regressors and cannot be applied directly. Thus, we plan to use it as a suitable backbone for more complex deep neural network architectures. We want to build such complex deep neural networks to record the features of architectural facades in the future.
The practical purpose of this work is not to identify the historical era of the creation of the painting because it is well catalogued in museums. According to the literature, the principle of historical proportions also applies to the architecture and composition of building facades. Recording urban tissue and the registration and cataloguing of its changes is one of the essential tasks of city services. The solution can also be used in methods for assessing real estate value or smart city solutions. The algorithms that help automate this work are valuable.
Future work may also focus on detecting the creator's individual style. If HPE applications are able to detect differences between different eras only based on human body proportions, we can also assume that it is possible to attribute a particular style to the author of an artistic work. This approach creates a completely new value for such a tool and enables applications in areas such as plagiarism detection or automatic valuation of art works on NFT exchanges.
Disclosure statement
No potential conflict of interest was reported by the author(s).
Notes
1 GitHub repository: github.com/mq3n/HPE-in-historical-paintings
2 VOSviewer site: www.vosviewer.com
3 National Gallery of Art: www.nga.gov
4 Open Data Program: github.com/nationalgalleryofart/opendata
5 OpenMMLab: openmmlab.com
6 OpenMMLab model Zoo: platform.openmmlab.com/modelzoo
References
- Andriluka, M., Pishchulin, L., Gehler, P., & Schiele, B. (2014). 2D human pose estimation: New benchmark and state of the art analysis. In 2014 IEEE conference on computer vision and pattern recognition (pp. 3686–3693). IEEE.
- Borngasser, B., Toman, R., & Bednorz, A. (2008). History of architecture: From classic to contemporary. Parragon.
- Corbusier, L. (2000). The modulor: A harmonious measure to the human scale, universally applicable to architecture and mechanics. Number t. 2 in Modulor. Birkhäuser.
- Dürer, A. (2011). Albrecht Dürer: Vier Bücher von menschlicher proportion (1528). Akademie Verlag.
- Gwilt, J. (2014). An Encyclopaedia of Architecture: Historical, Theoretical, and Practical, Cambridge Library Collection – Art and Architecture, Cambridge University Press.
- He, K., Zhang, X., Ren, S., & Sun, J. (2016, June). Deep residual learning for image recognition. In Proceedings of the IEEE conference on computer vision and pattern recognition (CVPR). IEEE.
- He, T., Zhang, Z., Zhang, H., Zhang, Z., Xie, J., & Li, M. (2019, June). Bag of tricks for image classification with convolutional neural networks. In Proceedings of the IEEE/CVF conference on computer vision and pattern recognition (CVPR). IEEE.
- Hu, J., Shen, L., & Sun, G. (2018, June). Squeeze-and-excitation networks. In Proceedings of the IEEE conference on computer vision and pattern recognition (CVPR). IEEE.
- Jeong, Y., Choi, J., Kim, D., Park, S., Hong, M., Park, C., Min, S., & Gwon, Y. (2021). Dofnet: Depth of field difference learning for detecting image forgery. Lecture Notes in Computer Science (including subseries Lecture Notes in Artificial Intelligence and Lecture Notes in Bioinformatics), 12627 LNCS:83–100.
- Jin, S., Xu, L., Xu, J., Wang, C., Liu, W., Qian, C., Ouyang, W., & Luo, P. (2020). Whole-body human pose estimation in the wild. CoRR, abs/2007.11858.
- Koch, W., & Koch, W. (1980). A handbook of European architectural styles. W. Foulsham.
- Kruskal, W. H., & Wallis, W. A. (1952). Use of ranks in one-criterion variance analysis. Journal of the American Statistical Association, 47(260), 583–621. https://doi.org/10.1080/01621459.1952.10483441
- Kumar, P., Chauhan, S., & Awasthi, L. K. (2022, December). Human pose estimation using deep learning: Review, methodologies, progress and future research directions. International Journal of Multimedia Information Retrieval, 11(4), 489–521. https://doi.org/10.1007/s13735-022-00261-6
- Leonardo, A., Vinci, D., & Heydenreich, L. H. (1949). Study of proportions.
- Lin, T.-Y., Goyal, P., Girshick, R., He, K., & Dollár, P. (2017). Focal loss for dense object detection. In Proceedings of the IEEE international conference on computer vision. IEEE.
- Lin, T.-Y., Maire, M., Belongie, S. J., Bourdev, L. D., Girshick, R. B., Hays, J., Perona, P., Ramanan, D., Dollár, P., & Zitnick, C. L. (2014). Microsoft COCO: Common objects in context. CoRR, abs/1405.0312.
- Liu, J., Dou, Y., Zhang, W., Tang, J., & Wu, G. (2020). Belief map enhancement network for accurate human pose estimation. In G. De Giacomo, A. Catalá, B. Dilkina, M. Milano, S. Barro, A. Bugarín, & J. Lang (Eds.), ECAI 2020 – 24th european conference on artificial intelligence, 29 August-8 September 2020, Santiago de Compostela, Spain, August 29–September 8, 2020 – including 10th conference on prestigious applications of artificial intelligence (PAIS 2020): Vol. 325. Frontiers in artificial intelligence and applications (pp. 2736–2743). IOS Press.
- Liu, J.-J., Hou, Q., Cheng, M.-M., Wang, C., & Feng, J. (2020, June). Improving convolutional networks with self-calibrated convolutions. In Proceedings of the IEEE/CVF conference on computer vision and pattern recognition (CVPR). IEEE.
- Ma, N., Zhang, X., Zheng, H.-T., & Sun, J. (2018). Shufflenet v2: Practical guidelines for efficient cnn architecture design. In Proceedings of the European conference on computer vision (ECCV) (pp. 116–131). Springer, Cham.
- Nemenyi, P. (1963). Distribution-free multiple comparisons. Princeton University.
- Newell, A., Yang, K., & Deng, J. (2016). Stacked hourglass networks for human pose estimation. In B. Leibe, J. Matas, N. Sebe, & M. Welling (Eds.), Computer vision – ECCV 2016 (pp. 483–499). Springer International Publishing.
- Pollio, V., Morgan, M. H., & Warren, H. L. (1914). Vitruvius, the ten books on architecture. Harvard University Press.
- Redmon, J., & Farhadi, A. (2018). Yolov3: An incremental improvement.
- Ren, S., He, K., Girshick, R., & Sun, J. (2017, June). Faster r-cnn: Towards real-time object detection with region proposal networks. In IEEE Transactions on Pattern Analysis and Machine Intelligence. IEEE.
- Sachs, L. (2013). Angewandte statistik. Springer Berlin Heidelberg.
- Samkari, E., Arif, M., Alghamdi, M., & Al Ghamdi, M. A. (2023). Human pose estimation using deep learning: A systematic literature review. Machine Learning and Knowledge Extraction, 5(4), 1612. https://doi.org/10.3390/make5040081
- Sandler, M., Howard, A., Zhu, M., Zhmoginov, A., & Chen, L.-C. (2018). Mobilenetv2: Inverted residuals and linear bottlenecks. In Proceedings of the IEEE conference on computer vision and pattern recognition (pp. 4510–4520). IEEE.
- Sun, K., Xiao, B., Liu, D., & Wang, J. (2019). Deep high-resolution representation learning for human pose estimation. In Proceedings of the IEEE conference on computer vision and pattern recognition (pp. 5693–5703). IEEE.
- Thiersch, A. (1904). Architektonische composition: Allgemeine Grundzüge. Number pkt 4,t. 1,nr 3 in Architektonische Composition: Allgemeine Grundzüge.
- Wei, S.-E., Ramakrishna, V., Kanade, T., & Sheikh, Y. (2016, June ). Convolutional pose machines. In Proceedings of the IEEE conference on computer vision and pattern recognition (CVPR). IEEE.
- Xiao, Y., Yu, D., Wang, X., Lv, T., Fan, Y., & Wu, L. (2020, April). Spcnet:spatial preserve and content-aware network for human pose estimation.
- Xie, S., Girshick, R., Dollar, P., Tu, Z., & He, K. (2017, July). Aggregated residual transformations for deep neural networks. In Proceedings of the IEEE conference on computer vision and pattern recognition (CVPR). IEEE.
- Yu, C., Xiao, B., Gao, C., Yuan, L., Zhang, L., Sang, N., & Wang, J. (2021). Lite-hrnet: A lightweight high-resolution network.
- Zhang, F., Zhu, X., Dai, H., Ye, M., & Zhu, C. (2020, June). Distribution-aware coordinate representation for human pose estimation. In Proceedings of the IEEE/CVF conference on computer vision and pattern recognition (CVPR). IEEE.
- Zhang, X., Zhou, X., Lin, M., & Sun, J. (2018, June). Shufflenet: An extremely efficient convolutional neural network for mobile devices. In Proceedings of the IEEE conference on computer vision and pattern recognition (CVPR). IEEE.
- Zheng, C., Wu, W., Chen, C., Yang, T., Zhu, S., Shen, J., Kehtarnavaz, N., & Shah, M. (2023, July 3). Deep learning-based human pose estimation: A survey. arXiv.org.