
ABSTRACT
Composting provides a sustainable method of processing biodegradable waste but is often contaminated with plastic. We quantified and characterised microplastics in air and compost samples from an industrial aerobic green waste composting facility in England. Compost samples were taken at different stages of the process; air samples were taken onsite, upwind, and downwind. Microplastics were found in compost from all stages of the process at levels comparable to those reported for marine sediments; higher concentrations were found in the screening stages of the composting process (mean 9.0 (IQR: 7.1) and 9.0 (IQR: 7.4) MPs 5 g-1 (dw), for 30 mm and 10 mm screened material, respectively). Airborne microplastics were found onsite (32–49 MP m−3), upwind (1 MP m−3) and downwind (3 MP m−3). Composting facilities represent a potential source of microplastics and point of entry to the wider environment. Further investigation into other sites and processes is warranted.
1. Introduction
By 2025, municipal solid waste (MSW) generation across the globe is predicted to almost double from 1.3 billion to 2.2 billion tonnes per year [Citation1]. Therefore, waste management is becoming increasingly important. Composting provides a sustainable method of processing biodegradable waste, although due to improper waste separation, organic waste often contains plastic litter [Citation2,Citation3]. Due to relatively high temperatures experienced in compost heaps, combined with biodegradation and mechanical abrasion of material during the composting process, contaminating macroplastics (>5 mm in size) may fragment into smaller particles known as microplastics (MPs).
MPs, here defined as plastic particles with a largest dimension measuring <1 mm [Citation4], predominantly arise from macroplastics due to biotic and abiotic processes (e.g. mechanical abrasion, UV radiation) [Citation5]. The sources, pathways, and accumulation of MPs in terrestrial environments have recently started receiving attention. Literature suggests that soils are MP sinks [Citation6] with sources including; application of biosolids or sewage sludge as soil conditioner, sewage irrigation, plastic film mulching, fertilizer and pesticide packaging wastes, and the deposition of airborne MPs into terrestrial ecosystems [Citation3,Citation6]. Compost has recently been highlighted as a prime source of MPs in agricultural environments [Citation7,Citation8].
This study aims to examine MP emissions from an industrial composting facility in the UK. The concentrations, sizes, morphologies and compositions of MPs in (i) bulk organic material from different stages of the composting process and (ii) pilot air samples taken onsite, upwind and downwind of a composting facility were assessed. This is the first study in England to examine whether compost is a point of entry of MPs into the wider environment, and we believe this to be the first study worldwide to examine whether airborne MPs are present in the vicinity of a composting facility.
2. Materials and methods
2.1. Study site
Fieldwork was conducted at a green waste composting facility in Southern England. The facility receives waste from local authorities that is often contaminated with plastic (personal communication, 2017Footnote1). The facility is permitted to process up to 25,000 tonnes of organic green waste per year, and produces compost screened to 30 mm and 10 mm for agricultural and horticultural uses, respectively.
2.2. Sampling
Sample collection was conducted on the 27th of June (visit 1), 12th of July (visit 2), and 2nd of August 2018 (visit 3).
2.2.1. Compost sampling
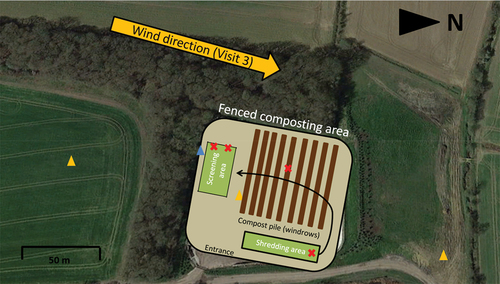
Compost samples were taken (visit 1) from the piles of organic waste at different stages of the compost process; post-shredding, turning and post-screening (30 mm (A) and 10 mm (B)) compost stages (). To allow a consistent approach to allow inter-pile comparison, samples were taken at approximately 1 m high and 10 cm below the surface of each compost pile using a metal spoon. They were collected and stored in clean glass jars with metal lids. They were stored in the dark at 4°C until further processing.
Figure 1. Compost (crosses) and air (triangles) sampling locations at the composting facility during visit 1 (red), 2 (blue) and 3 (orange). The black arrow denotes the chronological steps of the composting process. Aerial background image from Google earth.
2.2.2. Air sampling
Air sampling was conducted during visits 2 and 3 using a SKC Deployable Particulate Sampler (SKC Inc, PA, U.S.A.) with a PM10 sampling head, at a height of 1.8 m and a flow rate of 10 L min−1. Silver membrane filters (1.2 µm pore size, 47 mm diameter, Sterlitech, U.S.A.) were used, with 37 mm diameter aluminium discs acting as an impaction substrate. Both substrates were pooled together for analysis, collectively sampling Total Suspended Particulates. During visit 2, the sampler was fixed to a fence 5 m downwind of screening activity for three consecutive two-hour samples. Sampling duration was determined by a trial (visit 1 - , Appendix A). During visit 3, the sampler was mounted to a tripod and used to take three samples at; (i) ~100 m upwind of activities (background), (ii) as close as practicably possible to activities (~5 m downwind), and (iii) ~100 m downwind of activities (, Appendix A). After sampling, filters were stored in glass petri dishes until further processing. The weather was similar and consistent during all three sampling days and was dry, warm and sunny, with mild breezes (, Appendix B). Weather conditions were regularly monitored using a Kestrel™ 3000 environmental meter during air sampling to ensure the sampler was downwind (or upwind for visit 3, sample (i)).
2.3. Sample processing
2.3.1. Compost samples
Samples were dried at 60 °C for 24 h, left to cool to ambient temperature, sieved (8 mm) and transferred to glass jars. Material >8 mm was discarded. Four subsamples (5 g) were taken from each sample. To reduce the high organic matter content, two digestion steps were implemented; (i) 5 g of dried sample was mixed with 100 mL of 10% potassium hydroxide (KOH) (60 °C for 24 h) [Citation9], cooled, filtered through a 45 μm sieve, and oven-dried at 60°C; (ii) remaining material was mixed with 20 mL of Fenton’s reagent (Fe2+ solution and 20 mL of 30% H2O2) (75°C for 30 min) [Citation10]. If organic material was still visible, a further 10 mL of 30% H2O2 was added until no or minimal organic material was observed. The sample was then vacuum filtered through a silver membrane filter (1.2 μm), dried at room temperature and stored in glass petri dishes in a cool, dark place until analysis.
2.3.2. Air samples
Silver membrane filters and corresponding aluminium discs were pooled and extracted via vortexing in 10 mL of Fenton’s reagent. Ten millilitres of 30% H2O2 was added (as above) and the pooled sample was vacuum filtered onto its original silver membrane filter.
2.4. MP analysis
2.4.1. Microscopy
To highlight potential MP particles, samples were stained with Nile Red (NR) [Citation11]. A 1 mg mL−1 stock solution of NR was prepared in acetone and diluted with n-hexane to a concentration of 10 μg mL−1. Each filter was incubated with 10 mL of filtered NR solution for 30 min on a vacuum filtration unit and the NR subsequently vacuum filtered. Filters were screened using a fluorescence microscope (OLYMPUS, U-RFL-T, ex.: 400–440, em.: 475 nm). Fluorescing particles were considered a suspected MP if they had no visible cellular or organic structures under bright field. Suspected MPs were counted and classified morphologically as fragments (flattened and shard like), films (transparent and thin), foam (sponge-like texture), granules (rounded), and fibres (long, thin and curved with an equal width throughout). As NR is not plastic-specific, a subsample of suspected MPs per filter were further analysed. Due to time restrictions, for each sample, the first 10 non-fibrous and three fibrous suspected MPs encountered per sample were marked directly on the filter using a pencil and photographed using a camera coupled to the fluorescence microscope. Retrospective size approximation was conducted using Image J software by measuring the longest dimension.
2.4.2. FTIR micro-spectroscopy
The marked suspected MPs were analysed using a PerkinElmer AutoImager FT-IR microscope (limit of detection ~20 µm). Of the compost samples, 14–71% of the suspected non-fibrous MPs and 12–43% of the fibrous MPs were analysed depending on the total suspected MP abundance per sample. Similarly, of the air samples, 10–100% of suspected non-fibrous MPs and 21–100% of suspected fibrous MPs were analysed. IR spectra were recorded with Spectrum v5.3.1 software within the wavenumber range of 400 to 4,400 cm−1 at 16 scans and a resolution of 4 cm−1. Spectra were matched using a database (KnowItAll spectral library, Bio-Rad, UK). Identification was achieved using a minimum hit quality index (HQI) of 90% and by examining the matching peak wavenumber positions; HQI < 90% were classed as non-identifiable. The percent of suspected MPs identified as plastic by FT-IR was used to correct the total suspected MP count per sample. Only size data for suspected MPs confirmed to be of plastic composition from the FTIR micro-spectroscopy analysis are reported. Three MPs (two polyethylene (PE) and one polystyrene (PS)) were found in the procedural blanks and were deducted from each sample (by count and polymer type); therefore, reported results are conservative estimates. Quantities are expressed as n MP particles 5 g−1 dry weight (dw) for compost and n MP particles m−3 for air samples. Averages are reported as median (interquartile range (IQR)).
2.5. Mitigating contamination
Throughout sample collection, processing and analysis, plastic contamination was mitigated as described in Appendix C.
3. Results and discussion
3.1. Compost samples
On average, 29% of the non-fibrous (fragments, films, foams and beads/granules) suspected MPs in compost were spectroscopically identified as plastic, 2% were cellulose and 64% had an HQI < 90% and were therefore classified as ‘non-identifiable’. Five percent of particles were classified as polystyrene sulfonic acid (), which is an acid used in water softening treatment. This was excluded from the MP count; researchers should be aware not to misclassify it as ‘polystyrene’. Of the fibres suspected to be MPs, 31% were found to be cellulose based, whilst the remaining 69% were ‘non-identifiable’ (HQI < 90%). From herein, the results are in respect to petrochemical-based, non-fibrous MPs >20 µm, since plastic fibres were not knowingly observed and therefore excluded.
3.1.1. Abundance and size
Concentrations were highest in the final screening stages A (30 mm) and B (10 mm), median 9.0 (IQR: 7.1) and 9.0 (IQR: 7.4) MPs 5 g−1 (dw), respectively) (), suggesting that the composting process may cause macroplastics to degrade, forming MPs. When extrapolated to equivalent units (1,420 and 1,480 MPs kg- (dw) for screening stage A and B, respectively), these concentrations are similar to those found previously in China [Citation8], but two orders of magnitude greater than previously found in Germany [Citation3]. This could be due to differences in methodology (two digestion steps, finer sieve and NR in this study) and feedstock composition.
Figure 2. Microplastic (MP) abundance, size and composition (left to right) in compost (top) and air (bottom). (a) the average concentration of MPs in the 4 compost samples analysed (n 5 g−1 dry weight); (b) relative frequency (%) of MP size (µm) in compost; (c) the relative abundance of plastic polymers for the 40 confirmed MP in compost collected at each stage of the process (shredding, turning, screening 30 mm, and screening 10 mm); (d) the concentration of airborne MP (n m−3); (e) relative frequency (%) of MP size (µm) in air (total 1200 L sampled); (f) the relative abundance of plastic polymers for the 29 confirmed MP in air at locations upwind, on-site, and downwind of the industrial composting site. Box and whisker plot shows median, 25th and 75th percentiles and 5th to 95th percentile. PA = polyamide; PE = polyethylene; PET = polyethylene terephthalate; PP = polypropylene; PS = polystyrene; PU = polyurethane; PVA = polyvinyl alcohol; and PVC = polyvinylchloride.
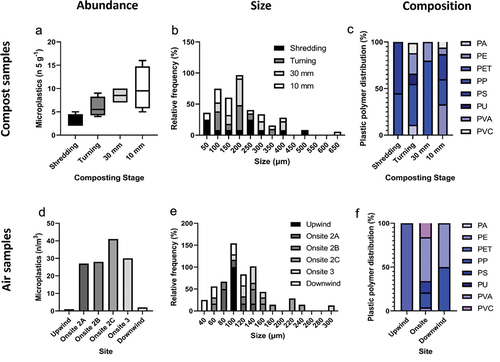
The median size of MPs from the shredding, turning and screening A and B stages were 230.5 µm (IQR: 181.3 µm), 186.9 µm (IQR: 83.2 µm), 201.0 µm (IQR: 98.0 µm) and 157.1 µm (IQR: 165.5 µm) in diameter, with minimum sizes of 45.7, 109.6, 48.0 and 77.7 µm in diameter, respectively ().
3.1.2. Morphology and composition
The turning and screening B stages were the most diverse, with five polymers found in each (). Polypropylene (PP) and polystyrene (PS) were predominant; these represent some of the most produced and used plastics which likely contaminated green waste due to improper household disposal. Styrene-based polymers were also most abundant in a study conducted previously in Germany [Citation3], but not in China [Citation8], which likely reflects different waste disposal practices or patterns in material use. Morphological distributions and example micrographs and spectra are provided in , Appendix D and , Appendix F respectively.
Our results indicate that PVA, which is perceived to be biodegradable during industrial composting processes, was present in the end product (Screening stage A and B), comprising 20% and 7% of detected microplastic, respectively (). It also comprised on average 33% of microplastic detected in air, with an average 16 microplastics m−3 onsite and 1.25 microplastics m−3 downwind only. Biodegradable plastics are viewed as a potential solution to issues caused by plastic waste, but there is still uncertainty as to whether innovative plastic types are indeed more sustainable than alternatives. This was considered in a UK Government call for evidence [Citation12], which surmised concerns regarding the extent to which so-called biodegradable and compostable plastics actually biodegrade. Respondents raised concerns that standards (including BS EN 13,432:2000) [Citation13] were not suitable for industrial composting as the standards are not aligned to industrial practise, and whether it would be possible to produce compost in accordance to PAS100:2018 [Citation14] if feedstocks included more biodegradable plastic. Further research is needed in this area.
Composting facilities may therefore represent a significant MP source and vehicle of entry to the environment, should feedstocks be initially contaminated. The contamination of biowaste and subsequent application to arable land is not the only pathway for microplastics to reach terrestrial soils; sewage sludge/biosolid application and atmospheric deposition also contribute. Agricultural soils may therefore be a substantial MP sink. More work is needed to understand potential risk across different sites and subsequent impacts on soil health, crop quality and biota [Citation6,Citation15].
3.2. Air samples
On average, 39% of the non-fibrous suspected MPs in air were chemically identified as plastic, whilst 34% were cellulose and 26% were non-identifiable. About 0.8% were identified as polystyrene sulfonic acid. Of the fibrous suspected MPs, 11% were found to be cellulose based, whilst the remaining 89% were non-identifiable. From herein, results are in respect to petrochemical-based non-fibrous MPs.
3.2.1. Abundance and size
Higher concentrations of MP were observed onsite compared with the downwind and upwind concentrations (). Onsite, the concentrations of MPs ranged from 32 to 49 MPs m−3, while concentrations of 3 and 1 MPs m−3 were found in downwind and upwind air samples, respectively (). This is comparative to other studies in urban and rural environments [Citation16]. This suggests that MPs become airborne during composting activities, but concentrations deplete rapidly from source for the particle sizes observed. More work is required to confirm this, incorporating smaller physical and aerodynamic sizes.
The size of the MP in the upwind sample was 96.21 µm. The median sizes of MPs in air samples onsite and downwind were; 132.24 µm (IQR: 54.4 µm) and 89.37 µm (IQR = 49.6 µm) with smallest sizes of 63.7 µm and 47.1 µm, respectively (). Due to the limits of detection in this study, further work to monitor whether these particles contaminate thoracic and respirable size-fractions of particulate air pollution onsite, where concentrations are higher, is needed to determine whether occupational exposure is a concern. Increased respiratory symptoms and/or lung function decline have been reported in workers at composting facilities due to bioaerosol exposure [Citation17]. Whether MPs contribute to these health effects is unknown and the potential for MPs to act as a vehicle for bioaerosols should not be overlooked.
3.2.2. Morphology and composition
Five types of polymer were found in the on-site samples, two types in the downwind sample, and one type in the upwind sample (). The polymer composition on-site consisted of 50% polyvinyl alcohol (PVA), 17% PP, 17% polyvinylchloride (PVC), 13% PS, and 4% polyethylene (PE). Most plastic particles found downwind were PP (50%) and PVA (50%). The only type of plastic found upwind was polyethylene terephthalate (PET). The polymers found in the air onsite were also found in the compost samples, and as PP and PVA were found downwind and not upwind, these results suggest they have dispersed from the composting facility. As previously discussed, PVA is perceived to be biodegradable within industrial composting processes, escape via air will lead to environmental contamination, where it will persist due to sub-optimal conditions for biodegradation.
PET was only found in the sample taken upwind from the composting facility and was not found in compost, suggesting it originated from another source or that it might also be present onsite but was not identified. Although little is known about the sources of airborne MPs, some researchers suggest that they are emitted from landfill, city dust, synthetic textiles, construction material and household dust [Citation18]. Composting and agriculture also need to be considered. The predominant shape found in all air sampling locations were fragments (Appendix G). Example micrographs and spectra are provided in Appendix E and F, respectively.
This study presents findings on MP contamination in aerobic green waste compost destined for agricultural and horticultural applications. High concentrations of MPs were found in the composting samples, comparable with sediments in marine environments [Citation19]. Separation of waste at composting facilities is theoretically possible via screening waste and manual picking larger items of plastic litter out. However, this is labour and time extensive, and not economically viable for the site. Therefore, highlighting the need for better waste separation at homes and education of the public to support this. The increasing number of composting facilities warrants further research into the organic waste fraction as a pathway for MPs to enter the environment. Moreover, novel data on airborne MP emissions from a composting facility indicates the potential for dispersion and deposition into the wider environment. Overall, our findings provide further evidence supporting that soils are a substantive sink of MPs in the environment, specifically from compost and air, ultimately building on our understanding of the ‘global MP cycle’.
Acknowledgments
This study was funded by the Chartered Institution of Wastes Management (CIWM) via their Masters support programme. Philippa Douglas’ time was part-funded by the Medical Research Council (MRC)-Centre for Environment and Health via an early career research fellowship. Stephanie Wright’s time was funded by the MRC (MR/R026521/1). This work was partly supported by the National Institute for Health Research (NIHR) Health Protection Research Unit (HPRU) in Environmental Exposures and Health (NIHR200880) at Imperial College London.
The authors thank Kathy Nicholls from the Environment Agency (EA), Tina Benfield from CIWM, and Jenny Grant from the Renewable Energy Association (REA) for helping us identify a composting facility to conduct our sampling, and the composting facility staff for their hospitality and help when we conducted the sampling. The authors thank Emma Marczylo from the UK Health Security Agency (UKHSA) for allowing us to use a portable weather monitor (Kestrel™ 3000).
The views expressed are those of the authors and not necessarily those of CIWM, MRC, NIHR, EA, REA, UKHSA or the Department of Health and Social Care.
Disclosure statement
The work presented in this manuscript adheres to the ethical and legal requirements of the study country, the UK. The authors confirm that they have prepared the complete text. The authors of this manuscript do not have any conflicts of interest.
Additional information
Funding
Notes
1. Personal communications with the Chartered Institute of Wastes Management (CIWM) and the Environment Agency, May–June 2017.
References
- Hoornweg D, Bhada-Tata P. What a waste. A global review of solid waste management. Urban Development Series Knowledge Papers. 2012;15:1–98.
- (ADBA), A. D. a. B. A.; (REA), R. E. A. Joint position on keeping plastics out of digestate and compost.
- Weithmann N, Möller JN, Löder MGJ, et al. Organic fertilizer as a vehicle for the entry of microplastic into the environment. Sci Adv. 2018;4(4):4. doi: 10.1126/sciadv.aap8060
- Hartmann NB, Huffer T, Thompson RC, et al. Are we speaking the same language? Recommendations for a definition and categorization framework for plastic debris. Environ Sci Technol. 2019;53(3):1039–36. From NLM Medline. doi: 10.1021/acs.est.8b05297
- Klein S, Dimzon IK, Eubeler J et al. Analysis, Occurrence, and Degradation of Microplastics in the Aqueous Environment.Freshwater Microplastics. 2017;58: 51–67.
- Yu H, Zhang Y, Tan W, et al. Microplastics as an emerging Environmental pollutant in agricultural soils: effects on ecosystems and human Health. Front Environ Sci. 2022;10. doi: 10.3389/fenvs.2022.855292
- Gui J, Sun Y, Wang J, et al. Microplastics in composting of rural domestic waste: abundance, characteristics, and release from the surface of macroplastics. Environ Pollut. 2021;274:116553. doi: 10.1016/j.envpol.2021.116553 From NLM Medline.
- Vithanage M, Ramanayaka S, Hasinthara S, et al. Compost as a carrier for microplastics and plastic-bound toxic metals into agroecosystems. Curr Opin Environ Sci Health. 2021;24. doi: 10.1016/j.coesh.2021.100297
- Cole M, Webb H, Lindeque PK, et al. Isolation of microplastics in biota-rich seawater samples and marine organisms. Sci Rep. 2014;4(1):4528. doi: 10.1038/srep04528 From NLM Medline. Nuelle, M. T.; Dekiff, J. H.; Remy, D.; Fries, E. A new analytical approach for monitoring microplastics in marine sediments. Environ Pollut 2014; 184, 161-169. doi: 10.1016/j.envpol.2013.07.027. From NLM Medline.
- Masura J, Baker J, Foster G, et al. Laboratory methods for the analysis of microplastics in the marine Environment: recommendations for quantifying synthetic particles in waters and sediments. NOAA Technical Memorandum. 2015:NOS-OR&R–48.
- Meyers N, Catarino AI, Declercq AM, et al. Microplastic detection and identification by Nile red staining: towards a semi-automated, cost- and time-effective technique. Sci Total Environ. 2022;823:153441. doi: 10.1016/j.scitotenv.2022.153441 From NLM Medline. Maes, T.; Jessop, R.; Wellner, N.; Haupt, K.; Mayes, A. G. A rapid-screening approach to detect and quantify microplastics based on fluorescent tagging with Nile Red. Sci Rep 2017; 7, 44501. doi: 10.1038/srep44501. From NLM PubMed-not-MEDLINE.
- HM Government. Standards for bio-based, biodegradable, and compostable plastics. Summary of responses to the call for evidence and Government response. Crown Copyright; 2021. https://assets.publishing.service.gov.uk/media/606eb6518fa8f573570f6a81/standards-biobased-biodegradable-compostable-plastics.pdf.
- 13432:2000, B. E. Packaging. Requirements for packaging recoverable through composting and biodegradation. Test scheme and evaluation criteria for the final acceptance of packaging; 2007.
- Knowledge, B. PAS 100:2018. 2018.
- de Souza Machado AA, Lau CW, Till J, et al. Impacts of microplastics on the soil biophysical Environment. Environ Sci Technol. 2018;52(17):9656–9665. doi: 10.1021/acs.est.8b02212 From NLM Medline.
- Dris R, Gasperi J, Rocher V, et al. Microplastic contamination in an urban area: a case study in Greater Paris. Environ Chem. 2015;12(5):592. doi: 10.1071/EN14167 Yuan, Z.; Pei, C.; Li, H.; Lin, L.; Liu, S.; Hou, R.; Liao, R.; Xu, X. Atmospheric microplastics at a southern China metropolis: Occurrence, deposition flux, exposure risk and washout effect of rainfall. Sci Total Environ 2023; 869, 161839. doi: 10.1016/j.scitotenv.2023.161839 From NLM Medline.
- Pearson C, Littlewood E, d Douglas, et al. Exposures and health outcomes in relation to bioaerosol emissions from composting facilities: a systematic review of occupational and community studies. J Toxicol Environ Health B Crit Rev. 2015;18(1):43–69. doi: 10.1080/10937404.2015.1009961 From NLM Medline. Robertson, S.; Douglas, P.; Marczylo, E.; Jarvis, D. Bioaerosol exposure from composting facilities and health outcomes in workers and in the community: A systematic review update. International Journal of Hygiene and Environmental Health 2019; 222 (3), 364-386.
- Gasperi J, Wright SL, Dris R, et al. Microplastics in air: are we breathing it in? Curr Opin Environ Sci Health. 2018;1:1–5. doi: 10.1016/j.coesh.2017.10.002 Prata, J. C.; Castro, J. L.; da Costa, J. P.; Cerqueira, M.; Duarte, A. C.; Rocha-Santos, T. Airborne Microplastics. In Handbook of Microplastics in the Environment, 2021; pp 1-25.
- Kane IA, Clare MA, Miramontes E, et al. Seafloor microplastic hotspots controlled by deep-sea circulation. Science. 2020;368(6495):1140–1145. doi: 10.1126/science.aba5899
Appendix A
- Information on composting and air sampling
Table A1. Compost and air sampling details.
Appendix B
– Meteorological conditions
Table B1. Meteorological conditions on the three sampling days.
Appendix C
– Mitigating Contamination
The use of plastic materials was avoided where possible. Researchers stood downwind of samples during collection. All laboratory equipment was rinsed thoroughly with ultrapure water three times before use. All reagents, including Nile Red working solution, were filtered prior to use and all sample preparation was conducted under a fume hood (switched off), to minimise exposure to the open laboratory air. Samples and equipment were covered with aluminium foil wherever possible to minimize periods of exposure. Personal protective equipment (100% cotton lab coats and nitrile gloves) was always worn. Procedural blanks were run in parallel with sample processing steps (sieving, weighing, drying, filtering and digestion with Fenton’s reagent) to assess the efficacy of contamination mitigation.
Appendix D
– Information on morphological distribution of microplastic (MP) found in compost samples
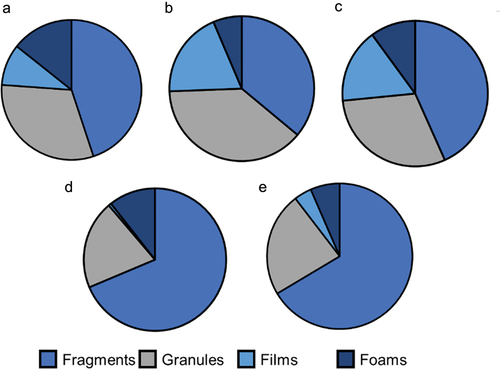
Fragments and films were the most common MP shape (collectively comprising > 70%) found at all stages; granules and foams were also observed at all stages. The lowest percentage of granules was found in stage screening B (10 mm) (Figure SD1).
Figure D1. The morphological distribution of MPs found in compost at a) shredding, b) turning, c) screening a (30 mm), d) screening B (10 mm), and e in air on-site.
Appendix E
– Example micrographs of MPs identified in compost and air samples
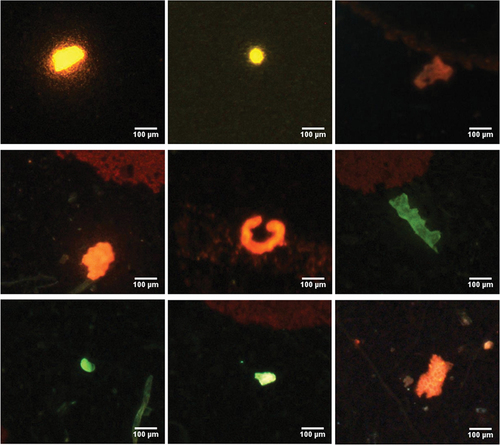
Figure E1. Example micrographs of some of the microplastics identified in compost and air samples and particles identified as polystyrene sulfonic acid. From left to right and top to bottom: downwind air sample, downwind air sample, on-site air sample, on-site air sample, upwind air sample, shredding stage compost sample, turning stage compost sample, turning stage compost sample, screening stage compost sample. Corresponding spectra are in Figure SF3. Scale bar = 100 µm.
Appendix F
– Example spectra of MPs identified in compost and air samples
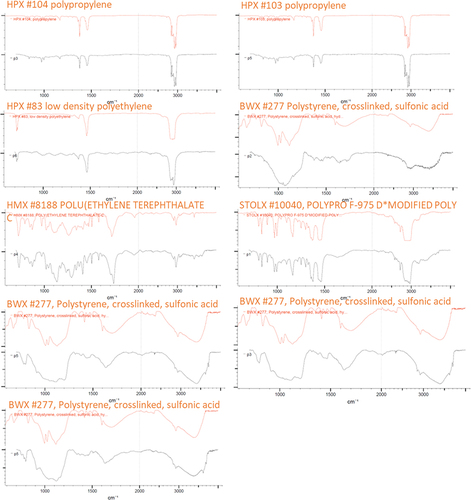
Figure F1. Example spectra of the MPs and polystyrene sulfonic acid particles identified in compost and air samples as presented in Figure SD1. From left to right and top to bottom: downwind air sample (polypropylene, HQI 98.14), downwind air sample (polypropylene, HQI 95.95), on-site air sample (low-density polyethylene, HQI 97.70), on-site air sample (polystyrene, HQI 92.27), upwind air sample (polyethylene terephthalate, HQI 90.92), shredding stage compost sample (polypropylene, HQI 95.88), turning stage compost sample (polystyrene, HQI 93.56), turning stage compost sample (polystyrene, HQI 93.35), screening stage compost sample (polystyrene, HQI 92.19). HQI = hit quality index. Scale bar = 100 µm.
Appendix G
– Information on morphological distribution of MP found in air samples
The predominant shape found in all air sampling locations was fragments. An average 66% of MPs measured on-site were fragments, 23% were films, 4% were pellets or granules and 6% were foams. All particles found downwind and upwind were fragments.
References for the Appendices
MetOffice (2006): MIDAS: UK Hourly Weather Observation Data. NCAS British Atmospheric Data Centre, 8thof December 2023. https://catalogue.ceda.ac.uk/uuid/916ac4bbc46f7685ae9a5e10451bae7c