
 ?Mathematical formulae have been encoded as MathML and are displayed in this HTML version using MathJax in order to improve their display. Uncheck the box to turn MathJax off. This feature requires Javascript. Click on a formula to zoom.
ABSTRACT
This study has undertaken an analysis of phosphorus fertiliser use in three provinces from 2010 to 2020: Sichuan, Hubei and Jiangsu along the Yangtze River basin. It was revealed that phosphorus fertiliser application rate of Hubei experienced the most significant reduction, and the application rate of Sichuan was the lowest, but its yield of different crops hardly decreased. The yield for all food crops by Jiangsu was highest, indicating the importance of strong economic development on sustainable agriculture practice. Cd input for Hubei was highest. In Jiangsu, Xuzhou, Lianyungang, and Suqian are the three cities applying the most phosphorus fertiliser, which also happen to be the cities with lowest GDP. The findings of this research could provide useful insights into the current practice of phosphorus fertiliser application in the main rice planting regions of China and facilitate the optimal use of global sustainable intensification of agricultural systems.
Introduction
Phosphorus management is being largely ignored in the food and environmental agendas of many countries, and this has put food security at jeopardy [Citation1]. Worldwide phosphorus losses from land to freshwater bodies have doubled in the last century and will continue to rise [Citation1]. Currently, ~14 million tons of phosphorus are lost to global aquatic ecosystems every year, causing a multitude of problems, such as eutrophication [Citation2]. Enhanced eutrophication will result in a substantial increase in methane emissions over the next century, and the amount of increased methane emissions would be equivalent to ~ 33% of annual carbon dioxide emissions from fossil fuels, as revealed in a study by Beaulieu et al. [Citation3]. This indicates that reducing phosphorus losses from agricultural systems is not only important to improve global phosphorus sustainability but also important to mitigate climate change.
Being one of the most populous country, self-sufficient food supplying system is critical to China’s food security. China has thus been making continuous efforts to improve its grain yield. Grain yield per hectare has increased from 1029 kg∙ha−1 in 1949 to 6316 kg∙ha−1 in 2021, and output of grain per capita has correspondingly increased from 209 kg/person to 483 kg∙person−1. However, this comes at a cost of excessive application of fertilisers [Citation4,Citation5]. In 2020, China consumed approximately 9 million tons of phosphorus fertilisers in agriculture, and this accounts for 20.6% of the total phosphorus fertiliser consumption globally [Citation6].
Improper or overuse of chemical fertilisers has resulted in accumulation of heavy metals such as cadmium (Cd) in soil, which could potentially enter the food chain, and jeopardize the well-being of animals, plants, and humans [Citation5,Citation7]. Accumulation of Cd in soil mainly comes from phosphorus fertilisers (PF), produced from phosphate-rich sedimentary rocks which is rich in cadmium [Citation8–10]. The International Fertiliser Development Centre (IFDC) analysed the Cd content of 35 types of phosphate-rich sedimentary rocks from 20 different countries and revealed that the average Cd concentration was 21 mg∙kg−1, which was approximately 69 times higher than that of non-phosphorus rock [Citation11]. Schroeder and Balassa [Citation12] were the scholars who first revealed that phosphorus fertiliser could result in the increase of Cd content both in agricultural soil and the crops. Six and Smolders [Citation13] also reported that Cd in cultivated soil mostly resulted from application of PF since the mid-1960s. It was reported that input of Cd from PF would contribute 85% to the total Cd content in soil in France within a century if the current farming practice continued [Citation7]. In Europe, it was also estimated that 45% of the Cd input resulted from mineral PF [Citation14].
In China, cadmium is one of the most concerned soil contaminants [Citation15–17], and approximately 16.67% of farmland soil in China was contaminated by Cd [Citation15]. Cd content in agricultural soil is particularly high in some provinces, including Hunan, Hubei, Sichuan and Anhui, due to mineral exploitation activities [Citation18,Citation19].
Since cadmium (Cd) has a high soil-to-plant transference rate, so exposure to Cd through the food-chain contamination is a public health concern [Citation20,Citation21]. Dietary intake, especially from plant-derived foods, such as rice and vegetables, is the main pathway of exposure for the general non-smoking human population [Citation22–25]. The outbreak of the Itai-Itai disease in Japan in the 1950s was caused by consumption of Cd-contaminated rice and drinking water [Citation26,Citation27]. Frequent occurrence of Cd toxicity in Chinese rice caused widespread public concern and anxiety. More than half of the global population live on rice, and Cd-contaminated grains pose a major threat to their health [Citation28,Citation29]. Therefore, Cd pollution in the environment and human diet is a persistent problem and will continue to be a health burden for humans, especially developing countries.
Reducing inputs of Cd into agricultural soil is obviously an effective strategy to ensure better soil and food security and safety [Citation30,Citation31]. To address the issue of Cd pollution caused by the excessive application of PF in agricultural soil, the Ministry of Agriculture of the People’s Republic of China issued ‘The action plan for zero growth of fertiliser use by 2020’ (‘Action Plan’ hereinafter) on 17 February 2015 [Citation32]. This plan aimed to reduce the intensity of chemical fertiliser usage without compromising grain yield by 2020, with the ultimate goal of keeping the annual growth rate from 2015 to 2019 under 1%, and to reach zero growth by 2020 in PF consumption across China [Citation33]. In order to determine the implementation impact of this active plan, this study has undertaken a detailed analysis of the PF application in three provinces along the Yangtze River Basin from both provincial and city-level perspectives.
Significant regional differences in resource and environmental conditions, agricultural development level, and socio-economic status have resulted in remarkable differences in fertiliser application intensity and Cd input [Citation34–36]. Approximately 98% of China’s rice planting area is located in the Northeast, the Yangtze River Basin, and the Southeast [Citation37,Citation38]. Among which, Yangtze River Basin is the largest rice planting region, accounting for more than half of China’s rice planting area, as well as total rice yield [Citation39]. Cd soil content in the Yangtze River Basin is thus critically important to ensure food safety. Therefore, three provinces along the Yangtze River: Sichuan Province (upstream), Hubei Province (midstream), and Jiangsu Province (downstream) are selected in this study, to analyse the application of PF and chemical fertiliser between 2010 and 2020 from both provincial and city perspectives. Application of PF, as well as the subsequent input of Cd was examined for the three provinces. In addition, the application of PF for each city within each province were also analysed in order to identify cities with higher PF consumption rates, which in turn could provide good insights into further management priorities. In addition, being one of the largest rice planting regions, as well as the most significant economic zone of China, findings of this research could be of good value to the sustainable use and management of phosphorus fertiliser in China. To the best of our knowledge, very few studies of phosphorus fertiliser use have been done at the time of writing this paper.
Study area, methodology and data sources
Study area
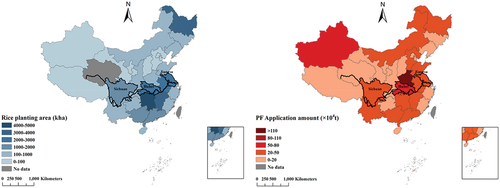
The study area consists of three provinces along Yangtze River Basin (): Sichuan Province (upstream), Hubei Province (midstream), and Jiangsu Province (downstream). These three provinces are not only the main rice planting region of China but also have relatively high PF application quantity, especially Hubei province. The data used to produce are provided in Table S1.
Figure 1. Rice planting area and phosphorus fertiliser application quantity across China from 2010 to 2020.
Methods
Four equations are used to calculate the PF application rate, annual input of Cd in soil, and target hazard quotient, respectively. Equations (1)-(2) are based on the methods adopted by Li et al. [Citation40], and Equation (3)-(4) are based on [Citation41] and Yang et al. [Citation16].
(1) The PF application rate
R is the rate of PF application (kg∙ha−1), TP is the total quantity of PF application (net quantity of PF application) (kg), A is the total planting area of different crops (ha), and i, j, k are different provinces, different years, and different crops. The total planting area of crops studied in this paper is the sum of sown areas of grain crops, cash crops and other crops.
(2) Annual input of Cd in soil
R is the annual Cd input (μg∙kg−1 soil∙a−1), Rij is the quantity of PF (kg∙ha−1), and C is the average content of Cd in PF (μg∙kg−1), W is the weight of soil, 23 × 105 (kg∙ha−1), i and j represent different provinces and years, respectively. Soil density is assumed as 1.15 g∙cm−3 and the tillage depth is 20 cm.
(3) Target hazard quotient
Target hazard quotient (THQ) is calculated to assess the potential dietary Cd health risks, for the three provinces:
EDI is the estimated daily dietary intake (mg∙ kg−1∙d−1); EF is the exposure frequency (365 days); ED is the duration of adult exposure (70 years) [Citation41]; IR is rice intake rate (μg∙d−1), which is based on the fifth China Total Dietary Survey [Citation42]; C is Cd concentration in rice (mg∙g−1); BW is the average weight of consumers (the average weight of adult men in the fifth China Dietary Survey is 63 kg [Citation43], and AT is the average time without carcinogenic effect (d), which is 70 years × 365 days [Citation41], and RfD is the oral reference dose (mg∙kg−1∙d−1), which is 0.36 μg∙kg −1 bw based on EFSA Panel on Contaminants in the Food Chain (CONTAM) [Citation44].
Sources of data
Data used in this study were mainly based on statistical yearbooks published by Sichuan, Hubei, and Jiangsu statistical bureaus (2010–2020), China Agricultural Statistical Yearbook (2010–2020), the National Bureau of Statistics, and China Phosphorus Fertiliser Industry Association. The Cd content of various phosphorus fertiliser categories from 2010 to 2020 was from research papers and reports published in China National Knowledge Infrastructure (CNKI) and Web of Science.
The PF data in this study are based on those given in the relevant statistical yearbooks, and the quantity of PF in this paper refers to the converted percentage of phosphorus pentoxide in the PF as defined by the Ministry of Agriculture and Rural Affairs of the People’s Republic of China, i.e. it equals to the PF quantity applied multiplies the conversion rate (which is typically around 12% − 56% for the proportion of phosphorus pentoxide in PF) [Citation43].
Provincial level perspective
Total planting area and PF application
Total planting area of crops, as well as the percentage of different crops for 2010–2020 for the three provinces are shown in , and the data used to produce this figure are given in Table S2 ~S4). The crops included are grain crops, cash crops and vegetables.
Figure 2. Total planting area and the proportion of different food crops for the three provinces from 2010 to 2020.
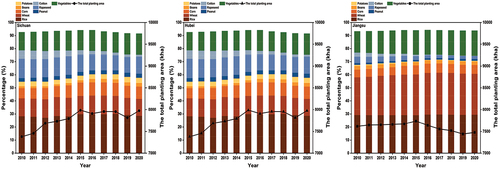
In terms of the total planting area of crops, Sichuan province has the largest planting area, and its area gradually increased from 9158.73 kha in 2010 to 9849.91 kha in 2020, indicating an increase of 7.55%. This increase was mainly due to the planting area increase for vegetables and corn. Hubei province also experienced a fairly steady increase of 8.05%, from 7380.25 kha in 2010 to 7974.44 kha in 2020; this increase was mainly caused by the increase of planting area for vegetables and corn.
Jiangsu province exhibited a very minor increase until 2015 but decreased gradually afterwards. The decrease was due to the decrease of planting area for cotton and rapeseed. In addition, Jiangsu was the only province with reduced total planting area. Yang et al. [Citation45] suggested that rapid urbanisation and industrialisation along the Yangtze River Economic Belt led to a sharp decrease in cultivated land area, particularly in downstream provinces, including Jiangsu province. Some studies have found that per capita cultivated land area in Jiangsu decreased from 0.071 ha in 2000 to 0.057 ha in 2015, which is close to the threshold value of 0.053 ha per capita set by the United Nations [Citation46].
The main grain crops for the three provinces were rice, accounting for appropriately 20% (Sichuan), 28% (Hubei) and 29% (Jiangsu), respectively, although the share (30%) by wheat was slightly higher than that for rice in Jiangsu. The planting area for vegetables for the three provinces all increased by approximately 2%-3% to 13% (Sichuan), 16% (Hubei), and 19% (Jiangsu), respectively. This indicates that vegetable consumption rate for these three provinces is increasing. For Sichuan, corn accounted for 18% of the total planting area, which was significantly higher than that for either Hubei (9%) or Jiangsu (3%) province. In addition, the share by potatoes for Sichuan was also remarkably higher than the other two provinces, and the share by rapeseed for Sichuan and Hubei was similar, around 12%.
PF application rate and the yield of grains, vegetables and cash crops for the three provinces from 2010 to 2020 are shown in . The supporting data for these two figures are provided in Table S5. It can be seen that the PF application rate for all three provinces decreased slowly from 2010 to 2015, then fairly sharply afterwards. 2016–2020 is the 13th five-year plan period; the five-year plan is China’s policy blueprint for medium-term social and economic development, the first 5-year was 1953–1957, and currently China is in the 14th (2021–2025) 5-year plan period. The reduction of PF application rate between 2010 and 2020 for the three provinces in descending order are as follows: 41.33% for Hubei, from 89.14 kg∙ha−1 to 52.30 kg∙ha−1; 33.68% for Jiangsu, from 62.66 kg∙ha−1 to 41.56 kg∙ha−1; 28.18% for Sichuan, from 53.72 kg∙ha−1 to 38.58 kg∙ha−1. It might seem like the reduction by Sichuan was the least, but its application rate was actually the lowest among the three provinces, and the PF application rate for Hubei province was the highest. This finding is consistent with the findings by Van Wesenbeeck et al. [Citation47], whose study revealed that the net surplus in kg per ha of phosphorus oxide in Hubei province was the most severe, followed by Sichuan and Jiangsu. It should be noted that the yield for all food crops (i.e. grains, vegetables, cash crops) by Jiangsu province, as shown in was highest. This indicates that Jiangsu province may be more willing and able to adopt advanced agricultural technology to increase grain yield since it is the most economically developed province of the three, this finding is consistent with the findings by Vatsa et al. [Citation48]. In order to further analyse why the yield of Jiangsu province is higher, the mechanisation rate of crop cultivation, as well as the contribution of science and technology to agriculture of the three provinces were compared (Table S6), and the comparison revealed that the mechanisation rate and the contribution of science and technology of Jiangsu province is indeed notably higher than Sichuan and Hubei province. This indicates that strong economic development could to some extent help with the advancement of sustainable agriculture practice.
Figure 3. The PF application rate for the three provinces from 2010 to 2020.
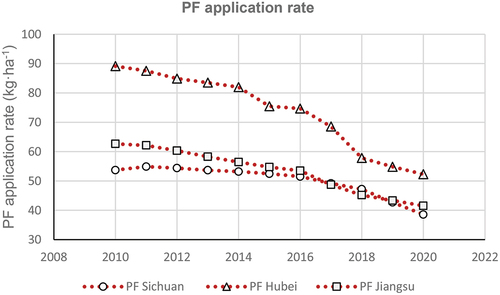
Figure 4. The yield of grains, cash crops and vegetables for the three provinces from 2010 to 2020.
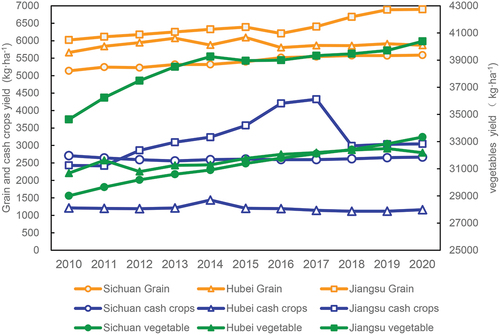
Reducing PF application rate had negligible impact on the grain yield for all three provinces, except for Hubei, for which a small decline was observed from 2014. For vegetables, a very minor yield reduction occurred in 2012 and 2020 for Hubei, and in 2015 for Jiangsu. For cash crops, the impact caused by PF application rate was most significant, especially for Hubei and Jiangsu. The cash crops yield reduced remarkably from 2015 for Hubei, and from 2018 for Jiangsu. This suggests that cash crops may be more dependent on PF application, in comparison with other crops. For Sichuan, its PF application rate was the lowest among the three provinces, and the gradual reduction in PF application rate has not caused yield reduction for most food crops, except for a very minor yield reduction of cash crops in 2016. This indicates that Sichuan has made good efforts to maintain the crops yield while reducing PF application rate at the same time. Therefore, the fairly significant impact on crops yield for Hubei province demonstrates that the linear path of take-make-use-waste-pollute mode of agricultural production is highly dependent on external inputs, such as fertiliser, and this would not only degrade soil ecosystem but also pose threat to sustainable food supply.
The notable reduction in the PF application rate for the three provinces resulted from the continuous efforts made by the Chinese government, aiming to achieve sustainable agricultural practices [Citation40,Citation49]. In 2012, the 18th National Congress of the Communist Party of China (CPC) made a new arrangement for the construction of ecological civilisation and raised ecological civilisation construction to a new height of five-sphere integrated plan (i.e. China’s overall plan for building socialism with Chinese characteristics, to promote coordinated progress in the economic, political, cultural, social and eco-environmental fields), implementing cleaner agricultural production and significantly enhancing management of chemical fertilisers and pesticides application [Citation50]. In addition, the revised Environmental Protection Law in 2014 stipulate more scientific and rational use of fertilisers and pesticides. In April 2015, ‘the Water Pollution Prevention and Control Action Plan’ was issued by the State Council, requiring that provinces in the Yangtze River basin need to achieve the goal of reducing the quantity of fertiliser application 1 year in advance. In May 2015, eight ministries and commissions, including the Ministry of Agriculture, the National Development and Reform Commission, and the Ministry of Science and Technology, jointly issued ‘The National Agricultural Sustainable Development Plan (2015–2030)’, requiring the improvement of fertiliser application methods to ensure zero increase in fertiliser utilisation. The implementation of these measures, including the Action Plan seem to be very effective, as demonstrated in the notable reduction of PF application rate for the three provinces studied. In addition, it was announced at the 19th National Congress of the Communist Party of China (CPC) in 2017 that China would continue to increase funding for agricultural infrastructure construction and comprehensive agricultural development [Citation51]. This may explain why a slightly faster increase in grain yield was observed from 2017 onwards ().
Cd content in PF
Comparison of the Cd content in phosphate-rich sedimentary rocks around the world revealed that Chinese rocks have relatively low Cd content (Table S7), this is consistent with the findings reported by other researchers [Citation11]. According to China’s national standard ‘Limitation requirements of toxic and harmful substance in fertilisers, GB 38,400–2019, the maximum concentration of Cd in fertilisers should be no more than 10 mg∙kg−1, which is more stringent as compared to other countries. For instance, Finland has the most stringent limit for Cd content in fertilisers among European Union countries, and the limit is 21.5 mg∙kg−1, which is more than two times higher than that of China.
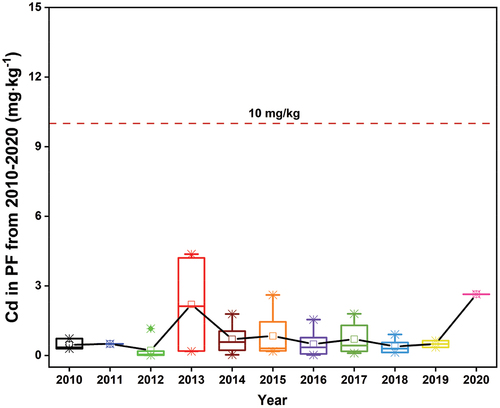
In 2016, Huang et al. [Citation52] reported that the average cadmium (Cd) content in the 159 Chinese PF samples collected was 0.77 mg∙kg−1. Yu et al. [Citation53] found that the average Cd concentration from 171 types of PF samples was 0.91 mg∙kg−1. Li et al. [Citation40] revealed that the average Cd content in the PF manufactured from 1985 to 2018 was 0.75 mg∙kg−1. In this study, based on data published in the literature from 2010 to 2020, the average Cd content in Chinese PF samples was calculated as 0.706 mg∙kg−1 (see Table S8), which was generally consistent with previous studies. As shown in , the content of Cd in Chinese PF was generally stable during 2010–2020 period, and were all below the concentration limit value of 10 mg∙kg−1. However, in 2013 and 2020, the Cd content was notably high, this is because quite a few of the studies reported in these 2 years focused on tobacco planting fields and mining sites, and the PF applied in these soils had exceptionally high Cd content.
Figure 5. Cd content in Chinese PF from 2010 to 2020 (mg∙kg−1).
The six main types of PF used in China are monoammonium phosphorus (MAP), diammonium phosphorus (DAP), heavy calcium phosphorus (TSP), compound fertiliser (NPK), calcium magnesium phosphorus (FCMP), and calcium superphosphorus (SSP) [Citation54]. The four types (i.e. MAP, DAP, TSP, NPK) contain higher Cd concentration than the remaining two types (i.e. FCMP and SSP), and their production output accounts for 96.8% of the total phosphorus fertiliser output [Citation55]. In this study, it was found that the average Cd content in DAP/MAP was highest (as shown in Table S8 and Fig. S1), in comparison to other types of PF. According to Roberts [Citation11], Cd content in the fertiliser was influenced by the manufacturing process, especially during the beneficiation and acidification procedure.
Input of Cd from phosphorus fertiliser
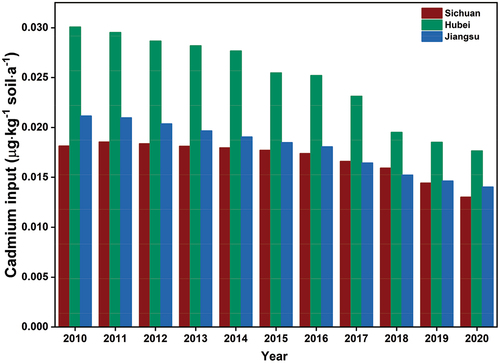
Based on Equation (2), input of Cd into agricultural soil due to PF application was calculated for the three provinces studied (). It was found that Cd input gradually declined for all three provinces from 2010 to 2020, mainly due to decrease in the total PF application quantity. Hubei province had the highest total application quantity, so its Cd input was the highest, ranging from 0.030 µg·kg−1 soil·a−1 in 2010 to 0.018 µg∙kg−1 soil·a−1 in 2020, while the Cd input for Sichuan and Jiangsu provinces was much lower, which were 0.018–0.013 µg·kg−1 soil·a−1 (Sichuan), and 0.021–0.014 µg·kg−1 soil·a−1 (Jiangsu) from 2010 to 2020, respectively. It was reported in a study by Liu [Citation56] that Hubei and Jiangsu provinces were both among the top five provinces with the highest fertiliser application rate, and Hubei ranked first [Citation57], which is consistent with the findings in this study. In addition, PF production by Hubei province was the highest in China, accounting for 37.8% of the national total output [Citation55].
Figure 6. Cd input from PF from 2010 to 2020 (μg∙kg−1 soil∙ha−1).
City level perspective
In order to identify the regions with higher application quantity/rate within each province and to provide a sound scientific basis for determining management priority for PF utilisation, the distribution of cultivated land within each province, the application rate of PF, as well as the Cd input for each city of the three provinces was further examined (). The relevant data in are given in Table S9-S14. It was found that the top four cities with the highest cultivation area in Sichuan province are Nanchong, Dazhou, Liangshan and Chengdu; Liangshan is located in the southwest part, and the other three cities are all located in the northeast of the province. Deyang and Panzhihua are the two cities with the highest application rate in Sichuan. As discussed in section 3.1 that from provincial perspective the PF application rate reduced significantly from 2010 to 2020; but from a city-level perspective, it was revealed that Ya’an and Meishan both experienced quite significant increase in PF application rate, increased from 56.4 kg∙ha−1 to 73.6 kg∙ha−1, and 67.3 kg∙ha−1 to 70.4 kg∙ha−1, respectively from 2010–2015 period to 2016–2020 period. It is thus recommended that local authorities should closely monitor and control PF utilisation for both cities.
Figure 7. Area of cultivated land, PF application rate and Cd input from PF of Sichuan, Hubei and Jiangsu for 2010–2020.
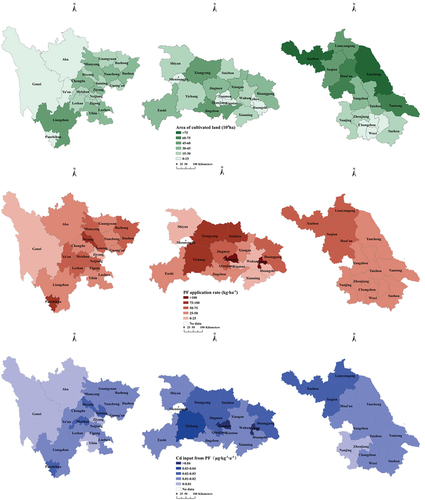
For Hubei province, Xiangyang, Huanggang and Jingzhou are the top three cities with the highest cultivated area, and Tianmen, Ezhou, Yichang, and Xiangyang applied more PF than other cities of Hubei. It should be noted that Huangshi city experienced a slight increase in both application rate of PF and Cd input from 2010–2015 period to 2016–2020 period. In Jiangsu province, the PF application rate and Cd input for all cities reduced from 2010–2015 period to 2016–2020 period. Xuzhou and Yancheng are the two cities with the highest cultivated area, and Xuzhou, Lianyungang, and Suqian are the three cities applying the most PF, and the per capita GDP for these three cities happens to be the lowest among all cities of Jiangsu province. This further demonstrates the role that the economy plays in supporting sustainable agriculture practice, as discussed in Section 3.1.
Cd level in diet and the health risks
Cd level in diet
In the previous sections, Cd input into arable land from fertiliser application was analysed from both provincial and city level, and the impact of these Cd inputs on dietary health risks should be determined, so appropriate mitigation measures can then be taken. China has undertaken six rounds of Total Diet Studies (TDS) since 1990, and the most recent ones are 4th, 5th and 6th Total Diet Studies, undertaken in 2007, 2009–2013, and 2016–2019, respectively. The TDS examined the concentrations of various contaminants, including Cd in a number of food categories (e.g. cereals, vegetables, eggs, etc.), as well as the dietary patterns for 20 provinces/cities of China. The results of the most recent one (6th diet study) were not published yet when writing this paper, so the results of the 4th and 5th have been used. Based on the Cd dietary intake data reported by the total diet studies, the total weekly dietary Cd intake of adults for the three provinces was calculated (). The calculated Cd intake was compared against the PTWI (Provisional Tolerable Weekly Intake) of 2.5 μg∙kg−1 bw established by the EFSA Panel on Contaminants in the Food Chain (CONTAM) [Citation44]. Jiangsu province was not included in the 4th diet study.
Figure 8. Dietary Cd intake for adults per week (μg∙kg−1 bw).
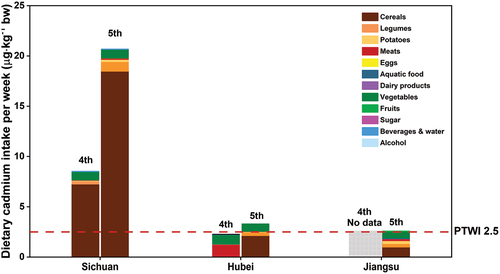
It can be seen that adults’ dietary Cd intake for all three provinces exceeded the PTWI during the 5th diet study, and the exceedance by Sichuan province was the most significant. The Cd intake of Sichuan and Hubei both increased significantly from the 4th to 5th total diet study. Grain contributed most to the total dietary Cd intake for all three provinces, especially for Sichuan Province with the contribution being 89%. It should be pointed out that Cd levels in the grains of Sichuan was exceptionally high (Table S15), reaching 206.5 μg∙kg−1 as reported in the 5th diet study, which slightly exceeded China’s national food safety standard of 0.2 mg∙kg−1 for grains; the national average Cd content in grains was only 21.4 μg∙kg−1. Cd levels in legumes, potatoes, meat, and vegetables were also much higher than the national average. Attention should be paid particularly to Cd content in legumes of Hubei Province and in potatoes of Jiangsu province, both of which exceeded the national average level but were below the relevant national food quality standard. Cd content in potatoes of Jiangsu province was three times higher than the national average. This suggests that Cd levels in these food categories should be closely monitored and high consumption of these food types should be controlled in order to reduce Cd dietary intake.
Dietary Cd health risk assessment
In order to assess the dietary Cd health risk levels, target hazard quotient (THQ) was calculated for each category of food based on the dietary pattern as reported in the 5th total diet study for the three provinces (). It can be seen that THQ value for grains of Sichuan Province is 7.337, indicating that residents in Sichuan should closely monitor Cd intake from grain products. The THQ for legumes and vegetables are approximately 0.3 ~ 0.4, suggesting these two food types are potential high Cd intake sources. The high Cd level in the grains of Sichuan province is possibly caused by the natural high Cd content in the soil due to the typical karst landforms in Sichuan province. In addition, it was reported that residents in Sichuan used to combust local coal containing high content of both fluorine and Cd before 1983 for heating and cooking. After 1983, they use coal imported from other areas, but the coal still contains high Cd level, which could result in atmospheric Cd deposition in the soil. For Hubei and Jiangsu province, cereals and vegetables are both important dietary Cd sources, especially for Hubei, the THQ of cereals is 0.846.
Table 1. The calculated THQ for different types of food of the three provinces.
Discussion
Planting area and PF application
This study has undertaken a detailed analysis of the PF utilisation in three provinces from 2010 to 2020: Sichuan (upstream), Hubei (midstream) and Jiangsu (downstream), along the Yangtze River basin of China, in order to determine the implementation impact of the Action Plan, as well as other relevant measures undertaken by the Chinese government for the control and management of PF application.
It was revealed that the total planting area for Sichuan and Hubei increased by 7.55% and 8.05%, respectively, and their increase was both due to planting area increase for vegetables and corn. On the contrary, Jiangsu experienced reduction in cultivated area, possibly resulting from its relatively more rapid urbanisation and industrialisation. The planting area for vegetables for the three provinces all increased by approximately 2%-3%, accounting for 13% (Sichuan), 16% (Hubei) and 19% (Jiangsu) of their total planting area, respectively. This suggests that demand for vegetables in China is increasing.
It was revealed that the annual PF application quantity in descending order for 2010 and 2020 was Hubei>Sichuan>Jiangsu, and the annual PF application quantity for all three provinces exhibited notable reduction during this period (Table S2-S4) and the reduction was more significant from 2016 (13th five-year plan period) onwards, this was likely caused by the implementation of the Action Plan in Feb.2015.
The PF application rate in the descending order was Hubei> Jiangsu > Sichuan, and these three provinces reduced their PF application rate by 28.18% (Sichuan), 41.33% (Hubei), and 33.68% (Jiangsu), respectively. The PF application rate of Hubei experienced the most significant reduction, but its application rate remained the highest among the three provinces. The PF application rate of Sichuan province was the lowest among these three provinces, and its yield of different crops hardly decreased at all when its PF application rate reduced (). It should be noted that the yield for all food crops (i.e. grains, vegetables, cash crops) by Jiangsu province, as shown in , was highest. This indicates that Jiangsu province may be more willing and able to adopt advanced agricultural technology to increase grain yield since it is the most economically developed province of the three. This finding is consistent with the findings by [Citation58]. The yield of cash crops seems to be more dependent on the PF application, since the yield of cash crops of both Hubei and Jiangsu province reduced significantly.
Cd input
It was found that Cd input gradually declined for all three provinces from 2010 to 2020, mainly due to the decrease in the total PF application quantity. Cd input for Hubei province was highest, ranging from 0.030 µg·kg−1 soil·a−1 in 2010 to 0.018 µg·kg−1 soil·a−1 in 2020, while the Cd input for Sichuan and Jiangsu provinces was much lower, which were 0.018–0.013 µg·kg−1 soil·a−1 (Sichuan), and 0.021–0.014 µg·kg−1 soil·a−1 from 2010 to 2020 (Jiangsu), respectively.
From the city-level perspective, Deyang and Panzhihua had the highest application rate in Sichuan. It seems that the relatively high PF application rate in Deyang has already caught the attention of their local government, since the completion declaration of the rectification task for negative growth in fertiliser usage was announced on Deyang Municipal People’s Government’s website [Citation59]. In addition, Ya’an and Meishan both experienced quite significant increase in PF application rate. Hence, it is thus recommended that local authorities should closely monitor and control the utilisation of PF for both cities. For Hubei province, Tianmen, Ezhou, Yichang, and Xiangyang applied more PF than other cities in this province. It should be noted that Huangshi city experienced a slight increase in both application rate of PF and Cd input from 2010–2015 period to 2016–2020 period. In Jiangsu province, the application rate of PF and Cd input for all cities reduced from 2010–2015 period to 2016–2020 period; Xuzhou, Lianyungang, and Suqian are the three cities applying the most PF, and the per capita GDP for these three cities happens to be the lowest among all cities of Jiangsu province.
It should be noted that adopting climate-smart agricultural practices (CAPs, e.g. minimum tillage, improved rice varieties, farmyard manure, water-saving technology, and biopesticides) can contribute to food security by improving crop yields. A study undertaken by [Citation48] revealed that educated farmers, those who experienced a drought during the most recent growing season, and individuals who perceived the rainfall to have changed during the 5 years preceding the survey were more likely to intensify the adoption of CAPs. This suggests that providing education or agricultural training on fertiliser use knowledge to farmers is a feasible and effective approach in minimising fertiliser application. It should be noted that according to the projections for the year 2030 done by Van Wesenbeeck et al. [Citation47] that the net surplus in kg per ha of phosphorus oxide in Jiangsu province would worsen then, so appropriate mitigation measures should be taken.
Dietary health risks
It was revealed that adults’ dietary Cd intake for all three provinces exceeded the PTWI during the 5th diet study, and the exceedance by Sichuan province was the most significant. The Cd intake of Sichuan and Hubei both increased significantly from the 4th to 5th total diet study. Grain contributed most to the total dietary Cd intake for all three provinces, especially for Sichuan Province with the contribution being 89%. It should be pointed out that Cd levels in the grains of Sichuan were exceptionally high (Table S9), reaching 206.5 μg∙kg−1 as reported in the 5th diet study [Citation60], which exceeded China’s national food safety standard of 200 μg∙kg−1 for grains. The THQ value for grains in Sichuan Province was 7.337, indicating that residents in Sichuan should closely monitor Cd intake from grain products. The THQ for legumes and vegetables are approximately 0.3 ~ 0.4, suggesting these two food types are potentially high Cd intake sources. For Hubei and Jiangsu province, cereals and vegetables are both important dietary Cd sources, especially for Hubei, the THQ of cereals is 0.846.
Conclusions and limitations
Conclusions
The reduction in the PF application for the three provinces in this study demonstrated the effectiveness of the Action Plan implemented in 2015 by the Ministry of Agriculture in optimising PF utilisation across China. This indicates that the sustainability of agricultural practice could be greatly improved if appropriate and effective measures are taken. However, no one-size-fits-all suite of agricultural practices can help achieve zero-growth in fertiliser consumption while ensuring crop yields. For Sichuan Province, comprehensive transformation projects of low-yield dry land or low-lying land prone to waterlogging in paddy fields employing engineering techniques (e.g. irrigation and drainage works, land formation works, and improvements of fertility level) have been successfully undertaken at the village scale, and the results of these projects demonstrated that the effectiveness of these approaches in the improvement of the quality of cultivated land, as well as crop yields increase [Citation58]. These projects could be extended nationally. For Hubei and Jiangsu province, for which the crop yield is already relatively high, efforts should be made on improving utilisation efficiency of water and fertiliser and formulate measures to inhibit non-grain production on cultivated land, as suggested by Zhi et al. [Citation58].
It is thus envisaged that global phosphorus sustainability could be greatly enhanced if more countries are willing to make the efforts. For example, the EU Fertilising Products Regulation (2019/1009) set limits for cadmium and other harmful contaminants in ‘CE marked’ fertilisers in June 2019, which become effective in 2022. Implementing safe limits for cadmium and contaminants in PF and feed supplements is needed globally due to the global trade in agricultural produce [Citation1]. The findings of this research could provide useful insights into the current practice of PF application in the main rice planting regions of China from both provincial and city-level perspectives and facilitate the optimal PF use in global sustainable intensification of agricultural systems, so as to improve phosphorus sustainability and mitigate climate change potentially.
Limitations
This study has undertaken a comprehensive analysis on the PF application in three provinces along the Yangtze River of China. Since detailed data on some of the parameters, including soil density and Cd content of PF, were not publicly available, so average values of these parameters were used. This would have added a certain level of uncertainties to the calculations, but this approach of using average values has also been adopted by other researchers, indicating that there is a need to undertake further environmental monitoring on these parameters in the future, so they will become available for more robust analysis.
Author contributions
All authors contributed to the study conception and design. Siqi Li did data analysis, article writing, and figure production. Xiang WEI did data collection and data validation. Siyan CHEN, Kunwu JIANG and Jinming LIU helped with data validation and figure production. Hui LI helped with data validation and reviewing. Guangyu SHI carried out data collection and analysis. Yuan LIANG did data validation and critical review. Yuanyuan CHENG undertook funding acquisition, research design, supervision, data validation and article writing.
Availability of data and materials
All data generated or analysed during this study are included in this published article and its supplementary information files.
Supplemental Material
Download MS Word (150.7 KB)Disclosure statement
No potential conflict of interest was reported by the author(s).
Supplementary material
Supplemental data for this article can be accessed online at https://doi.org/10.1080/26395940.2024.2344485
Additional information
Funding
References
- Brownlie WJ, Sutton MA, Reay DS, et al. Global actions for a sustainable phosphorus future. Nat Food. 2021;2(2):71–287. doi: 10.1038/s43016-021-00232-w
- Metson GS, Brownlie WJ, Spears BM. Towards net-zero phosphorus cities. Npj Urban Sustain. 2022;2(1):30. doi: 10.1038/s42949-022-00076-8
- Beaulieu JJ, DelSontro T, Downing JA. Eutrophication will increase methane emissions from lakes and impoundments during the 21st century. Nat Commun. 2019;10(1):1375. doi: 10.1038/s41467-019-09100-5
- Li H, Liu J, Li G, et al. Past, present, and future use of phosphorus in Chinese agriculture and its influence on phosphorus losses. Ambio. 2015;44(S2):274–285.
- Xu F-F, Song J, Li Y-Q, et al. Bioaccessibility and bioavailability adjusted dietary exposure of cadmium for local residents from a high-level environmental cadmium region. J Hazard Mater. 2021;420:126550. doi: 10.1016/j.jhazmat.2021.126550
- Zhang W, Zhang T, Yang X. 1 km-resolution gridded dataset of phosphorus rate for rice wheat and maize in China over 2004–2016. Sci Data. 2023;10(1). doi: 10.1038/s41597-023-02283-z
- Sterckeman T, Gossiaux L, Guimont S, et al. Cadmium mass balance in French soils under annual crops: scenarios for the next century. Sci Total Environ. 2018;639:1440–1452. doi: 10.1016/j.scitotenv.2018.05.225
- Gao Z, Liu J, Liao W. Situation of cadmium pollution caused by application of p-hosphate fertilizer and the countermeasure of prevention and control of cadmiu-m. J Hebei Agri Univ. 2001;3:90–94. doi: 10.3969/j.issn.1000-1573.2001.03.023
- Fayiga AO, Nwoke OC. Phosphate rock: origin, importance, environmental impacts, and future roles. Environ Rev. 2016;24(4):403–415. doi: 10.1139/er-2016-0003
- Lugon-Moulin N, Ryan L, Donini P, et al. Cadmium content of phosphate ferti-lizers used for tobacco production. Agron Sustain Dev. 2006;26(3):151–155. doi: 10.1051/agro:2006010
- Roberts TL. Cadmium and phosphorous fertilizers: the issues and the science. Procedia Eng. 2014;83:52–59. doi: 10.1016/j.proeng.2014.09.012
- Schroeder HA, Balassa JJ. Abnormal trace metals in man: cadmium. J Chronic Dis. 1961;14(2):236–258. doi: 10.1016/0021-9681(61)90156-4
- Six L, Smolders E. Future trends in soil cadmium concentration under current cadmium fluxes to European agricultural soils. Sci Total Environ. 2014;485-486:319–328. doi: 10.1016/j.scitotenv.2014.03.109
- Ulrich AE. Cadmium governance in Europe’s phosphate fertilizers: not so fast? Sci Total Environ. 2019;650:541–545. doi: 10.1016/j.scitotenv.2018.09.014
- Chen M, Chen J, Sun F. Agricultural phosphorus flow and its environmental impacts in China. Sci Total Environ. 2008;405(1–3):140–152. doi: 10.1016/j.scitotenv.2008.06.031
- Yang W, Wang D, Wang M, et al. Heavy metals and associated health risk of wheat grain in a traditional cultivation area of Baoji, Shaanxi, China. Environ Monit Assess. 2019;191(7):428. doi: 10.1007/s10661-019-7534-9
- Yuan X, Xue N, Han Z. A meta-analysis of heavy metals pollution in farmland and urban soils in China over the past 20 years. J Environ Sci. 2021;101:217–226. doi: 10.1016/j.jes.2020.08.013
- Shao D, Zhan Y, Zhou W, et al. Current status and temporal trend of heavy metals in farmland soil of the Yangtze River delta region: field survey and meta-analysis. Environ Pollut. 2016;219:329–336. doi: 10.1016/j.envpol.2016.10.023
- Shi T, Zhang Y, Gong Y, et al. Status of cadmium accumulation in agricultural soils across China (1975–2016): from temporal and spatial variations to risk assessment. Chemosphere. 2019;230:136–143. doi: 10.1016/j.chemosphere.2019.04.208
- Cheng Y, Nathanail CP. Regional human health risk assessment of cadmium and hexachlorocyclohexane for agricultural land in China. Environ Geochem Health. 2021;43(9):3715–3732. doi: 10.1007/s10653-021-00868-4
- Satarug S, Vesey DA, Gobe GC. Current health risk assessment practice for dietary cadmium: data from different countries. Food Chem Toxicol. 2017;106:430–445. doi: 10.1016/j.fct.2017.06.013
- Clemens S, Aarts MGM, Thomine S, et al. Plant science: the key to preventing slow cadmium poisoning. Trends Plant Sci. 2013;18(2):92–99. doi: 10.1016/j.tplants.2012.08.003
- Wang M, Chen Z, Song W, et al. A review on cadmium exposure in the population and intervention strategies against cadmium toxicity. Bull Environ Contam Toxicol. 2021;106(1):65–74.
- Xie M. Association between dietary cadmium exposure and breast cancer risk: an updated meta-analysis of observational studies. Med Sci Monit. 2015;21:769–775. doi: 10.12659/MSM.892743
- Zhao D, Wang P, Zhao F-J. Dietary cadmium exposure, risks to human health and mitigation strategies. Crit Rev Environ Sci Technol. 2023;53(8):939–963. doi: 10.1080/10643389.2022.2099192
- Nogawa K, Kido T. Biological monitoring of cadmium exposure in itaiitai disease epidemiology. Int Arch Occup Environ Health. 1993;65(S1):S43–S46. doi: 10.1007/BF00381306
- Yan J, Huo J, Li R, et al. Benchmark dose estimation of urinary and blood cadmium as biomarkers of renal dysfunction among 40‐75‐year‐old non‐smoking women in rural areas of southwest China. J Appl Toxicol. 2019;10(39):1433–1443.
- Bi X, Pan X, Zhou S. Soil security is alarming in China’s main grain producing areas. Environ Sci Technol. 2013;47(14):7593–7594. doi: 10.1021/es402545j
- Xie Y, Li X, Liu X, et al. Application of aspergillus aculeatus to rice roots reduces Cd concentration in grain. Plant Soil. 2018;422(1–2):409–422.
- Qin G, Niu Z, Yu J, et al. Soil heavy metal pollution and food safety in China: effects, sources and removing technology. Chemosphere. 2021;267:129205. doi: 10.1016/j.chemosphere.2020.129205
- Schaefer HR, Dennis S, Fitzpatrick S. Cadmium: mitigation strategies to reduce dietary exposure. J Food Sci. 2020;85(2):260–267. doi: 10.1111/1750-3841.14997
- Shuqin J, Fang Z. Zero growth of chemical fertilizer and pesticide use: China’s objectives, progress and challenges. J Resour Ecol. 2018;9:50–58. doi: 10.5814/j.issn.1674-764x.2018.01.006
- Ji Y, Liu H, Shi Y. Will China’s fertilizer use continue to decline? Evidence from LMDI analysis based on crops, regions and fertilizer types. PLOS ONE. 2020;15:e0237234. doi: 10.1371/journal.pone.0237234
- Dong WQY, Cui Y, Liu X. Instances of soil and crop heavy metal contamination in China. Soil Sediment Contam Int J. 2001;10(5):497–510. doi: 10.1080/20015891109392
- Jiang L, Li Z. Urbanization and the change of fertilizer use intensity for agricultural production in Henan province. Sustainability. 2016;8(2):186. doi: 10.3390/su8020186
- Liu Q, Tu W, Pu L, et al. Regional differences and key influencing factors of fertilizer integrated efficiency in China. Sustainability. 2022;14(20):12974. doi: 10.3390/su142012974
- Cao Z, Zheng X, Guan M, et al. Cumulative risk assessment of dietary exposure to pesticide residues in brown rice (Oryza sativa L.) from the three main rice-growing regions in China during 2016–2020. J Food Qual. 2022;2022:1–13. doi: 10.1155/2022/5902540
- Ruan S, Zhuang Y, Zhang L, et al. Improved estimation of nitrogen dynamics in paddy surface water in China. J Environ Manage. 2022;312:114932. doi: 10.1016/j.jenvman.2022.114932
- Zhang H, Chen T, Liu L, et al. Performance in grain yield and physiological traits of rice in the Yangtze river basin of china during the last 60 yr. J Integr Agric. 2013;12(1):57–66.
- Li H, Yang Z, Dai M, et al. Input of Cd from agriculture phosphate fertilizer application in China during 2006–2016. Sci Total Environ. 2020;698:134149. doi: 10.1016/j.scitotenv.2019.134149
- Sharafi K, Nodehi RN, Mahvi AH, et al. Bioaccessibility analysis of toxic metals in consumed rice through an in vitro human digestion model – comparison of calculated human health risk from raw, cooked and digested rice. Food Chem. 2019;299:125126. doi: 10.1016/j.foodchem.2019.125126
- Wei J, Gao J, Cen K. Levels of eight heavy metals and health risk assessment considering food consumption by China’s residents based on the 5th China total diet study. Sci Total Environ. 2019;689:1141–1148. doi: 10.1016/j.scitotenv.2019.06.502
- Wang D. Pollution-free vegetable fertilization technology - phosphate fertilizer (medium). Hunan Agric. 2002;19:14.
- EFSA Panel on Contaminants in the Food Chain (CONTAM). Statement on toler-ale weekly intake for cadmium. Efsa J. 2011;9(2):1975. doi: 10.2903/j.efsa.2011.1975
- Yang B, Wang Z, Zou L, et al. Exploring the eco-efficiency of cultivated land utilization and its influencing factors in China’s Yangtze river economic belt, 2001–2018. J Environ Manage. 2021;294:112939. doi: 10.1016/j.jenvman.2021.112939
- Liang X, Jin X, Sun R, et al. A typical phenomenon of cultivated land use in China’s economically developed areas: anti-intensification in Jiangsu Province. Land Use Policy. 2021;102:105223. doi: 10.1016/j.landusepol.2020.105223
- Van Wesenbeeck CFA, Keyzer MA, Van Veen WCM, et al. Can China’s overuse of fertilizer be reduced without threatening food security and farm incomes? Agric Syst. 2021;190(January):103093. doi: 10.1016/j.agsy.2021.103093
- Vatsa P, Ma W, Zheng H, et al. Climate-smart agricultural practices for promoting sustainable agrifood production: yield impacts and implications for food security. Food Policy. 2023;121:121. doi: 10.1016/j.foodpol.2023.102551
- Wu Y, Wang E, Miao C. Fertilizer use in China: the role of agricultural support policies. Sustainability. 2019;11(16):4391. doi: 10.3390/su11164391
- Jiang Y, Yang L, Xiaolei Z. Analysis of the characteristics of connotation evolution of agricultural modernization with Chinese characteristics in the 70 years since the founding of New China. China Polit Econ. 2020;3(1):57–74. doi: 10.1108/CPE-05-2020-0004
- Zhang D, Wang H, Lou S, et al. Research on grain production efficiency in China’s main grain producing areas from the perspective of financial support. PLOS ONE. 2021;16(3):e0247610. doi: 10.1371/journal.pone.0247610
- Huang C-L, Bao L-J, Luo P, et al. Potential health risk for residents around a typical e-waste recycling zone via inhalation of size-fractionated particle-bound heavy metals. J Hazard Mater. 2016;317:449–456. doi: 10.1016/j.jhazmat.2016.05.081
- Yu X, Li H, Doluschitz R. Towards sustainable management of mineral fertilizers in China: an integrative analysis and review. Sustainability. 2020;12(17):7028. doi: 10.3390/su12177028
- Huang G, Wu L, Li Y, et al. Development situation and suggestions on phosphorous fertilizer industry in China. Mod Chem Ind. 2013;33(11):1–4. doi: 10.16606/j.cnki.issn0253-4320.2013.11.002
- Wang Y, Fang J, Li B, et al. Operation of phosphate and compound fertilizer industry in China in 2021 and development trend. Phosphate Compd Fert. 2022;37:1–8. doi: 10.3969/j.issn.1007-6220.2022.08.002
- Liu Q. Distribution of fertilizer application and its environmental risk in different provinces of China. Sci Agric Sin. 2014;47(18):3596–3605. doi: 10.3864/j.issn.0578-1752.2014.18.008
- Ma Z, Hu S, Yang L, et al. Research on assessment of current situation of chemical fertilizer application in the middle and lower reaches of the Yangtze Rive. Rural Econ Sci Technol. 2020;31:77–79+86. doi: 10.3969/j.issn.1007-7103.2020.09.027
- Zhi J, Cao X, Zhang Z, et al. Identifying the determinants of crop yields in China since 1952 and its policy implications. Agri Forest Meteorol. 2022;327:109216. doi: 10.1016/j.agrformet.2022.109216
- Deyang Municipal People’s Government. 2020, January 22. Deyang city central environmental protection inspector (Provincial rectification task 6th) rectification task completion declaration. https://www.deyang.gov.cn/zdbd/2019/hbdc2019/dcdt/926522.htm
- Wu Y, Zhao Y, Li J. The fifth China total diet study. Y. Wu, Y. Zhao, & J. Li Editors. Beijing: Science Press; 2018.