
 ?Mathematical formulae have been encoded as MathML and are displayed in this HTML version using MathJax in order to improve their display. Uncheck the box to turn MathJax off. This feature requires Javascript. Click on a formula to zoom.
Abstract
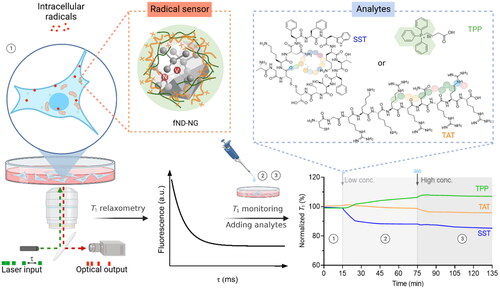
Intracellular radicals play important roles in cell signaling and regulation of growth factors, cytokines, transcription, apoptosis, and immunomodulation, among others. To gain a more comprehensive understanding of their biological functions from a spatio-temporal perspective, there is a great need for nanoscale sensitive tools that allow real-time detection of these reactive species. Currently, intracellular radical probes are based on chemical reactions that could significantly alter radical levels during detection. Due to the excellent biocompatibility and favorable photophysical properties of nitrogen-vacancy (NV–) centers in fluorescent nanodiamonds (fNDs), the fNDs can serve as a powerful and chemically inert nanotool for intracellular radical detection. In this study, a positively charged nanogel (NG) coating was prepared to prevent the precipitation of fNDs and promote cellular internalization. After internalization of nanodiamond-nanogels (fND-NGs), different stimulators, namely somatostatin (SST), triphenylphosphonium (TPP), and trans-activator of transcription (TAT) peptide, which are widely used cell- or organelle-targeting ligands in medicine, drug delivery, and diagnostics, were applied to stimulate the cells. In parallel, the intracellular radical changes under stimulation of SST, TPP, and TAT ligands were monitored by fND-NGs in a home-built optically detected magnetic resonance (ODMR) microscope. Our method allows for detecting intracellular radicals in-situ and monitoring their real-time changes during incubation with the targeting ligands in a single living cell. We believe that our method will provide insights into the generation of radical stress in cells, which could improve our fundamental understanding of the pharmacology and signaling pathways of widely used cell- and organelle-targeting ligands associated with free radicals.
1. Introduction
Free radicals in biology were historically regarded as villains contributing to a spectrum of pathological disorders, including cancers, diabetes, cardiovascular maladies, and various others [Citation1, Citation2]. For instance, free radical-mediated reactions could induce chromosomal aberrations, facilitate the activation of oncogenic elements, and consequently culminate in tumorigenesis [Citation3]. On the contrary, it is also found that free radicals can play several beneficial roles in many biological processes when maintained at low or moderate concentrations [Citation4, Citation5]. For example, reactive oxygen species (ROS) and reactive nitrogen species (RNS) generated in phagocytes assist the host immune defense system in combating pathogens [Citation6, Citation7]. Therefore, in-situ detection of free radicals is essential to elucidate their diverse roles in cells.
However, in-situ detection of intracellular radicals is still in its infancy as we lack the appropriate techniques to study their formation, lifetime, and interaction partners. Current methods for detecting intracellular radicals are mainly based on fluorescence-based dyes, such as amino/hydroxyphenyl fluorescein [Citation8]. However, these dyes chemically react with the radicals in the detection, which at the same time alters their amount [Citation9, Citation10], thereby capturing past and accumulated radical loads. Fluorescent nanodiamonds (fNDs) containing nitrogen-vacancy (NV–) centers could provide sensitive detection of intracellular radicals without involving chemical reactions due to their unique photophysical properties [Citation11, Citation12]. Consequently, this offers a more accurate method for detecting intracellular radical loads without introducing cellular redox reactions. The longitudinal relaxation time (T1) of the NV– centers in fNDs can be shortened by the surrounding magnetic noise generated by the electron spins of radicals. Based on this photophysical property, fNDs-based T1 relaxometry was developed to locally detect and quantify radicals [Citation13]. Additionally, fNDs offer distinct advantages in terms of biocompatibility [Citation14], sensitivity [Citation15], and resolution [Citation16] compared to fluorescent probes. It has been reported that a single NV center embedded in diamond can detect the single spin signal [Citation17], which is more sensitive than current electron paramagnetic resonance (EPR) technique [Citation18]. Internalized fNDs also do not react with radicals and do not bleach, which enables real-time long-duration measurements [Citation19]. Recently, T1 relaxometry has successfully been used to investigate metabolic activity and radical formation in living cells [Citation20]. For example, cellular metabolic activities in single mitochondria were monitored using T1 relaxometry. An increase of intracellular radicals was observed upon carbonyl cyanide m-chlorophenyl hydrazone treatment, whereas a decrease of radical levels occurred upon superoxide dismutase treatment [Citation21]. Moreover, T1 relaxometry was utilized to detect the host cellular radical response upon Semliki Forest Virus [Citation22] and S.aureus [Citation23] infections. Very recently, a fND-based radical generator and detector was reported. Such system allowed quantifying the local number and kinetics of free radicals generated in an eumelanin shell inside cells by combining experiments and theoretical simulations [Citation24]. This study provides a perspective toward quantifying radicals in the living environment (Scheme 1).
Scheme 1. Detecting cellular radical responses of A549 cells upon incubation with ligands SST, TPP, and TAT. fND-NGs were first incubated with the cell to perform T1 relaxometry measurements and then low and high ligand concentrations were added to the ongoing T1 relaxometry measurements at 15 min and 75 min time points. τ indicates the waiting time of the laser pulses. Stage ① indicates the cellular intrinsic free radicals, and stage ②, ③ represent cellular radical responses upon treatment with low and high ligand concentrations, respectively.
In this work, a positively charged nanogel (NG) coating was prepared to prevent the precipitation of fNDs according to our previous work [Citation25, Citation26] and promote cellular internalization. Subsequently, intracellular localization of fND nanogel (fND-NGs) was characterized utilizing confocal microscopy and quantified by employing Manders’ Colocalization Coefficients (MCC). Later, internalized fND-NGs were applied to optically probe the free radical response of human lung carcinoma cells (A549) in response to three commonly used targeting ligands, i.e., growth factor peptide somatostatin (SST) [Citation27], mitochondrial targeting ligand triphenylphosphonium (TPP) [Citation28] or trans-activator of transcription (TAT) peptide [Citation29], assess their role in the formation and annihilation of intracellular radicals. By using our method, we could in-situ real-time monitor the intracellular radical generation/reduction upon treatment of widely used targeting groups. We believe our method will further our understanding of the fundamental role of various biomolecules and drugs in the formation and annihilation of free radicals in biology.
2. Results and discussion
2.1. Preparation and characterization of fND-NGs
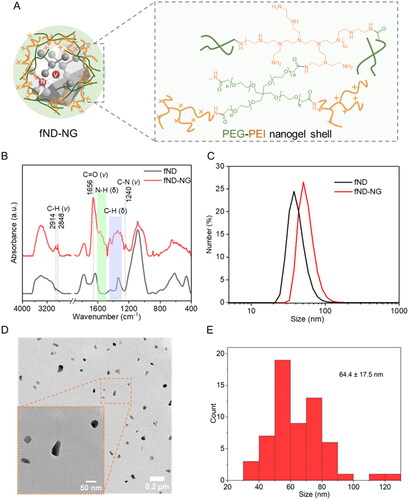
Bare fNDs have poor colloidal stability and aggregate under physiological conditions [Citation30]. To address this challenge, we prepared fND-NGs according to previously published protocols [Citation25, Citation26]. In brief, hyperbranched polyethyleneimine (PEI) was used to pre-coat fNDs in the presence of polyvinylpyrrolidone (PVP) as a stabilizer. Subsequently, a four-arm polyethylene glycol-N-hydroxysuccinimide ester (4-arm PEG-SCM ester) was added, to crosslink the pre-coated PEI on the surface of the fNDs in phosphate-buffered saline (PBS) to form a stable, positively charged nanogel shell (as illustrated in ). The nanogel shell was characterized by attenuated total reflectance Fourier-transform infrared spectroscopy (ATR-FTIR). Specifically, the presence of alky C–H (v: 2914 cm−1, 2848 cm−1, δ: 1445–1311 cm−1), amine (N–H (δ): 1622–1500 cm−1; C–N (δ): 1240 cm−1), and amide group (C = O (v): 1656 cm−1) band originating from PEG and PEI () indicated their successful conjugation to the fNDs surface. The hydrodynamic diameter of the fND-NGs was determined through dynamic light scattering (DLS) and transmission electron microscopy (TEM). After surface coating, the hydrodynamic diameter showed an increase of approximately 14 nm (from 42 nm to 56 nm, Table S1). Importantly, no aggregate formation of the fND-NGs was detected in either DLS or TEM ().
Figure 1. Characterization of fND-NGs. (a) Schematic structure of the fND-NGs shell. (b) ATR-FTIR of fNDs and fND-NGs. v: stretching vibration; δ: bending vibration. (c) Number–size histogram of fND-NGs measured by DLS. (d) Representative TEM images of fND-NGs. (e) Diameter histogram analysis of fND-NGs measured by TEM (n = 60).
2.2. Bioactive ligands SST, TPP, and TAT
SST is a naturally occurring peptide hormone that plays a regulatory role in various physiological processes, including neurotransmission, hormone secretion, and cell proliferation [Citation31]. SST receptors (SSTRs) are present on the surface of many cell types, including immune cells, neuronal cells, and certain cancer cells [Citation27, Citation32]. Therefore, the A549 epithelial cell line with SSTR1 and SSTR3 subtype expression was used in this study [Citation33]. The specific binding property between SST and SSTRs is utilized for improved cancer detection and selectively therapeutic purposes [Citation34, Citation35]. Additionally, after binding to SSTRs, SST regulates nitric oxide (NO) generation through the activation of nitric oxide synthases (NOS) followed by triggering intracellular signaling pathways [Citation36]. NO is a principal modulator of cellular processes in diverse physiological and pathological contexts [Citation37].
TPP ligand selectively accumulates within the mitochondria of cells. This specific targeting property is attributed to the mitochondrial membrane’s negative potential, which facilitates the uptake and accumulation of lipophilic cations [Citation28]. The TPP ligand has been reported to disrupt mitochondrial function by inhibiting oxidative phosphorylation, a known process capable of generating free radicals, such as superoxide ion (•O2-) and hydroxyl free radicals (•OH) [Citation38]. Once delivered to the mitochondria, TPP molecules can engage in various bioenergetic and therapeutic applications [Citation39].
The TAT peptide is a positively charged amino acid sequence derived from the human immunodeficiency virus 1 (HIV-1) protein [Citation40, Citation41]. This unique peptide sequence efficiently crosses cellular membranes, making it a valuable tool in various biomedical applications [Citation29]. TAT demonstrates a high degree of biocompatibility with no compromise in cell viability of A549 even at high concentrations of 1 mM [Citation42]. TAT uses a non-endocytic, direct translocation mechanism that allows it to penetrate the lipid bilayer of the cell membrane without causing significant membrane damage [Citation29, Citation43] and is not involved in processes directly regulating intracellular radicals. Therefore, TAT has been selected as a potential negative control.
The cellular toxicity of SST, TPP, and TAT on A549 cell lines was evaluated using the Cell Titer-Glo cell viability assay kit. As indicated in Figure S1, these targeting ligands did not show any significant cellular toxicity for concentrations up to 100 µM (for SST and TAT) or 1 mM (for TPP), which is consistent with the reported studies [Citation32, Citation39, Citation42].
2.3. Subcellular location of fND-NGs
In order to detect the formation of intracellular radicals upon incubation with SST, TPP, and TAT, the subcellular location of fND-NGs was first characterized by a confocal microscope. Firstly, the fND-NGs, at concentrations of 5 and 10 µg/mL, respectively, were incubated with A549 cells for 24 h. Subsequently, lysosomes were stained using 50 nM Lysotracker-Green and incubated for an additional two hours at 37 °C under a 5% CO2 atmosphere. Following a thorough washing and medium replacement procedure, live cell imaging was conducted utilizing fluorescence confocal microscopy (). The acquired images were de-convolved through a calculated point spread function using Fiji [Citation44]. The colocalization ratio of fND-NGs and lysosomes was calculated by a pixel-level based MCC [Citation45, Citation46]. The proportion of colocalized fND-NGs, which was described by M1, was calculated by JACoP [Citation47] using Fiji as:
Figure 2. CLSM images of fND-NGs (red color) in A549 cells. fND-NGs were incubated with A549 cell lines for 24 h, then lysosomes were stained by Lyso-tracker (green color).
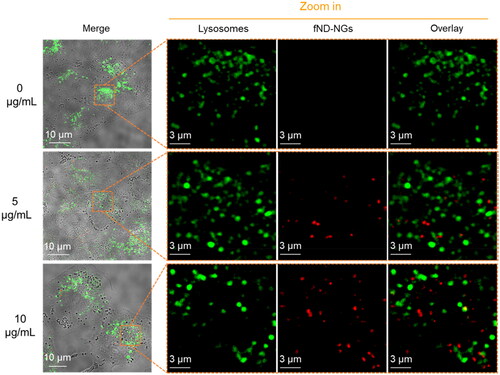
For two probes, denoted as R (Red, fND-NGs) and G (Green, lysotracker), Ri, colocal = Ri if Gi > 0 and Ri, colocal = 0 if Gi = 0. The thresholds of both lysosomes and fND-NGs channels were determined from the maximum intensity of the control group images. The M1 for the cells incubated with 5 µg/mL and 10 µg/mL fND-NGs was around 0.15 and 0.04, which indicated that most of the particles likely escaped from lysosomal compartments and went to the cytoplasm. This feature could probably be attributed to the proton sponge effect of PEI [Citation48], which is positively charged in acidic endosomal or lysosomal compartments and promotes escaping into the cytoplasm. Therefore, we supposed the T1 relaxometry measurements were performed in the cytoplasm.
2.4. Intracellular T1 relaxometry
To detect the presence of intracellular radicals, we utilized a home-built confocal fluorescence microscope combined with optically detected magnetic resonance (ODMR) spectroscopy driven by the software Qudi [Citation49] for measurement. The NV– centers in fNDs were excited using a 532 nm laser, which was focused onto the sample using an oil-immersion objective (Nikon PLAN 100x oil, N.A. = 1.35). The resulting fluorescence originating from the NV– centers was collected by the same objective and filtered with a 640/75 nm band-pass filter and detected using an avalanche photodiode (APD).
The pulse sequence for the T1 relaxometry measurement consists of a series of 10 μs long laser pulses. The laser pulse polarizes the NV– centers into the ms = 0 spin state. After a variable waiting time (τ), the subsequent laser pulse reads out the spin state of the NV– centers. T1 was measured using this all-optical relaxometry technique. The fluorescence photons detected in the first 300–500 ns of the laser pulse contain the spin state information and hence constitute the signal. The T1 measurement data shown are normalized, i.e., the signal (fluorescence obtained during the first 300 ns) is divided by the reference steady-state fluorescence (fluorescence obtained when the NV– center is re-initialized into the ms = 0 spin state). Then, it is fitted with a monoexponential decay function. When fNDs were exposed to a fluctuating magnetic field produced by the surrounding radicals, the T1 of NV– centers is shortened [Citation13]. Therefore, determination of the concentration of radicals surrounding the fNDs surface can be achieved with high sensitivity and high spatial resolution. Recently, it was reported that T1 relaxometry could be used to detect pH changes due to surface electric fields induced by pH changes [Citation50]. However, it was discussed that the observed changes in T1 in the all-optical measurements were due to the charge fluctuation processes between NV–/NV0 centers, which can be related to the complex exchange of charges within the fNDs and/or their surface [Citation51, Citation52]. In our case, the fND-NGs are mainly located in the cytosol, which provides neutral pH and a more homogeneous pH distribution than the endo/lysosomes, so the pH-induced T1 shortening is not taken into account. As discussed, T1 relaxometry can detect free radicals independently of their involvement in cellular redox reactions [Citation13] and thus offers the possibility of revealing intracellular radical dynamics in real-time [Citation20]. However, the need for quantum sensing protocols implies repetition. In this study, T1 relaxometry measurements are performed continuously and the cumulative optical signals at specified intervals are preserved for the analysis of T1 at a specific time point. This approach is referred to as “pseudo real-time T1 relaxometry.”
2.5. Pseudo real-time intracellular radical detection during stimulation with bioactive ligands SST, TPP, and TAT
SST and TPP have been selected because they can potentially stimulate intracellular radical formation via different pathways, while TAT was set as the negative peptide control since there are no direct connections between TAT and cellular radicals. First, the influence of the T1 of the bioactive ligands was assessed in blank control experiments, in which SST, TPP, or TAT were added following a similar procedure but without cells. Figure S2 indicated that SST, TPP, and TAT did not induce any significant fluctuations of T1, which confirms that any changes in the T1 fluctuation would not be a result of the ligand but rather of the induced cellular response.
Next, fND-NGs-based relaxometry was used to investigate the impact of these ligands on intracellular radical formation. To achieve pseudo real time detection of intracellular radicals, T1 was first calculated as reference T1 (T1_ref) after integration time of t to get a good signal-to-noise ratio. After further signal accumulation at interval time Δt, we calculated T1 (T1_t+Δt), in the period of t + Δt, then T1_t+Δt is normalized to T1_ref to present the T1 change in the interval time Δt, so that we can record the T1 change continuously. This approach is referred to as "pseudo real-time T1 relaxometry." In this study, SST, TPP, or TAT were added during the T1 relaxometry measurements. Briefly, the initial cellular free radical load was measured by T1 relaxometry measurements by the fND-NGs (with counts from 1 M/s to 3 M/s) for 15 min. Subsequently, low concentrations of SST (final concentration of 0.5 µM), TPP (final concentration: 5 µM), or TAT (final concentration: 0.5 µM) were introduced to the cells during the continuous T1 relaxometry measurements, which were performed for a total period of 60 min. This concentration of SST was reported to initiate an effect on intracellular NO generation [Citation36], and the same concentration was used for the negative control peptide, TAT. The used TPP concentration was chosen as it is the concentration that inhibites cellular oxygen consumption rate (OCR) [Citation39]. The T1 of the selected intracellular fND-NGs were analyzed at specific time points post-treatment. To study early occurrence of cellular free radicals, every minute of the first 10 min, every 5 min of the first 30 min, and every 10 min of the subsequent 30–60 min post-treatment were set for T1 relaxometry measurements. Afterward, the same experiments were conducted at higher concentrations (200 times of the lower concentrations) to evaluate whether there was a concentration-dependent effect on radical formation. Here, 10 µL of SST (final concentration: 100 µM), TPP (final concentration: 1 mM), or TAT (final concentration: 100 µM) were added to the cells and the same protocol was used as described above. These concentrations of SST, TPP, and TAT are the highest concentrations determined by the cell toxicity assay, where concentrations of SST, TPP, and TAT show no significant cytotoxicity (Figure S1). Each experiment was replicated five times to ensure the reliability and reproducibility of the measured T1. The negative control group consisted of cells treated with 10 µL of Dulbecco’s phosphate-buffered saline (DPBS), which was performed 3 times. It is important to mention that due to the constant concentration of DPBS, only measurements of 15 and another 60 min were conducted for each particle in the control group (Figure S3).
Upon the introduction of low concentrations of SST (0.5 µM), an immediate decline in T1 values was observed in 10 min, and a further reduction of approximately 20% in T1 values was reached within a time frame of approximately 15–40 min (). It reveals an immediate increase in the amount of intracellular radicals in 10 min and it increases by approximately 20% after 40 min. To test whether the amount of intracellular radical would further increase with increasing of SST concentration, we increased the concentration of SST to 100 µM and found that the T1 did not decrease further, which indicates that the amount of cytoplasmic free radicals was saturated [Citation53]. The possible underlying mechanism could be that SSTRs on the surface of A549 were activated which inhibited NOS expression, consequently causing the significant reduction of NO [Citation36, Citation54–56], which acts as a counter role of •O2- to form non-paramagnetic peroxynitrite (ONOO-) inside the cells. Once the reduction of NO has occurred, the process is reversed to maintain the balance of NO and overproduction of •O2- [Citation5]. Such dynamics are difficult to observe using other ROS detection techniques. Moreover, 100 nM SST can still induce the slight T1 reduction around 30 min after treatment (Figure S4B), while there is no significant change when cells were treated with 5 nM SST (Figure S4A). In contrast, the decrease of NO in A549 cells was reported when the cells were treated with 1 µM SST. Thus, T1 relaxometry maybe a more sensitive tool to investigate the cellular radical response upon treatment.
Figure 3. Cellular radical response to low and high concentrations of SST (a), TPP (b), and TAT (c) was measured by T1 relaxometry. Each curve represents an independent experiment on one isolated nanodiamond. (D) the general trend of cellular response to SST, TPP, and TAT treatment. The data is shown as mean ± SD (n = 5).
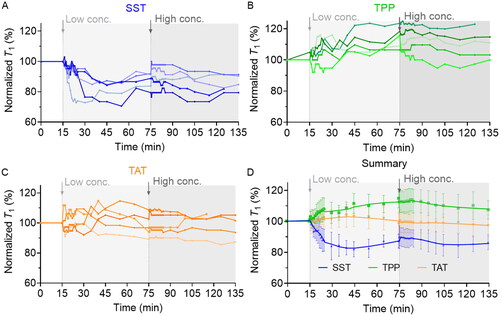
In the second experimental approach, TPP treatment (5 µM and 1 mM) induced a slight increase in T1 (), which refers to a potential decrease in the amount of intracellular radical. It has been reported that TPP (1 µM) could potentially influence the mitochondrial respiratory chain complex I, resulting in inhibitory effects on the electron transport chain, consequently affecting the OCR [Citation39]. When OCR decreased, the whole organismal ROS (containing paramagnetic •O2-, •OH, et al.) production would decrease correspondingly [Citation38, Citation57].
TAT was used as a negative control since no impact on intracellular pathways involved in radical formation has been reported. Interestingly, T1 relaxometry also showed that there was no significant increase in free radical generation during the membrane pass-through process (), which has been found to occur within 5 to 20 min [Citation58].
2.6. Influence of NV–/NV0 charge dynamics, pH, and temperature on T1 relaxation
Charge dynamics between NV–/NV0 have recently been demonstrated to potentially affect the relaxation of the T1 decay of NV– [Citation52]. To verify whether the charge dynamics will affect the all-optical T1 measurements, we performed the T1 measurements with a microwave π flip on fND-NGs inside cells upon treatment with DPBS (Figure S7A). The normalized T1 exhibited a consistent trend in both the all-optical protocol and the microwave-applied protocol (Figure S7D) in our experimental time. This suggests that NV–/NV0 can affect the absolute T1 values. However, at low laser power, the charge dynamics is weak and can be suppressed. Therefore, the T1 relaxation will dominate the process, and the T1 changes will be measured rather than changes in charge dynamics. If the relative T1 changes on the same nanodiamond are prioritized, the all-optical method can still reflect real-time cellular radical dynamics.
The T1 relaxation time could be influenced by temperature changes, which has been studied by T. de Guillebon et al. who could show that the T1 relaxation time is only affected at cryogenic temperature and that T1 shows temperature-independence above 100 K [Citation59]. In addition, according to T. Fujisaku et al. the surrounding pH could also affect T1 [Citation60]. To minimize the potential influence of local pH changes in our experiments, we have incubated fND-NGs for 24 h, to allow sufficient time for endosome and lysosome escape, both compartments characterized by acidic pH. In the cytosol, a constant and physiological pH is present. In addition, we also used DPBS as control to safely exclude the influence of pH and temperature changes in our study.
3. Conclusion
In this study, we have demonstrated the utility of nanodiamond relaxometry to study unprecedented details of free radical response upon targeting moieties treatment. We have developed a pseudo real-time intracellular radical detection method, which allows us to monitor the intracellular free radical response of cells at an early stage under the treatment of SST, TPP, and TAT. We found that SST can upregulate the level of intracellular free radicals. In contrast, TPP show downregulation of the level of intracellular free radical. The TAT did not show any cellular radical response during the membrane penetration process since it is not involved in processes directly regulating intracellular radicals. This type of real-time, early stage radical response under treatment with targeting molecules has not been achieved before. We believe that our method opens a new avenue of understanding the influence of targeting molecules on the role of free radicals in cells and will further our understanding of the fundamental role of various biomolecules and drugs in the formation and scavenging of free radicals in biology.
However, as a newly developed quantum technology, the T1 relaxometry used in this study can only identify the overall cellular response and cannot distinguish specific free radical species. Thereby, sophisticated pulsing techniques such as double electron-electron resonance [Citation61, Citation62], can then be developed to identify specific free radical species to enhance specificities. In addition, cross relaxometry [Citation63] and the latest reported zero-field electron paramagnetic resonance [Citation64] also provided the opportunity to identify the specific radical species. Additionally, the theoretical model can be improved to more accurately quantify the number of radicals in living cells [Citation24], providing more detailed information to understand radical-related signaling pathways. These improvements will bring us into the era of quantum biology.
Authors’ contributions
Kaiqi Wu, Qi Lu: conceptualization, methodology, investigation, writing—original draft and editing. Yingke Wu: conceptualization, writing—original draft and editing, and supervision. Priyadharshini Balasubramanian, Maabur Sow: ODMR set-up, software for data acquisition. Fedor Jelezko, Tanja Weil: conceptualization, supervision, funding acquisition, writing—review and editing.
Supplemental Material
Download MS Word (2.3 MB)Acknowledgements
The authors thank Laura Cheng for her assistance with the T1 relaxometry measurement.
Disclosure statement
No potential conflict of interest was reported by the authors.
Additional information
Funding
References
- Pizzino G, Irrera N, Cucinotta M, et al. Oxidative stress: harms and benefits for human health. Oxidative Med Cell Longev. 2017;2017:1–13.
- Lobo V, Patil A, Phatak A, et al. Free radicals, antioxidants and functional foods: impact on human health. Phcog Rev. 2010;4(8):118–126.
- Okada F. Inflammation and free radicals in tumor development and progression. Redox Rep. 2002;7(6):357–368.
- Nathan C, Cunningham-Bussel A. Beyond oxidative stress: an immunologist’s guide to reactive oxygen species. Nat Rev Immunol. 2013;13(5):349–361.
- Radi R. Oxygen radicals, nitric oxide, and peroxynitrite: redox pathways in molecular medicine. Proc Natl Acad Sci USA. 2018;115(23):5839–5848.
- Knight JA. Review: free radicals, antioxidants, and the immune system. Ann Clin Lab Sci. 2000;30(2):145–158.
- Andrés C, Pérez de la Lastra J, Juan C, et al. The role of reactive species on innate immunity. Vaccines. 2022;10(10):1735.
- Gomes A, Fernandes E, Lima JL. Fluorescence probes used for detection of reactive oxygen species. J Biochem Biophys Methods. 2005;65(2–3):45–80.
- Damle VG, Wu K, Arouri DJ, et al. Detecting free radicals post viral infections. Free Radic Biol Med. 2022;191:8–23.
- Kalyanaraman B, Darley-Usmar V, Davies KJ, et al. Measuring reactive oxygen and nitrogen species with fluorescent probes: challenges and limitations. Free Radic Biol Med. 2012;52(1):1–6.
- Wu Y, Weil T. Recent developments of nanodiamond quantum sensors for biological applications. Adv Sci. 2022;9(19):2200059.
- Schirhagl R, Chang K, Loretz M, et al. Nitrogen-vacancy centers in diamond: nanoscale sensors for physics and biology. Annu Rev Phys Chem. 2014;65(1):83–105.
- Steinert S, Ziem F, Hall LT, et al. Magnetic spin imaging under ambient conditions with sub-cellular resolution. Nat Commun. 2013;4(1):1607.
- Vaijayanthimala V, Tzeng Y, Chang H, et al. The biocompatibility of fluorescent nanodiamonds and their mechanism of cellular uptake. Nanotechnology. 2009;20(42):425103.
- Barton J, Gulka M, Tarabek J, et al. Nanoscale dynamic readout of a chemical redox process using radicals coupled with nitrogen-vacancy centers in nanodiamonds. ACS Nano. 2020;14(10):12938–12950.
- Wu Y, Balasubramanian P, Wang Z, et al. Detection of few hydrogen peroxide molecules using self-reporting fluorescent nanodiamond quantum sensors. J Am Chem Soc. 2022;144(28):12642–12651.
- Maze JR, Stanwix PL, Hodges JS, et al. Nanoscale magnetic sensing with an individual electronic spin in diamond. Nature. 2008;455(7213):644–647.
- Ackermann K, Wort JL, Bode BE. Pulse dipolar EPR for determining nanomolar binding affinities. Chem Commun. 2022;58(63):8790–8793.
- Sigaeva A, Shirzad H, Martinez FP, et al. Diamond-based nanoscale quantum relaxometry for sensing free radical production in cells. Small. 2022;18(44):2105750.
- Sigaeva A, Norouzi N, Schirhagl R. Intracellular relaxometry, challenges, and future directions. ACS Cent Sci. 2022;8(11):1484–1489.
- Nie L, Nusantara AC, Damle VG, et al. Quantum monitoring of cellular metabolic activities in single mitochondria. Sci Adv. 2021;7(21):eabf0573.
- Wu K, Vedelaar TA, Damle VG, et al. Applying NV center-based quantum sensing to study intracellular free radical response upon viral infections. Redox Biol. 2022;52:102279.
- Wu K, Nie L, Nusantara AC, et al. Diamond relaxometry as a tool to investigate the free radical dialogue between macrophages and bacteria. ACS Nano. 2023;17(2):1100–1111.
- Lu Q, Vosberg B, Wang Z, et al. Unraveling eumelanin radical formation by nanodiamond optical relaxometry in a living cell. J. Am. Chem. Soc. 2024;146(11):7222–7232.
- Wu Y, Alam MNA, Balasubramanian P, et al. Nanodiamond theranostic for light-controlled intracellular heating and nanoscale temperature sensing. Nano Lett. 2021;21(9):3780–3788.
- Wu Y, Alam MNA, Balasubramanian P, et al. Fluorescent nanodiamond–nanogels for nanoscale sensing and photodynamic applications. Adv Biomed Res. 2021;1(7):2000101.
- Theodoropoulou M, Stalla GK. Somatostatin receptors: from signaling to clinical practice. Front Neuroendocrinol. 2013;34(3):228–252.
- Zielonka J, Joseph J, Sikora A, et al. Mitochondria-targeted triphenylphosphonium-based compounds: syntheses, mechanisms of action, and therapeutic and diagnostic applications. Chem Rev. 2017;117(15):10043–10120.
- Gump JM, Dowdy SF. TAT transduction: the molecular mechanism and therapeutic prospects. Trends Mol Med. 2007;13(10):443–448.
- Jung HS, Cho KJ, Seol Y, et al. Polydopamine encapsulation of fluorescent nanodiamonds for biomedical applications. Adv Funct Mater. 2018;28(33):1801252.
- Shamsi BH, Chatoo M, Xu X, et al. Versatile functions of somatostatin and somatostatin receptors in the gastrointestinal system. Front Endocrinol. 2021;12:652363.
- Bousquet C, Puente E, Buscail L, et al. Antiproliferative effect of somatostatin and analogs. Chemotherapy. 2001;47(Suppl. 2):30–39.
- Zou Y, Xiao X, Li Y, et al. Somatostatin analogues inhibit cancer cell proliferation in an SSTR2-dependent manner via both cytostatic and cytotoxic pathways. Oncol Rep. 2009;21(2):379–386.
- Sun L, Coy DH. Somatostatin receptor-targeted anti-cancer therapy. CDD. 2011;8(1):2–10.
- Grötzinger C, Wiedenmann B. Somatostatin receptor targeting for tumor imaging and therapy. Ann N Y Acad Sci. 2004;1014(1):258–264.
- Arena S, Pattarozzi A, Corsaro A, et al. Somatostatin receptor subtype-dependent regulation of nitric oxide release: involvement of different intracellular pathways. Mol Endocrinol. 2005;19(1):255–267.
- Akaike T, Maeda H. Nitric oxide and virus infection. Immunology. 2000;101(3):300–308.
- Hou C, Metcalfe NB, Salin K. Is mitochondrial reactive oxygen species production proportional to oxygen consumption? A theoretical consideration. Bioessays. 2021;43(4):e2000165.
- Reily C, Mitchell T, Chacko BK, et al. Mitochondrially targeted compounds and their impact on cellular bioenergetics. Redox Biol. 2013;1(1):86–93.
- Frankel AD, Pabo CO. Cellular uptake of the TAT protein from human immunodeficiency virus. Cell. 1988;55(6):1189–1193.
- Green M, Loewenstein PM. Autonomous functional domains of chemically synthesized human immunodeficiency virus TAT trans-activator protein. Cell. 1988;55(6):1179–1188.
- Kuroda Y, Kato-Kogoe N, Tasaki E, et al. Oligopeptides derived from autophosphorylation sites of EGF receptor suppress EGF-stimulated responses in human lung carcinoma a549 cells. Eur J Pharmacol. 2013;698(1–3):87–94.
- Ruseska I, Zimmer A. Internalization mechanisms of cell-penetrating peptides. Beilstein J Nanotechnol. 2020;11:101–123.
- Sarder P, Nehorai A. Deconvolution methods for 3-D fluorescence microscopy images. IEEE Signal Process Mag. 2006;23(3):32–45.
- Dunn KW, Kamocka MM, McDonald JH. A practical guide to evaluating colocalization in biological microscopy. Am J Physiol-Cell Physiol. 2011;300(4):C723–C742.
- Zhang Y, Sharmin R, Sigaeva A, et al. Not all cells are created equal – endosomal escape in fluorescent nanodiamonds in different cells. Nanoscale. 2021;13(31):13294–13300.
- Stauffer W, Sheng H, Lim H. Ezcolocalization: an imagej plugin for visualizing and measuring colocalization in cells and organisms. Sci Rep. 2018;8(1):15764.
- Martens TF, Remaut K, Demeester J, et al. Intracellular delivery of nanomaterials: how to catch endosomal escape in the act. Nano Today. 2014;9(3):344–364.
- Binder JM, Stark A, Tomek N, et al. Qudi: a modular python suite for experiment control and data processing. SoftwareX. 2017;6:85–90.
- Yanagi T, Kaminaga K, Suzuki M, et al. All-optical wide-field selective imaging of fluorescent nanodiamonds in cells, in vivo and ex vivo. ACS Nano. 2021;15(8):12869–12879.
- Bluvstein D, Zhang Z, Jayich ACB. Identifying and mitigating charge instabilities in shallow diamond nitrogen-vacancy centers. Phys Rev Lett. 2019;122(7):076101.
- Barbosa I, Gutsche J, Widera A. Impact of charge conversion on NV-center relaxometry. Phys Rev B. 2023;108(7):075411.
- Barnett P. Somatostatin and somatostatin receptor physiology. ENDO. 2003;20(3):255–264.
- Hofland LJ, Lamberts SW. The pathophysiological consequences of somatostatin receptor internalization and resistance. Endocr Rev. 2003;24(1):28–47.
- Cakir M, Dworakowska D, Grossman A. Somatostatin receptor biology in neuroendocrine and pituitary tumours: part 1-molecular pathways. J Cellular Molecular Medi. 2010;14(11):2570–2584.
- White RE, Schonbrunn A, Armstrong DL. Somatostatin stimulates Ca2+-activated K+ channels through protein dephosphorylation. Nature. 1991;351(6327):570–573.
- Choi EJ, Jeon CH, Lee IK. Ferric ammonium citrate upregulates PD-L1 expression through generation of reactive oxygen species. J Immunol Res. 2022;2022:1–8.
- Zorko M, Langel U. Cell-penetrating peptides: mechanism and kinetics of cargo delivery. Adv Drug Deliv Rev. 2005;57(4):529–545.
- de Guillebon T, Vindolet B, Roch JF, et al. Temperature dependence of the longitudinal spin relaxation time t1 of single nitrogen-vacancy centers in nanodiamonds. Phys Rev B. 2020;102(16):165427.
- Fujisaku T, Tanabe R, Onoda S, et al. pH nanosensor using electronic spins in diamond. ACS Nano. 2019;13(10):11726–11732.
- Shi FZ, Zhang Q, Wang PF, et al. Single-protein spin resonance spectroscopy under ambient conditions. Science. 2015;347(6226):1135–1138.
- Shi FZ, Kong F, Zhao PJ, et al. Single-DNA electron spin resonance spectroscopy in aqueous solutions. Nat Methods. 2018;15(9):697–699.
- Wood JDA, Tetienne JP, Broadway DA, et al. Microwave-free nuclear magnetic resonance at molecular scales. Nat Commun. 2017;8(1):15950.
- Qin Z, Wang Z, Kong F, et al. In situ electron paramagnetic resonance spectroscopy using single nanodiamond sensors. Nat Commun. 2023;14(1):6278.