
Abstract
Most experimental medical research, if not all of it, heavily relies on statistical analysis. The difficulty of using statistical software is one of the key reasons why many researchers struggle with the data analysis stage. In this article, I discuss some of the user-friendly statistical programs that are accessible for free and ease data analysis for medical researchers and biostatisticians. Researchers can choose the best software by considering the descriptions of the programs, the statistical tests and features offered in each, the graphical features of each, and the strengths and weaknesses of each. Also, I will mention different references to help researchers use each statistical software adequately. Of note, this article reviews 7 statistical programs for use in medical research, namely JASP, Jamovi, BlueSky Statistics, Epi Info, Statistics Kingdom (web-based), SOFA Statistics, PSPP, and G*Power. For basic and common statistical tests, all the programs mentioned are useful and sufficient to complete the data analysis process. However, the best programs for advanced statistical methods are JASP, Jamovi, and BlueSky Statistics. G*Power is the program of choice for sample size and power analyses.
1 Introduction
Experimental studies in medicine usually include statistical analysis. It is well recognized that this process involves the planning, designing, data gathering, analysis, interpretation, and reporting of the study findings (Ali and Bhaskar Citation2016). Lack of statistical support was shown to be one of the hurdles to doing thorough research among physicians and medical students (Barkan Citation2015; Awofeso et al. Citation2020; AlQirem et al. Citation2022; Fida et al. Citation2022). Many researchers find it challenging to perform or comprehend the data analysis procedure. Difficulty in understanding statistics among clinicians trying to understand and use the research literature may be due to certain barriers, like unsuitable presentation of statistics by researchers and poor comprehension of statistics (Redmond and Keenan Citation2002), which also affect researchers’ ability to do statistical analysis. Uncertainty about how to utilize the statistical software is another factor that may contribute to the difficulties of completing data analysis. Although different researchers prefer to use certain types of software because of previous experience in using statistical software and the conviction that the tool used in their past is still the correct choice for data analysis (Cavaliere Citation2015), some statistical software was found to be less popular because of its more complex commands, which are challenging for new users (Masuadi et al. Citation2021). Some of these software programs are unfriendly. That is, they demand that the researcher learn a new programming language, which might be challenging given the researcher’s limited time. One of these “unfriendly” but still powerful programs is R software (Hackenberger Citation2020). As a result, many software programs with user-friendly interfaces (i.e., with an easy-to-use interface and quick access to and implementation of different statistical methods, without the need for coding) were created to make it simple for researchers to do statistical analysis. These programs are becoming more popular nowadays due to their powerful capabilities to perform various statistical analyses on different types of complex data (Solomon et al. Citation2007; Sousa et al. Citation2011; Theodorakis et al. Citation2021). The issue is that many of those software packages are usually expensive and non-open source (Wu and Zhang Citation2011), which prevents many researchers from using them. The Statistical Package for Social Sciences (SPSS) (IBM Corp., Armonk, NY, USA) is a well-known example of paid packages.
As software is a fundamental and vital part of research, yet significant challenges to its’ discoverability exist (Barker et al. Citation2022), this article aims to aid medical researchers in finding free and user-friendly software to analyze their data and aims to review different statistical packages that are freely available and easy to use for medical researchers and biostatisticians. Of note, these packages were specially selected among many free packages as many other packages are not user-friendly, and many were developed a long time ago without new updates, which makes them unable to meet the standards required by modern publishing trends. The packages reviewed may be the best to meet the statistical needs of the medical researcher.
To assist researchers in selecting the best software, each software’s name, benefits, weakness, and graphical features will be highlighted. Of note, searching PubMed for a paper with similar objectives didn’t reveal a similar paper published in the last few years, which highlights the novelty of this article.
2 Software
2.1 JASP
Jeffreys’s Amazing Statistics Program (JASP) (JASP Team, 2023. https://jasp-stats.org/) is a user-friendly statistical software supported by the University of Amsterdam. The software has come to attention in the last few years as the leading software for Bayesian analysis. However, it is a powerful software when it comes to classical (frequentist) statistics. A lot of basic and advanced statistical procedures are available within the software. A notable difference between it and other software is that it doesn’t open Excel files with the extension (xlsx), which requires the author to save his data file in a CSV format before data import. After importing the data, the author can do different statistical analyses, including descriptive and inferential statistics. The researcher can create tables with counts and percentages of specific variables, obtain various statistics (such as means, medians, quartiles, normality tests, confidence intervals for various statistics, etc.), create a wide range of charts (such as bar, pie, Likert, dot, and other charts), and perform both conventional and advanced statistical methods (such as various types of t-tests, ANOVA, regression, mixed models, factor analyses, meta-analyses, power analyses, etc.). For example, the software provides the option to conduct exploratory factor analysis based on polychoric correlations, which is very helpful for researchers conducting factor analysis on Likert items (James Citation2014). This feature is not present in the latest version of SPSS (Version 29) and is not even present in many other types of software. Additionally, the program offers machine learning-based techniques including boosting regression, kNN regression, several classification techniques, and many others. The software also provides some survival analyses (like Kaplan-Meier curves, Log-rank test, and Peto & Peto test). Other important analyses in medical research such as sensitivity, specificity, PPV, and NPV are available under “Learn Bayes” package. In conclusion, this program, which can be downloaded from the aforementioned URL, is one of the best in my view for researchers searching for free and user-friendly software. For further reading on how to use JASP, please refer to the book (Statistical Analysis for JASP: A Guide for Students) by Mark A. Gross-Sampson.
2.2 Jamovi
Jamovi (The jamovi project (2023). https://www.jamovi.org) is another free and powerful software developed by researchers who participated in the development of JASP. Compared to JASP, there aren’t many distinctions between the two programs. Both were built on R statistical language (beside other programming languages), but unlike JASP, Jamovi permits the import of data in the (.xlsx) format. Additionally, Jamovi uses several advanced statistical techniques that are uncommon in other software. Latent class analysis, polychoric and tetrachoric correlations, among other techniques, are some of these. The majority of the statistical methods described in the JASP software section are available in Jamovi, including meta-analyses. Under the (meddecide) package, Jamovi offers medical statistical analyses, such as sensitivity, specificity, and others, which are frequently required in medical research. As a result, it could be chosen by medical researchers similarly to JASP. Jamovi’s interface is the same as JASP’s, and both are utilized identically. For further reading on how to use Jamovi, please refer to the book (Learning statistics with jamovi: a tutorial for psychology students and other beginners) by Danielle Navaro and David Foxcroft.
2.3 BlueSky Statistics
BlueSky Statistics software (BlueSky Statistics LLC, Chicago, IL, USA. https://www.blueskystatistics.com/) is an R language-based software that has a commercial and free-to-use version. The difference between the two versions is not big. The free version does provide a huge number of analyses that enable any researcher to do common and advanced statistics as those mentioned in JASP section. A notable feature in BlueSky Statistics is that it enables the researcher to create a design for his experiment, which helps him in defining the effect of factors on the response variable. In detail, researcher can upload factor details (factors and levels), create several different types of design, inspect a design, plot a design, export a design, import design responses, and modify a design. The program offers a broad range of commands on many distributions, such as making a plot for a certain distribution, generating a sample from a specific distribution, and more. Of note, the world-renowned Mayo Clinic recently announced the use of BlueSky Statistics in their research, which was noted in research published by researchers affiliated with the institute (e.g., references Tabaja et al. Citation2022; Schmidt et al. Citation2023; Chesdachai et al. Citation2023). This highlights the power of the software for medical researchers. For further reading on how to use BlueSky Statistics, please refer to the book (BlueSky Statistics User Guide) by Robert A. Muenchen.
2.4 PSPP
PSPP (Free Software Foundation. GNU PSPP. Boston, MA. https://www.gnu.org/software/pspp/\%22) was known to be the free alternative to SPSS (before the appearance of other user-friendly free software). The software is good and easy to use, especially for users who are familiar with SPSS. However, when it comes to the available statistical methods, the three aforementioned software are much better than PSPP. The software does not have many advanced statistical techniques, but if you are familiar with SPSS and willing to perform the common statistical tests, the software can be helpful. For further reading on how to use PSPP, please refer to the book (The PSPP Guide: An Introduction to Statistical Analysis) by Christopher P. Halter.
2.5 Epi Info
Epi Info (Epi Info, CDC, Atlanta, GA, USA, 2011. https://www.cdc.gov/epiinfo/) is a free statistical software developed by the Center for Disease Control (CDC) for epidemiology and public health researchers. The program enables the researcher to input data, create charts, tables, and perform typical inferential statistics using the (Visual Dashboard) option. All he has to do is right-click using the mouse on the empty screen, set the data source, and then right-click again to add the analysis gadget. Additionally, the program makes it simple for the researcher to determine the required sample size for several study types under the (StatCalc) option, including cohort studies, population surveys, and other ones. The software can also be used to create forms that may be used in surveys and other types of research. For further reading on how to use Epi Info, please refer to the Epi Info User Guide, which is available via the aforementioned link.
2.6 Statistics Kingdom (web-based)
Statistics Kingdom (Statistics Kingdom, 2017; http://www.statskingdom.com/) is a website that allows the researcher to do the common statistical techniques. As stated by developers, the statistical analyses of the website were validated based on comparisons with R software. After choosing the analysis he wants, the researcher can copy the data and paste it into the data field, which allows him to easily obtain the results after that. The website provides excellent data visualization through a variety of charts. A noteworthy feature of the website in comparison to the other aforementioned software is that it offers a thorough textual explanation of the inferential statistics findings. This website is probably the best option for individuals who want to complete their statistical analysis quickly, don’t have enough space on their devices to download software or require a deeper understanding of the results of the statistical test.
2.7 SOFA Statistics
Statistics Open For All (SOFA) Statistics (SOFA Statistics, Paton-Simpson & Associates Ltd, Auckland, New Zealand. http://www.sofastatistics.com/) is another software that is good for researchers willing to conduct common and basic analyses on their data. The software allows the researcher to import his data and generate tables easily after defining the rows and tables. Also, multiple types of charts can be generated. However, when it comes to the available statistical tests, the software only provides some common statistical tests (e.g., Chi-square, t-test, ANOVA, etc.). Regression analysis is not available, and advanced statistical methods are also not available. Thus, it may not be preferred unless the researcher is willing to conduct common statistical tests. A user guide is available via the aforementioned link for researchers who face difficulty in using the software.
2.8 G*Power (for sample size and power analysis)
G*Power (Faul et al. Citation2007) is a special software used for sample size calculation and power analysis. It enables the researcher to estimate the suitable sample size for different statistical tests via the a priori choice. Furthermore, post hoc analysis is also available to allow the researcher to find out the obtained power. The software may be complicated and hard to use for some users. For further reading on how to use G*Power, I would recommend the book (Determining Sample Size and Power in Research Studies: A Manual for Researchers) by JP Verma and Priyam Verma.
summarizes the strengths and weaknesses of each of the programs mentioned, and shows the graphing capabilities of each.
Table 1 Summary of strengths and weaknesses of each of the reviewed programs.
Table 2 Summary of graphical capabilities of each software.
3 Discussion
Since many programs have been developed to enhance the data analysis process, user-friendly programs are increasingly being used in different fields, such as education, medicine, and others (Ozgur et al. Citation2015). The use of statistical analysis software in fields other than medicine has been discussed in various papers (Nunes et al. Citation2015; Spicer et al. Citation2017). However, for the medical field, there is a need to review user-friendly free software, which is reviewed in this article.
For basic statistical tests, which are the most common methods used in medical research (e.g., descriptive statistics, Chi-square or Fisher’s exact test, t-tests, analysis of variance, Mann-Whitney U, correlation, and linear and logistic regression (Meyr Citation2010; Hayat et al. Citation2017)) all programs mentioned will be useful and sufficient to complete the data analysis process, except for SOFA Statistics, which cannot be used for regression. For advanced statistical methods, the researcher needs to be selective in choosing the appropriate software.
Although a good description of the strengths and weaknesses of each of the programs mentioned has been provided, some statistical techniques may require the researcher to use a specific program, among others. For example, if a public health researcher is willing to construct a scale to identify some underlying factor, he or she may need to conduct an exploratory factor analysis (Schreiber Citation2021). For this method, JASP is the best among the mentioned programs because it provides a variety of rotations and retention criteria in an easy and time-saving way (see an example of research using JASP for this method in Ashour and Funjan Citation2022). However, if the researcher is willing to perform latent class analysis (example in Schmidt et al. Citation2022), then Jamovi is a better choice due to the availability of this method in it.
In another example, a researcher is willing to measure the association between two ordinal variables but—not surprisingly—finds them to be highly skewed. Many medical researchers approach this problem by performing a log transformation of the data, which has been criticized in previous research (Feng et al. Citation2014). A powerful alternative for dealing with such data is polychoric correlation (Annarita and Pollice Citation2007; Moss and Grønneberg Citation2023), which can be performed using Jamovi or BlueSky Statistics. Another similar correlation for dichotomous variables, tetrachoric correlation, can also be performed via the two aforementioned programs.
For researchers considering survival analysis (an analysis widely used in medical research (Shreffler and Huecker Citation2023)) using Kaplan-Meier curves, log-rank tests, or Cox proportional hazards regression, it would be appropriate to use Statistics Kingdom, BlueSky Statistics, Jamovi, or JASP. For time series analyses, JASP, Jamovi, and BlueSky Statistics are the programs of choice.
For analysis of scale reliability and inter-rater agreement, JASP is the best choice. It provides many reliability statistics, such as Cronbach’s alpha, McDonald’s omega, Greatest Lower Bound, and others. Note that some of these statistics are not available in many paid statistical packages. For rater agreement, one special advantage of JASP is the ability to obtain Krippendorff’s alpha coefficient, which has the advantage of being highly flexible with respect to the measurement scale and number of raters and can also handle missing values (Zapf et al. Citation2016).
Many researchers in the medical and biological fields tend to control for random effects using mixed-effects models. Furthermore, these models are used in longitudinal studies where the assumptions of repeated-measures ANOVA do not hold, such as in the case of variable repeated-measures intervals and missing data (de Melo et al. Citation2022). For researchers who want to perform linear or generalized linear mixed models, JASP, Jamovi, and BlueSky Statistics are good choices. If the researcher is willing to use generalized estimating equations, BlueSky Statistics is the ideal choice.
Meta-analysis is a very common and important statistical technique in medical research. It is a quantitative and formal epidemiological study design used to systematically evaluate previous research studies to draw conclusions about a particular medical topic (Haidich Citation2010). Due to its importance, several statistical programs have been developed for meta-analysis synthesis, and several published papers have discussed it in detail (Suurmond et al. Citation2017; Balduzzi et al. Citation2019; Ma et al. Citation2019; Daly and Soobiah Citation2022). Regarding the software reviewed, JASP and Jamovi can be used to perform a meta-analysis. In my opinion, JASP is the best because it provides multiple types of meta-analysis.
Machine learning makes important contributions in a variety of clinical fields today (Rowe Citation2019). Machine learning models such as random forest, XGBoost, neural networks, and support vector machine have been used to analyze data in recent research (Jamin et al. Citation2021; Zhao et al. Citation2022). However, the lack of interpretability in machine learning-based predictive models can undermine confidence in those models, especially in healthcare (Petch et al. Citation2022). Furthermore, a systematic review showed that the most common machine learning models used for data analysis (i.e., classification trees, random forests, artificial neural networks, and support vector machines) have no evidence of superior performance compared to logistic regression for clinical prediction modeling (Christodoulou et al. Citation2019). These results may indicate a declining preference for machine learning modeling in medical research, but since the benefits of this approach still exist, it is useful to help researchers choose software for machine learning modeling. Among the programs reviewed, JASP, Jamovi, and BlueSky Statistics provide different machine learning-based methods for analyzing data, and JASP is perhaps the best and richest one.
All the reviewed packages are easy to use, and their user-friendly interface allow the researcher to import data, conduct a statistical test, and export the results in few clicks. If we compared the ease of use, probably Statistics Kingdom may be little harder than the others as the researcher may be obligated to copy and paste his data into the website before generating a chart or conducting an analysis.
It should be noted that some of the mentioned programs are updated by developers from time to time. Therefore, the specifications highlighted in this article may be updated in future versions of the software, providing more statistical methods. Software bugs, which are inevitable in any software (Goyal and Sardana Citation2020), are also reported and fixed periodically in many of the mentioned programs. Such bugs may be reported via the software’s websites, which also provides support for users.
3.1 A comparison for graphical outputs of reviewed packages
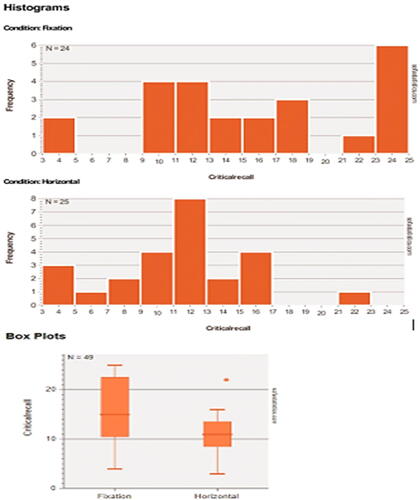
Since showing the quality of the graphical output of the reviewed packages would help the reader choose the right software for his or her needs, I will do a comparison for the graphical output of the reviewed packages. The “Horizontal Eye Movements” dataset, which was originally collected in the research of Matzke et al. (Matzke et al. Citation2015), was used to generate the descriptive graphs. The dataset provides the number of words recalled by two groups of participants (n = 49). During the retention period and prior to recall, one group was instructed to fixate on a centrally presented dot, and the other group was instructed to perform horizontal saccades. The dependent variable was the number of memorized words, and it was compared in Matzke et al. study between the two groups.
Here, distribution plots (histograms) and box plots for the dependent variable in the two groups will be displayed. It should be noted that the Shapiro-Wilk test revealed that the data of both groups had a normal distribution (p > 0.05), but the group’s data did not have equal variance according to Levene’s test (p = 0.009), which violates the assumption of homoscedasticity. Thus, a two-sided Welch’s t-test was performed and it revealed a statistically significant difference between the two groups, with the Fixation group having a higher average number of words memorized compared to the Horizontal group (p = 0.007, means: 15.3 vs. 10.9 words, Glass’ delta = 1.02). Following are the graphical outputs for each software ().
Fig. 1 JASP descriptive graphical output for numerical data.
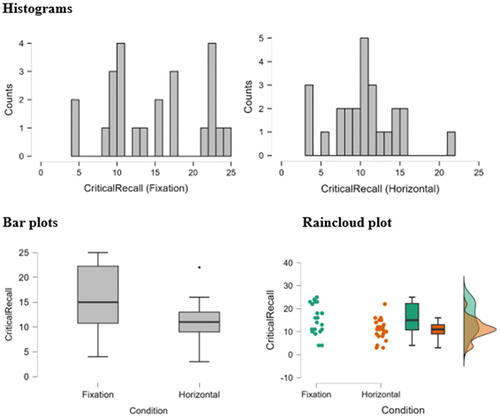
Fig. 2 Jamovi descriptive graphical output for numerical data.
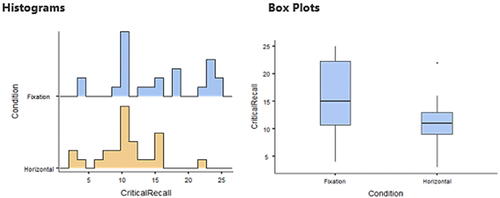
Fig. 3 BlueSky Statistics descriptive graphical output for numerical data.
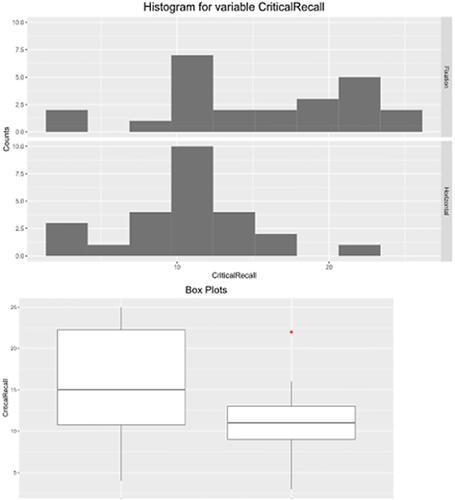
Fig. 4 Epi info descriptive graphical output for numerical data (box plot isn’t available).
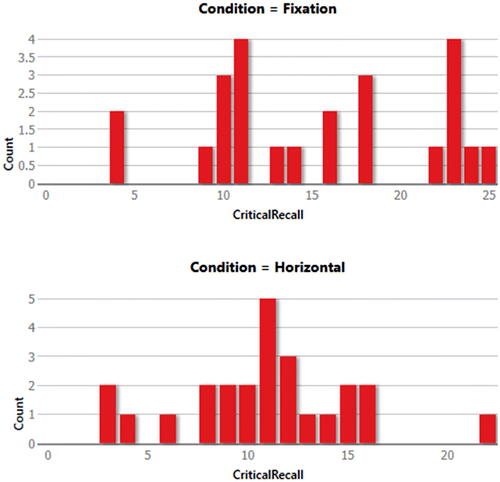
Fig. 5 Statistics kingdom descriptive graphical output for numerical data.
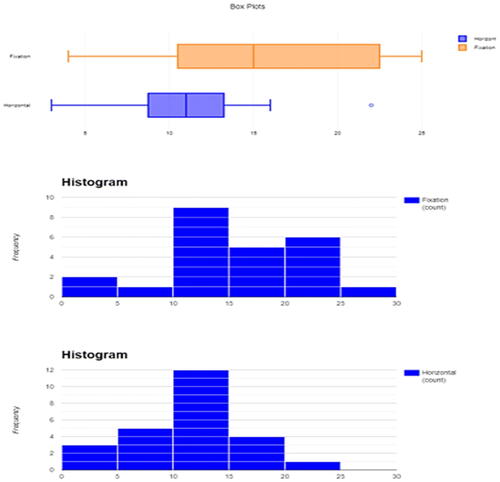
Fig. 6 PSPP descriptive graphical output for numerical data (stratification is not available).
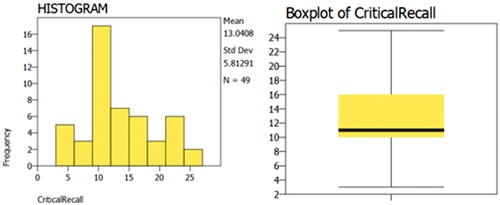
Fig. 7 SOFA Statistics descriptive graphical output for numerical data.
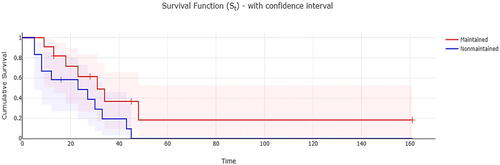
To further detail the graphical features of the reviewed packages, another example concerning survival analysis is included. To show the Kaplan-Meier curves of 4 reviewed packages, the “Leukemia” dataset, which was adopted from Miller’s book “Survival Analysis” (Miller Citation1997), was used. The data compared survival rates between acute myeloid leukemia patients who received maintenance chemotherapy and those who did not receive maintenance chemotherapy (n = 23). Of note, Kaplan-Meier curves (presented with 95% confidence interval) revealed that those who didn’t have maintenance chemotherapy had lower survival rates (), but the difference between them and the other group was not statistically significant, as revealed by the Log-rank test (p = 0.065).
Fig. 8 Kaplan-Meier Curves with risk table for acute myeloid leukemia patients with and without maintenance therapy (Jamovi).
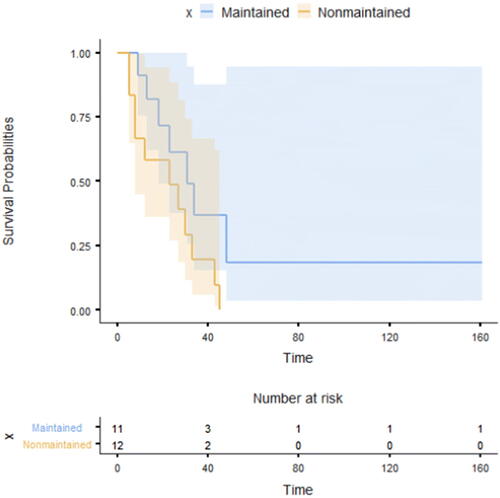
Fig. 9 Kaplan-Meier Curves with risk table for acute myeloid leukemia patients with and without maintenance therapy (JASP).
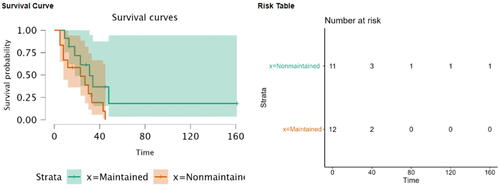
Fig. 10 Kaplan-Meier Curves with risk table for acute myeloid leukemia patients with and without maintenance therapy (BlueSky Statistics).
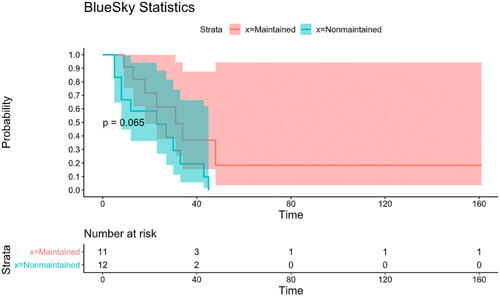
Fig. 11 Kaplan-Meier Curves (risk table isn’t available) for acute myeloid leukemia patients with and without maintenance therapy (Statistics kingdom).
4 Conclusion
One of the crucial stages of experimental medical research is statistical analysis. I have reviewed several free and user-friendly programs in this article that medical researchers and biostatisticians may use to analyze data. This helps them choose the best software and enables unfunded researchers to manage the analysis process without using expensive software. The best programs discussed are JASP, Jamovi, and BlueSky Statistics, as they offer different advanced statistical methods. Of course, a biostatistician can choose the best software according to his needs.
Disclosure statement
The author declares no conflict of interests.
References
- Ali Z, Bhaskar SB. 2016. Basic statistical tools in research and data analysis [published correction appears in Indian J Anaesth. 2016 Oct;60(10): 790]. Indian J Anaesth. 60:662–669.
- AlQirem L, Al-Huneidy L, Hammouri M, Taha H, Al-Somadi H, Al-Bitar F, Kitaneh R, Al-Huneidy Y, Al-Somadi H, Ashour O, et al. 2022. Perceived barriers towards the importance and application of medical research: a source of gender disparity among medical undergraduates [published correction appears in BMC Med Educ. 2022 Dec 19;22(1):879]. BMC Med Educ. 22:767.
- Annarita R, Pollice A. 2007. A generalization of the polychoric correlation coefficient. In: Zani S, Cerioli A, Riani M, Vichi M, editors. Data analysis, classification and the forward search. Berlin: Springer. p. 135–142.
- Ashour L, Funjan K. 2022. Determining required teaching methods in distance undergraduate medical education based on the non-university learning methods medical students used during Covid-19: an exploratory factor analysis. Curr Health Sci J. 48:398–406.
- Awofeso OM, Roberts AA, Okonkwor CO, Nwachukwu CE, Onyeodi I, Lawal IM, Ebrubaoghene O, Osakwe GI, Buchi-Njere O, Solahudeen ZO, et al. 2020. Factors affecting undergraduates’ participation in medical research in Lagos. Niger Med J. 61:156–162.
- Balduzzi S, Rücker G, Schwarzer G. 2019. How to perform a meta-analysis with R: a practical tutorial. Evid Based Ment Health. 22:153–160.
- Barkan H. 2015. Statistics in clinical research: important considerations. Ann Card Anaesth. 18:74–82.
- Barker M, Chue Hong NP, Katz DS, Lamprecht A-L, Martinez-Ortiz C, Psomopoulos F, Harrow J, Castro LJ, Gruenpeter M, Martinez PA, et al. 2022. Introducing the FAIR Principles for research software. Sci Data. 9:622.
- Cavaliere R. 2015. How to choose the right statistical software?-a method increasing the post-purchase satisfaction. J Thorac Dis. 7:E585–E598.
- Chesdachai S, Yetmar ZA, Ranganath N, et al. 2023. Antifungal susceptibility pattern of Candida glabrata from a referral center and reference laboratory: 2012–2022. J Fungi. 9:821.
- Christodoulou E, Ma J, Collins GS, Steyerberg EW, Verbakel JY, Van Calster B. 2019. A systematic review shows no performance benefit of machine learning over logistic regression for clinical prediction models. J Clin Epidemiol. 110:12–22.
- Daly C, Soobiah C. 2022. Software to conduct a meta-analysis and network meta-analysis. Methods Mol Biol. 2345:223–244.
- de Melo MB, Daldegan-Bueno D, Menezes Oliveira MG, de Souza AL. 2022. Beyond ANOVA and MANOVA for repeated measures: advantages of generalized estimated equations and generalized linear mixed models and its use in neuroscience research. Eur J Neurosci. 56:6089–6098.
- Faul F, Erdfelder E, Lang AG, Buchner A. 2007. G*Power 3: a flexible statistical power analysis program for the social, behavioral, and biomedical sciences. Behav Res Methods. 39:175–191.
- Feng C, Wang H, Lu N, Chen T, He H, Lu Y, Tu XM. 2014. Log-transformation and its implications for data analysis [published correction appears in Gen Psychiatr. 2019 Sep 6;32(5):e100146corr1]. Shanghai Arch Psychiatry. 26:105–109.
- Fida T, Zain Ul Abiddin, Yasin F, Mehmood Q. The inclination of undergraduate students at King Edward Medical University towards research and its perceived barriers and facilitators; a cross-sectional study.Ann Med Surg (London). 2022;81:104502.
- Goyal A, Sardana N. 2020. Performance assessment of bug fixing process in open source repositories. Procedia Comput Sci. 167:2070–2079.
- Hackenberger BK. 2020. R software: unfriendly but probably the best. Croat Med J. 61:66–68.
- Haidich AB. 2010. Meta-analysis in medical research. Hippokratia. 14:29–37.
- Hayat MJ, Powell A, Johnson T, Cadwell BL. 2017. Statistical methods used in the public health literature and implications for training of public health professionals. PLoS One. 12:e0179032.
- James B. 2014. Improving your exploratory factor analysis for ordinal data: a demonstration using FACTOR. Pract Assess Res Eval. 19:5.
- Jamin A, Abraham P, Humeau-Heurtier A. 2021. Machine learning for predictive data analytics in medicine: a review illustrated by cardiovascular and nuclear medicine examples. Clin Physiol Funct Imaging. 41:113–127.
- Ma T, Huo Z, Kuo A, Zhu L, Fang Z, Zeng X, Lin C-W, Liu S, Wang L, Liu P, et al. 2019. MetaOmics: analysis pipeline and browser-based software suite for transcriptomic meta-analysis. Bioinformatics. 35:1597–1599.
- Masuadi E, Mohamud M, Almutairi M, Alsunaidi A, Alswayed AK, Aldhafeeri OF. 2021. Trends in the usage of statistical software and their associated study designs in health sciences research: a bibliometric analysis. Cureus. 13:e12639.
- Matzke D, Nieuwenhuis S, van Rijn H, Slagter HA, van der Molen MW, Wagenmakers EJ. 2015. The effect of horizontal eye movements on free recall: a preregistered adversarial collaboration. J Exp Psychol Gen. 144:e1–e15.
- Meyr AJ. 2010. A 5-year review of statistical methods presented in The Journal of Foot & Ankle Surgery. J Foot Ankle Surg. 49:471–474.
- Miller R. 1997. Survival analysis. New York: Wiley.
- Moss J, Grønneberg S. 2023. Partial identification of latent correlations with ordinal data. Psychometrika. 88:241–252.
- Nunes CA, Alvarenga VO, de Souza Sant’Ana A, Santos JS, Granato D. 2015. The use of statistical software in food science and technology: advantages, limitations and misuses. Food Res Int. 75:270–280.
- Ozgur C, Kleckner M, Li Y. 2015. Selection of statistical software for solving big data problems. SAGE Open. 5:215824401558437.
- Petch J, Di S, Nelson W. 2022. Opening the black box: the promise and limitations of explainable machine learning in cardiology. Can J Cardiol. 38:204–213.
- Redmond AC, Keenan AM. 2002. Understanding statistics. Putting p-values into perspective. J Am Podiatr Med Assoc. 92:297–305.
- Rowe M. 2019. An introduction to machine learning for clinicians. Acad Med. 94:1433–1436.
- Schmidt RD, Feaster DJ, Horigian VE, Lee RM. 2022. Latent class analysis of loneliness and connectedness in US young adults during COVID-19. J Clin Psychol. 78:1824–1838.
- Schmidt WM, Perera ND, Buadi FK, Hayman SR, Kumar SK, Dispenzieri A, Dingli D, Cook J, Lacy MQ, Kapoor P, et al. 2023. Long-term outcomes of allogeneic stem cell transplant in multiple myeloma. Blood Cancer J. 13:126.
- Schreiber JB. 2021. Issues and recommendations for exploratory factor analysis and principal component analysis. Res Social Adm Pharm. 17:1004–1011.
- Shreffler J, Huecker MR. 2023. Survival analysis. In: StatPearls. Treasure Island (FL): StatPearls Publishing.
- Solomon J, Raymont V, Braun A, Butman JA, Grafman J. 2007. User-friendly software for the analysis of brain lesions (ABLe). Comput Methods Programs Biomed. 86:245–254.
- Sousa LCDdM, Filho HLAS, Von Glehn CdQC, da Silva AS, Neto PdAdS, de Castro JAF, do Monte SJH. 2011. EpHLA: an innovative and user-friendly software automating the HLAMatchmaker algorithm for antibody analysis. Transpl Immunol. 25:210–216.
- Spicer R, Salek RM, Moreno P, Cañueto D, Steinbeck C. 2017. Navigating freely-available software tools for metabolomics analysis. Metabolomics. 13:106.
- Suurmond R, van Rhee H, Hak T. 2017. Introduction, comparison, and validation of meta-essentials: a free and simple tool for meta-analysis. Res Synth Methods. 8:537–553.
- Tabaja H, Yuen J, Tai DBG, Campioli CC, Chesdachai S, DeSimone DC, Hassan A, Klassen BT, Miller KJ, Lee KH, et al. 2022. Deep brain stimulator device infection: the Mayo Clinic Rochester experience. Open Forum Infect Dis. 10:ofac631.
- Theodorakis E, Antonakis AN, Baltsavia I, Pavlopoulos GA, Samiotaki M, Amoutzias GD, Theodosiou T, Acuto O, Efstathiou G, Iliopoulos I, et al. 2021. ProteoSign v2: a faster and evolved user-friendly online tool for statistical analyses of differential proteomics. Nucleic Acids Res. 49:W573–W577.
- Wu Y, Zhang L. 2011. Comparison of two academic software packages for analyzing two-dimensional gel images. J Bioinform Comput Biol. 9:775–794.
- Zapf A, Castell S, Morawietz L, Karch A. 2016. Measuring inter-rater reliability for nominal data - which coefficients and confidence intervals are appropriate? BMC Med Res Methodol. 16:93.
- Zhao Y, Zhang R, Zhong Y, Wang J, Weng Z, Luo H, Chen C. 2022. Statistical analysis and machine learning prediction of disease outcomes for COVID-19 and pneumonia patients. Front Cell Infect Microbiol. 12:838749.