
Abstract
Background
Time Activity Data (TAD) describe the timing, duration, and/or frequency of human activities. Given that activity dictates the rate of contact a person has with an environmental agent, activity data can be used to derive rigorous estimates of exposure. TAD has been used to support exposure estimation in a variety of contexts, although there has been no systematic characterization of how TAD has been collected for environmental health applications.
Objectives
We propose a systematic evidence map protocol in pursuit of describing the body of environmental health literature that collects TAD to estimate exposure to chemical, biological, and physical agents. Our work proposes a novel definition for TAD, identifies studies collecting TAD, compiles a list of terms used to describe TAD, and summarizes how this data has been collected to estimate various environmental exposures.
Methods
This protocol details the proposed search strategy, which targets environmental exposure studies that collect information on human activities and when they occur, using Population-Exposure-Method (PEM) criteria. From each study, we will extract data that will be categorized according to a codebook that we develop. In order to refine and improve our methodology iteratively, we will use reflexive journaling to ensure that the data collected are coded and summarized appropriately.
Discussion
We will produce an open-source database and a systematic evidence map depicting the patterns, trends, and gaps existing in the current body of environmental health literature that collects TAD to estimate exposure to environmental agents. Researchers will be able to use this evidence map to assess prominent themes and may reference the database to identify specific studies collecting TAD, which can inform future environmental health research.
1. Introduction
1.1. Rationale
We define time activity data (TAD) as information describing the timing, duration, and/or frequency of when human activities occur. Activity information accounts for variability on the individual level (Hubal and Cohen Hubal Citation2023), which may provide a more precise estimate of exposure. Utilizing TAD may limit exposure misclassification, since it does not rely on population-level behavioral assumptions but rather on data collected from individual study participants.
Environmental health researchers use a variety of terms to refer to this type of data (e.g. activity pattern data, time activity pattern, time activity diary, time-location pattern) and often collect different forms of data (e.g. only activity; only location; both activity and location). The U.S. Environmental Protection Agency uses the International Society of Exposure Science (ISES)’s definition of activity pattern data, which they define as “information on human activities used in exposure assessments [which] may include a description of the activity, frequency of activity, duration spent performing the activity, and the microenvironment in which the activity occurs,” (Glossary of Terms Citation2011; Zartarian et al. Citation2005).
We find this definition to be insufficient since it considers microenvironmental information as a surrogate for activity and activities can vary drastically within a given microenvironment (Duan et al. Citation2022). Human activity may impact intake rates, which is a notable predictor of exposure (Klepeis et al. Citation2001). The ISES and EPA’s definition also does not necessitate that TAD requires a time element (i.e. the timing, duration, or frequency of an activity), despite time being an essential component of estimating exposure. Our definition of TAD seeks to address both of these insufficiencies by accounting for both time and activity information.
The use of TAD in environmental health research has increased since 2000, as demonstrated in Supplementary Figure 1. We identified six reviews summarizing studies collecting data that fit our definition of TAD. Three of the existing reviews examine studies estimating air pollution exposures (Branco et al. 2014; Borghi et al. 2021; Ma et al. 2020). Branco et al. found that using a microenvironmental modeling approach has multiple advantages over other methods of exposure estimation that do not account for time activity information and emphasized the need for more studies estimating children’s air pollution exposure. Borghi et al. identified 26 microenvironments across 46 studies in which air pollution exposure has been studied using a microenvironmental approach. Borghi et al. found that the majority of these studies focused on particulate matter exposure, and recommended that future research examine other air pollutants and occupational microenvironments (Borghi et al. 2021). Ma et al. identified methods of TAD collection commonly used in monitoring children’s time activity (time activity diaries, GPS trackers, online apps, and GIS-based tools) and found that commuting to school contributes significantly to children’s air pollution exposure (Ma et al. 2020).
Among the other environmental agents studied in the existing reviews, one review (Monroe et al. 2019) identified common nighttime activities associated with malaria transmission and how certain time activity patterns impact exposure. Two reviews estimated children’s ultraviolet (UV) radiation exposure (Wang et al. 2018; Wright and Reeder 2005). Wang et al. discussed the utility of various TAD collection methods in understanding children’s myopia as a result of sun exposure. They found that questionnaires have good compliance overall but are subject to recall error and bias, and that electronic questionnaires are more efficient than paper questionnaires (Wang et al. 2018). Wright and Reeder ultimately found that additional research examining children’s activity patterns is required to better understand the relationship between youth activity and UV exposure (Wright and Reeder 2005).
While these reviews provide information on the specific exposures they seek to characterize, there currently exists no comprehensive review that examines studies collecting TAD to estimate exposure to all chemical, biological, and physical agents, with no restriction on exposure route(s), population(s), and human activities. This literature gap demonstrates the need for a systematic evidence map that can allow researchers to characterize the body of environmental health literature collecting TAD.
1.2. Objectives
We will build a publicly available database of environmental health literature collecting TAD for the purpose of chemical, biological, and physical agent estimation. While quantitative individual behavior information from a broader context can be used to support the estimation of exposure to environmental hazards, this SEM is limited to studies in the field of environmental health. Using this database, we will characterize the methods used to collect TAD, as well as the populations; activities; and agents (if applicable) studied using TAD. Additionally, we will analyze the metadata of these studies and identify the terms used to describe TAD. We will identify any trends, patterns, or gaps existing in the literature and will present these findings in the form of a systematic evidence map.
2. Methods
2.1. Eligibility criteria
This review will use a Population-Exposure-Method (PEM) framework as its eligibility criteria. Given that the aim of this research is to provide an overview of the environmental health literature generating TAD, the Population in this review will include all individuals in the general human population. Our Exposure criteria limit the search to studies that generate TAD for use in the study itself or for future environmental health applications (e.g. epidemiologic studies, exposure estimation, or development of activity factors). Three classes of environmental agents will be considered (chemical, biological, and physical agents). For the purpose of this research, a chemical agent will be defined as a substance that adversely impacts health through toxicological mechanisms. A biological agent will include any toxin, bacteria, virus, parasite, prion, or fungi that causes infection or disease. Physical agents will include non-chemical and non-biological agents that can harm human health, such as extreme temperatures, radiation, noise, and light. This research will not consider mechanical hazards (e.g. vibration, lifting) or psychosocial hazards (e.g. violence, stress) (Institute of Medicine 1995) in its analysis. The Methods included in this review will be all methods used to generate TAD, such as videography (Beamer et al. Citation2008), direct observation (Ezzati et al. Citation2000), 24-h recall diaries (Demirel et al. Citation2014), among others. Our review will only include peer-reviewed studies in English published after January 1, 1980. We will exclude any protocols, proposals, systematic reviews, and book chapters.
2.2. Information sources
We will search the National Institutes of Health’s PubMed and Elsevier’s Scopus databases. PubMed was chosen for this review because it is considered a premier search engine for biomedical and health science research. Scopus was selected because of its broad coverage of non-biomedical literature, including the social sciences. No gray literature or trial registers will be considered as part of this review. The search will be conducted on December 15, 2023, with a repeat search conducted on March 1, 2024 to identify any new studies eligible for inclusion.
2.3. Search strategy
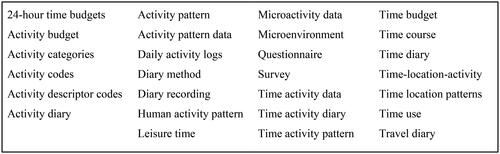
To develop a list of keywords, we consulted studies we knew collected data that fits our definition of TAD. Some of these studies were identified by scanning the “Activity Factors’’ chapter of the U.S. EPA’s Exposure Factors Handbook (“Chapter 16. Activity Factors” Citation2011). The final list of studies used to identify keywords is listed in Supplementary Information 5.6.2. Once we developed a list of keywords, we inputted each initial keyword into PubMed with the “Environmental Exposure” MeSH term (National Center for Biotechnology Information, n.d.) and scanned the titles and abstracts of the first approximately 30 returned studies. If we found that at least one study returned by a search of a given keyword adhered to our PEM criteria, we retained the keyword in our list of final keywords (see Final Keywords in ). Simultaneously, any new keywords we found during this iterative process were added to the activity term of our final proposed search strategy and are displayed in Final Keywords in . In addition to our activity term, our proposed search strategy includes a time term and an exposure term.
Figure 1. Initial and final keywords.
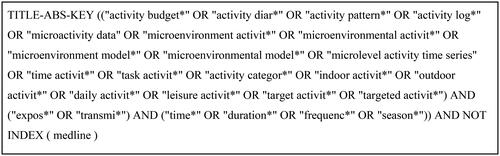
We converted the PubMed search strategy to Scopus, which is depicted in . On October 20, 2023, we conducted a pilot search of our proposed search strategies for PubMed and Scopus, which yielded 3,257 and 2,178 articles, respectively. We validated these searches using benchmark studies that we identified earlier when developing our list of keywords (Supplementary Figure 5.6.2). All benchmark studies fit our PEM criteria and are returned by our proposed search strategy.
Figure 2. Proposed search strategy for PubMed.
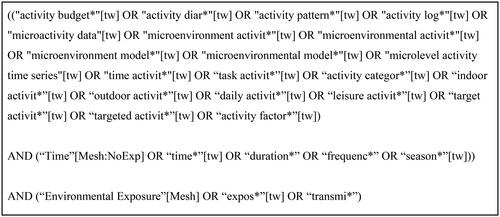
Figure 3. Proposed search strategy for Scopus.
2.4. Screening process
The systematic review software Covidence will be used to de-duplicate and screen the studies returned by the search strategy (Veritas Health Innovation Citation2023). The screening process will be done by two reviewers, Elizabeth Chatpar (E.C.) and Iman Habib (I.H.). In the first step of the screening process (Ti/Ab screening), E.C. and I.H. will assess each study’s title and abstract to determine if the study appears to adhere to the Population-Exposure-Method (PEM) criteria. Studies that do not adhere to the PEM criteria will be excluded while the rest will proceed to the next round of screening. In this round of screening (full-text screening), the entire text of each study will be screened and a final decision will be made regarding its adherence to the PEM criteria. For all systematic reviews on TAD collection in environmental health, we will hand-search the references of these reviews to ensure that all studies cited by these reviews were returned by our search strategy. All studies in these reviews that are not returned by our search strategy will undergo the two-step screening process (Ti/Ab screening and full-text screening).
E.C. and I.H. will each conduct both screening steps independently, to minimize bias and to maximize the number of potentially relevant studies. If there is any disagreement between them on whether an article adheres to the established PEM criteria, they will engage in a discussion to determine if the article will be included in the final dataset. In the event that a consensus cannot be reached, another screener (Keeve Nachman or Sara Lupolt) will be consulted. The final systematic evidence map will be accompanied by a list of all studies excluded during the full-text screening round and the reasons for exclusion of each study.
2.5. Data collection process
After the screening process is complete, two study authors, E.C. and I.H., will independently extract data from each remaining study into a Google Form (Google, Citationn.d.-a), which will populate into an individual Google Sheets file (Google, Citationn.d.-b). To ensure that data is extracted completely and accurately, both reviewers (I.H. and E.C.) will extract data from all studies in the review and compare all extracted data to ensure a rigorous quality control process.
2.6. Data items
First, we will extract metadata from each study such as the article title; corresponding author’s name and affiliations; year of publication; journal name; funding source; and author-supplied keywords. We will note whether or not the study pertains to an occupational population. If the study is occupational, the industry will be extracted. Demographic information on study participants will be collected (e.g. sex, age, race or ethnicity, socioeconomic status). Additionally, study population information will be collected (e.g. starting study size, final study size, location, eligibility criteria and method(s) of recruitment).
Exposure information such as the agent type (i.e. biological, chemical, or physical), the specific agent (e.g. E. coli, benzene, light), the route of exposure (e.g. inhalation, ingestion, dermal), the medium of exposure (e.g. air, water, soil), as well as the exposure collection method (e.g. stationary monitors, personal exposure monitor) will be recorded. Studies that collect TAD for the purpose of exposure assessment but do not quantify a specific agent will be recorded as “activity” studies and the specific route or medium will be recorded if applicable.
Information on the TAD collection method, the frequency of TAD collection, the duration over which TAD was collected, and the study length will be extracted from each study. The study length describes the time period over which the study was conducted (often multiple months) while the duration refers to a subset of that time period in which TAD was collected. In some cases, the study length and duration may be the same. For studies in which authors make a distinction between microenvironment and activity, we will record what they refer to as microenvironments in one column and what they refer to as activities in a separate column. However, some researchers use the terms microenvironment and activity interchangeably. For these studies, we will record any activity/microenvironment information verbatim in a third column, leaving the first two columns blank. If the study authors refer to microenvironment or activity information using any other word (e.g., location, domain), this will be noted in a fourth column. A key component of this research is to understand how researchers operationalize TAD. Therefore, the specific terms used in the study to describe data that contain information on the timing, duration, and/or frequency of human activities will be listed (e.g. time activity data, time activity diary, activity log).
If a data item does not apply to a study, Not Applicable (NA) will be recorded (e.g. name of chemical hazard would be NA for a biological hazard study). If a data item does apply to a study but is not specified by the study, Not Specified (NS) will be recorded (e.g. a study does not record demographic information on participant sex).
2.7. Training process
To validate our screening and data extraction processes, we conducted a training process with 500 studies. In the Ti/Ab screening step, 397 were excluded while 103 moved on to full-text screening. Seventy-five of these 103 studies were excluded while 28 moved on to the data extraction step and became our training dataset. Since the original dataset of 28 studies did not contain any studies estimating exposure to a biological agent, we continued to scan the studies returned by our search until we were able to identify three relevant biological agent studies and have included these in our training dataset, for a total of 31 studies. We have published this dataset on Open Science Framework (Supplementary Information 5.6.3), a tool encouraging research transparency and exchange (Foster and Deardorff Citation2017). Our final dataset will also be published on Open Science Framework, and we do not plan to update or extend it at this time.
2.8. Analysis methods
2.8.1. Codebook creation
We constructed a codebook a priori that will be used to categorize the extracted data (5.6.3 Training Dataset and Sample Codebook). During our training process, we updated the codebook iteratively by creating and assigning new codes based on the data we extracted to improve our analysis. We will continue updating the codebook iteratively in our formal data extraction process. Each code in the codebook will have a specific, objective definition to ensure that data coding is reproducible. In situations where it is unclear what code to assign to a study, definitions of existing codes will be revised or new codes will be created.
2.8.2. Data analysis
and , respectively, depict the type of qualitative and quantitative data that will be recorded. Based on our training dataset, we anticipate that most of our data will be qualitative, which we will assess using thematic analysis to identify emergent themes. For example, we may sort studies by year and document how terms used to describe TAD have evolved over time. We will convert some of our qualitative data into quantitative data using our codebook and will subsequently count the number of studies for each code. For example, we may assign a specific code (e.g., “VID”) to studies that use videotaping to collect information on human activities. We can use this code to count the number and proportion of studies using videography to collect TAD within our dataset. Where applicable, we will analyze this data using descriptive statistics. The final dataset of included studies will be available as an Excel workbook which researchers can download and manipulate to their liking for their specific research question(s). This may allow them to uncover some of the trends discussed above.
Table 1. Anticipated nominal qualitative data.
Table 2. Anticipated quantitative data.
2.8.3. Reflexive journaling
Reflexive journaling allows scientists to reflect on their research approach; challenge their personal assumptions; and identify how their thoughts, actions, and decisions shape their perspectives (Saldaña Citation2009). Thus far, we have journaled weekly to reflect on our training process, construct our codebook, and develop this protocol. To ensure that the codebook is highly specific and represents our dataset well, we will continue to journal throughout the process of extracting data and creating new codes.
3. Discussion
This protocol serves as a foundation for a systematic evidence map of how TAD has been generated to estimate environmental exposures. Given that there are many terms used to describe TAD in environmental health literature, our search strategy may omit some of these terms despite our search development process being iterative. Moreover, there exist a multitude of TAD collection methods, each documenting activities at varying resolutions of duration and frequency. These varied forms of information may make it challenging to assign codes to data across TAD studies.
Despite these concerns, we anticipate that a visualization of studies collecting TAD will allow researchers to understand how this data has been used and what gaps currently exist in the environmental health literature, thus potentially influencing new research directions. Furthermore, a publicly available database can act as a resource for researchers who want to examine specific studies that collect TAD either based on agent, TAD collection method, or activity. By constructing a systematic evidence map and an open access database of studies generating TAD, we hope to demonstrate the utility of incorporating human activity information in estimation of environmental exposures.
Dictionary
Activity – the actions carried out by humans
Biological agents – agents that cause harm to human health by causing infection or disease; include toxins, bacteria, viruses, parasites, prions, and fungi
Chemical agents – substances that adversely impact health through toxicological mechanisms
Environmental agents – natural or man-made agents that cause adverse health events. Divided into three categories: biological agents, chemical agents, and physical agents
Microenvironment – the location where the exposure takes place that is characterized as having a homogenous concentration of a hazard (Zartarian et al. Citation2005)
Physical agents – non-chemical and non-biological agents that create harmful conditions for human health including extreme temperatures, radiation, noise, and light
Time activity data – data that include information on human activities and the frequency, duration, or timing of when these activities occur
Authors contributions
Elizabeth Chatpar: Methodology, Writing - Original Draft, Writing - Review & Editing, Visualization. Iman Habib: Methodology, Writing - Original Draft, Writing - Review & Editing, Visualization. Keeve Nachman: Conceptualization, Methodology, Writing - Review & Editing, Supervision, Project Administration, Funding Acquisition. Lori Rosman: Methodology. Sara Lupolt: Conceptualization, Methodology, Writing - Review & Editing, Supervision, Project Administration, Funding Acquisition.
Supplemental Material
Download Zip (106.2 KB)Disclosure statement
No potential conflict of interest was reported by the author(s).
Additional information
Funding
References
- Beamer, P., M. E. Key, A. C. Ferguson, R. A. Canales, W. Auyeung, and J. O. Leckie. 2008. “Quantified Activity Pattern Data from 6 to 27-Month-Old Farmworker Children for Use in Exposure Assessment.” Environmental Research 108 (2): 1–8. https://doi.org/10.1016/j.envres.2008.07.007
- Chapter 16. Activity Factors. 2011. In Exposure Factors Handbook. U.S. Environmental Protection Agency Office of Research and Development Washington DC, USA.
- Demirel, G., O. Ozden, T. Döğeroğlu, and E. O. Gaga. 2014. “Personal Exposure of Primary School Children to BTEX, NO2 and Ozone in Eskişehir, Turkey: Relationship with Indoor/Outdoor Concentrations and Risk Assessment.” The Science of the Total Environment 473–474: 537–548. https://doi.org/10.1016/j.scitotenv.2013.12.034
- Duan, X., B. Wang, and S. Cao. 2022. “Time-Activity Patterns.” In Y. Zhang, P. K. Hopke, & C. Mandin (Eds.), Handbook of Indoor Air Quality (1057–1112) Singapore: Springer Nature.
- Ezzati, M., H. Saleh, and D. M. Kammen. 2000. “The Contributions of Emissions and Spatial Microenvironments to Exposure to Indoor Air Pollution from Biomass Combustion in Kenya.” Environmental Health Perspectives 108 (9): 833–839. https://doi.org/10.1289/ehp.00108833
- Foster, E. D., and A. Deardorff. 2017. “Open Science Framework (OSF).” Journal of the Medical Library Association 105 (2): 203. https://doi.org/10.5195/jmla.2017.88
- Glossary of Terms. 2011. In Exposure Factors Handbook. U.S. Environmental Protection Agency Office of Research and Development. Washington, DC. USA.
- Google. n.d.-a. Google Forms: Online form creator. Retrieved from https://www.google.com/forms/about/
- Google. n.d.-b. Google Sheets: Online spreadsheet. Retrieved from https://www.google.com/sheets/about/
- Hubal, R., and E. A. Cohen Hubal. 2023. “Simulating Patterns of Life: More Representative Time-Activity Patterns That Account for Context.” Environment International 172: 107753. https://doi.org/10.1016/j.envint.2023.107753
- Klepeis, N. E., W. C. Nelson, W. R. Ott, J. P. Robinson, A. M. Tsang, P. Switzer, J. V. Behar, S. C. Hern, and W. H. Engelmann. 2001. “The National Human Activity Pattern Survey (NHAPS): A Resource for Assessing Exposure to Environmental Pollutants.” Journal of Exposure Analysis and Environmental Epidemiology 11 (3): 231–252. https://doi.org/10.1038/sj.jea.7500165
- National Center for Biotechnology Information. n.d. MeSH Environmental Exposure. National Library of Medicine. Retrieved from https://www-ncbi-nlm-nih-gov.proxy1.library.jhu.edu/mesh/?term=%22Environmental+Exposure%22%5BMeSH+Terms%5D
- Saldaña, J. 2009. “Chapter 3: Writing Analytic Memos about Narrative and Visual Data.” In J. Saldaña (Ed.), The Coding Manual for Qualitative Researchers (41–53). SAGE Publications, Thousand Oaks, California, USA.
- Veritas Health Innovation. 2023. Covidence Systematic Review Software. Melbourne, Australia.
- Zartarian, V., T. Bahadori, and T. McKone. 2005. “Adoption of an Official ISEA Glossary.” Journal of Exposure Analysis and Environmental Epidemiology 15 (1): 1–5. https://doi.org/10.1038/sj.jea.7500411