Abstract
Objective. We compared the Bergstrom's and Randerson's formula for PNA determination, and compared the normalization of PNA by ideal body weight (IBW) and standard body weight (SBW) as estimated by the Watson's formula. Methods. We studied 208 Chinese PD patients. Two 24-h dialysate and urine collections were performed six months apart. Protein nitrogen appearance was determined by the Randerson's formula (PNA-Rand) and Bergstrom's formula (PNA-Berg), the latter used as the gold standard. PNA-Berg was normalized with IBW and SBW, denoted as NPNA-IBW and NPNA-Watson respectively. The change of PNA over six months, denoted as ΔPNA-Rand and ΔPNA-Berg, were calculated. The results were compared by the Bland and Altman's method. Results. At zero month, the average PNA-Berg was 61.8 ± 14.8 g/day, and the average PNA-Rand was 58.1 ± 14.5 g/day. The value of PNA-Rand was consistently lower than the corresponding PNA-Berg. The bias of PNA-Rand was −3.7 g/day. The limits of agreement were −9.2 to +1.8 g/day. When NPNA-Watson was compared to NPNA-IBW, the bias of NPNA-Watson, using NPNA-IBW as gold standard, was 0.01 g/kg/day; the limits of agreement were −0.22 to +0.23 g/kg/day. The difference between NPNA-Watson and NPNA-IBW correlated with the body mass index (r = −0.820, p<0.001) and body weight (r = −0.834, r<0.001). After six month, there was a significant reduction in urine protein loss. However, total protein loss was only slightly reduced (7.3 ± 3.0 to 6.9 ± 2.8 g/day, p = 0.029). The correlation between ΔPNA-Berg and ΔPNA-Rand remained excellent (r = 0.983, p<0.001). The bias of ▵PNA-Rand was +0.3 g/day; the limits of agreement were −4.7 to +5.2 g/day. Conclusion. Ideal body weight that is validated for specific ethnic group, rather than the Watson's formula, should be used for normalization of PNA. Although the Randerson's formula under-estimates PNA when compared to the Bergstrom's formula, it is a reliable method for serial PNA monitoring because dialysate protein loss is stable in most patients.
Introduction
Protein nitrogen appearance (PNA) is an important nutritional index in patients receiving peritoneal dialysis (PD).Citation[[1]] Nevertheless, the method for determination and normalization of PNA remains a choice of individual nephrologist.Citation[[2]], Citation[[3]] Both the Randersons's and the Bergstrom's formula have been recommended for the determination of PNA,Citation[[3]], Citation[[4]], Citation[[5]], Citation[[6]], Citation[[7]] and either the Watson's formula or the ideal body weight could be used to calculate normalized PNA.Citation[[8]], Citation[[9]] In fact, the ideal body weight is often very different from the body weight as estimated by the Watson's formula in many ethnic groups. In the present study, we examined a large group of Chinese PD patients to compare the methods of PNA determination and normalization.
Patients and Method
Study Design
We studied 208 prevalent PD patients in our dialysis unit. Baseline data including age, sex, underlying renal disease, presence of diabetes, hepatitis B status, PD regimen, and duration on dialysis were recorded. For each patient, standard clearance study was performed at 0 month and then repeated at six months. The method of clearance study has been reported previously.Citation[[10]] Briefly, 24-h dialysate and urine collections were performed. If there was an acute medical problem such as peritonitis, this study was obtained one month after resolution of the problem. The daily drained volume of dialysate was mixed, measured volumetrically and sent for measurement of urea, creatinine, and glucose concentrations. Daily protein loss in dialysate (DPr) was measured. Similarly, 24-h urine volume and urinary concentrations of urea and creatinine were determined, and daily urinary protein loss (UPr) was measured. Daily total protein loss (TPr) was defined as the sum of DPr and UPr. At the end of the 24-h collection, body weight was measured, and a blood sample was obtained for measurement of plasma urea, creatinine, and albumin concentrations. Serum albumin level was measured by bromocresol purple method. Body surface area (BSA) was determined from body weight and height by Dubois' formula.Citation[[11]]
Protein Nitrogen Appearance
Urea nitrogen appearance (UNA) was determined from the total amount of urea in 24-h dialysate and urine collection. Protein nitrogen appearance was calculated by the Bergstrom's formula (PNA-B)Citation[[3]], Citation[[4]] and the Randerson's equation (PNA-R)Citation[[6]] as follows:while UNA and TPr were in gram per day.
PNA-Berg were further normalized by the ideal body weight (IBW) and standard body weight (SBW) as follows:Ideal body weight was determined by the body height and sex according to a standard formula validated in Southern ChineseCitation[[12]]:
Standard body weight was defined as total body water (V) divided by 0.58. Total body water was determined by the Watson's formulaCitation[[13]]:
Total weekly Kt/V and weekly creatinine clearance normalized to BSA (CCr) were also determined by standard method.Citation[[14]] Residual GFR was calculated as average of 24-h urinary urea and creatinine clearance as described.Citation[[15]] Creatinine concentration in dialysate was corrected for interference by glucose according to reference formula determined in our laboratory.Citation[[16]]
Serial Change in PNA
The change in PNA over the six-month period was calculated as follows:
The change in total protein loss (ΔTPr), dialysate protein loss (ΔDPr), urinary protein loss (ΔUPr), and glomerular filtration rate (ΔGFR) were calculated in similarly.
Statistics
Statistical analysis was performed by SYSTAT 7.0 for Windows software (SPSS Inc., Chicago, IL). All data were expressed in mean ± SD unless otherwise specified. PNA-Berg and PNA-Rand at 0 month were compared by the Bland and Altman's method,Citation[[17]] using PNA-Berg as the gold standard. In this analysis, the difference between the two methods of PNA determination was plotted against the corresponding PNA-Berg. Similarly, NPNA-IBW and NPNA-Watson at 0 month were compared, using NPNA-IBW as gold standard; ΔPNA-Berg and ΔPNA-Rand were compared, using ΔPNA-Berg as gold standard. Continuous variables were compared by Pearson's correlation coefficient. A p-value of less than 0.05 was taken as statistical significant. All probabilities were two-tailed.
Result
We studied 208 patients. The demographic and baseline clinical characteristics are summarized in . The median duration of dialysis was 14 months (range 1–154 months). The mean daily exchange volume was 6.5 ± 1.1 L; 164 patients (78.8%) had 6 L/day, 40 patients (19.2%) had 8 L/day, and 4 patients (1.9%) had 10 L/day dialysis exchange. At 0 month, the average PNA-Berg was 61.8 ± 14.8 g/day, and the average PNA-Rand was 58.1 ± 14.5 g/day. Dialysis adequacy and nutritional parameters are summarized in .
Table 1. Demographic and baseline clinical data
Table 2. Dialysis adequacy and nutritional status at 0 month and 6 months
Baseline PNA-Berg and PNA-Rand
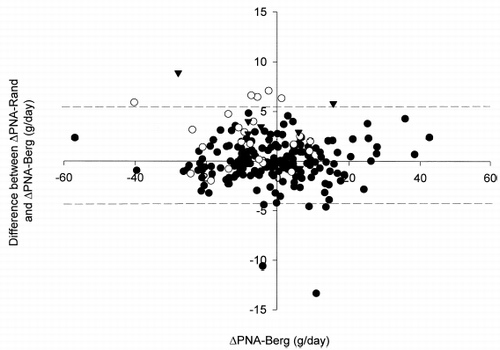
At 0 month, the correlation between PNA-Berg and PNA-Rand was excellent (r = 0.982, p<0.001) (). PNA-Rand was then compared to PNA-Berg by the Bland and Altman plot (). The bias of PNA-Rand, using PNA-Berg as gold standard, was −3.7 g/day. The limits of agreement were −9.2 to +1.8 g/day.
Figure 1. Scatter plot of PNA-Rand vs. PNA-Berg at 0 month. The line of equality is shown for reference.
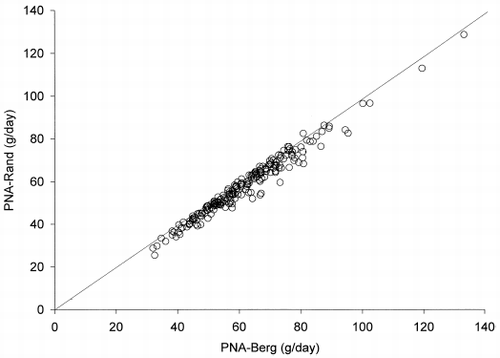
Figure 2. Bland and Altman's plot of the difference between PNA-Rand and PNA-Berg vs. PNA-Berg at 0 month. Closed circles indicate cases with total protein loss (TPr) below 10 g/day; open circles, TPr 10–15 g/day; closed triangles, TPr above 15 g/day. Dotted lines indicate the overall limits of agreement.
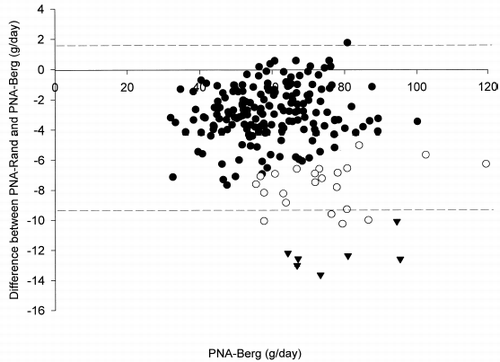
When only cases with TPr less than 10 g/day were analyzed (n = 178), the bias of PNA-Rand was −2.9 g/day; limits were agreement were −6.3 to +0.6 g/day. When cases with TPr above 10 g/day were analyzed (n = 30), the bias of PNA-Rand was −8.7 g/day; limits of agreement were −13.7 to −3.7 g/day. When only cases with TPr above 15 g/day were analyzed (n = 7), the bias was −12.4 g/day; limits of agreement were −14.5 to −10.2 g/day.
NPNA-IBW vs. NPNA-Watson
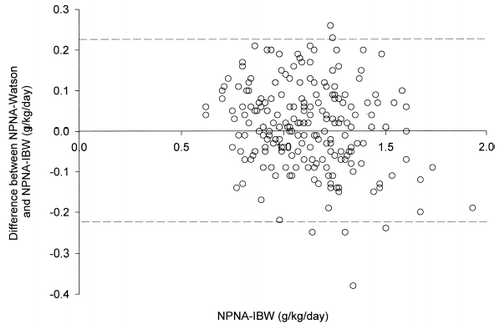
There was a fair correlation between IBW and SBW (r = 0.819, p<0.001). At 0 month, the correlation between NPNA-IBW and NPNA-Watson was excellent (r = 0.904, p<0.001) (). When NPNA-Watson was compared to NPNA-IBW by the Bland and Altman method (), the bias of NPNA-Watson, using NPNA-IBW as gold standard, was 0.01 g/kg/day. However, the limits of agreement were −0.22 to +0.23 g/kg/day. The difference between NPNA-Watson and NPNA-IBW was significantly correlated with the body mass index (r = −0.820, p<0.001) and body weight (r = −0.834, p<0.001).
Figure 3. Scatter plot of NPNA-Watson and NPNA-IBW at 0 month. The line of equality is shown for reference.
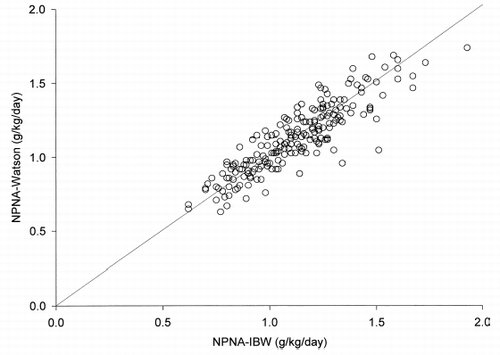
Figure 4. Bland and Altman's plot of the difference between NPNA-Watson and NPNA-IBW vs. NPNA-IBW at 0 month. Dotted lines indicate the overall limits of agreement.
Serial Change of PNA
After six months, there was a small but significant reduction in TPr and UPr as a result of decline in residual renal function (see ). Nevertheless, the correlation between ΔPNA-Berg and ΔPNA-Rand was excellent (r = 0.983, p<0.001) (). ΔPNA-Rand was then compared to ΔPNA-Berg by the Bland and Altman plot (). The bias of ΔPNA-Rand, using ΔPNA-Berg as gold standard, was +0.3 g/day. The limits of agreement were −4.7 to +5.2 g/day.
Figure 5. Scatter plot of ΔPNA-Rand vs. ΔPNA-Berg after 6 months. The line of equality is shown for reference.
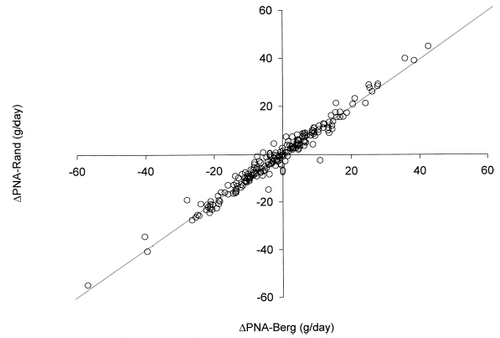
Figure 6. Bland and Altman's plot of the difference between ΔPNA-Rand and ΔPNA-Berg vs. ΔPNA-Berg after 6 months. Closed circles indicate cases with total protein loss (TPr) below 10 g/day; open circles, TPr 10–15 g/day; closed triangles, TPr above 15 g/day. Dotted lines indicate the overall limits of agreement.
When only cases with TPr at 0 month less than 10 g/day were analyzed (n = 178), the bias of PNA-Rand was −0.2 g/day; limits were agreement were −4.5 to +4.2 g/day. When cases with TPr above 10 g/day were analyzed (n = 30), the bias of PNA-Rand was +2.8 g/day; limits of agreement were −2.6 to +8.3 g/day. When only cases with TPr above 15 g/day were analyzed (n = 7), the bias was +3.9 g/day; limits of agreement were −1.9 to +9.7 g/day.
Discussion
In patients with stable body weight, protein nitrogen appearance is an indirect measurement of dietary protein intake.Citation[[1]], Citation[[18]] It is commonly used as an index of nutritional status in PD patients in clinical trialsCitation[[10]], Citation[[19]] and in routine clinical practice.Citation[[5]], Citation[[20]]
We found that there was a substantial discrepancy between ideal body weight (IBW) and standardized body weight (SBW). It should be noted that SBW was derived from the Watson's formula, which has not been validated in Chinese. In fact, the discrepancy between IBW and SBW was proportional to body mass index and measured body weight of the patient. In other words, SBW tends to over-estimate body size, especially in obese patients. Our observation is different from that reported in western population.Citation[[21]] Nevertheless, we believe that IBW should be used for normalizing PNA because IBW has been validated in Chinese population, while the Watson's formula is not. Our findings highlight the importance of using ideal body weight that has been validated for specific ethnic groups for the normalization of PNA.
Unfortunately, IBW does not take into account of the patients' body built. It has been suggested that lean body mass should be the ideal parameter for normalizing PNA, at least in western country.Citation[[9]], Citation[[22]] However, lean body mass derived from creatinine kinetics has substantial mathematic coupling with PNA, because both parameters are derived from the same 24-h dialysate and urinary sample.Citation[[23]] In addition, the formula described by Forbes and BruiningCitation[[24]] has not been validated in Chinese. Our previous study found that lean body mass determined by anthropometric method had poor correlation with that derived from creatinine kinetics and may not be reliable in Chinese.Citation[[25]]
The Bergstrom's formula is now regarded as the ideal method for calculation of PNA.Citation[[3]], Citation[[4]] Although the DOQI guidelines also recommend the Randerson's formula,Citation[[4]], Citation[[5]] there are methodological concerns. Dialysate and urinary protein loss are estimated rather than calculated in the Randerson's formula.Citation[[6]] Therefore, the estimation would not be accurate in patients with significant residual renal function and possibly substantial proteinuria. As expected, we find that the Randerson's formula consistently gives a lower estimate of PNA than the Bergstrom's formula in the present study. Furthermore, the higher the total protein loss, the higher was the error of estimation (see ). Both observations suggest that the Randerson's formula consistently under-estimates dialysate and urinary protein loss.
One of the major concerns of the Randerson's formula is that urinary protein loss is expected to decline with time as residual renal function goes off. As a result, the error of estimation by the Randerson's formula, at least theoretically, would not be constant. It could be argued, therefore, that Randerson's formula is not suitable for serial monitor of PNA, especially in patients with significant residual renal function. Contrary to the theoretical concern, we find that Randerson's formula and Bergstrom's formula give highly consistent measurements in the change of PNA with time, and the error was only moderately dependent on total protein loss. In fact, the bias and errors of estimations (see ) were quite negligible when the values are normalized to NPNA. The reason is obvious: urinary protein loss only has a small contribution to the total daily protein loss. In fact, dialysate protein loss, which was remarkably constant over time (see ), accounts for almost 90% of the total protein loss. However, it should be noted that the period of observation was only six months in the present study. It would require another study to examine the reliability of the Randerson's formula for serial PNA monitoring over an extended period of time. As a matter of fact, there are limited data on the longitudinal change of dialysate protein loss in PD patients.
In summary, ideal body weight that is validated for specific ethnic group, rather than the Watson's formula, should be used for normalization of PNA. Although the Randerson's formula gives a somewhat biased estimate in PNA, it remains a reasonable method for serial PNA monitoring of individual patient, especially in patients with little residual renal function.
Acknowledgment
This study was supported in part by the CUHK research accounts 6901031 and 6901112.
References
- Kopple J.D., Gao X.L., Qing D.P. Dietary protein, urea nitrogen appearance and total nitrogen appearance in chronic renal failure and CAPD patients. Kidney Int. 1997; 52(3)486–494
- Mandolfo S., Zucchi A., Cavalieri D'Oro L., Corradi B., Imbasciati E. Protein nitrogen appearance in CAPD patients: what is the best formula?. Nephrol. Dial. Transplant 1996; 11(8)1592–1596
- Bergstrom J., Heimburger O., Lindholm B. Calculation of the protein equivalent of total nitrogen appearance from urea appearance. Which formulas should be used?. Perit. Dial. Int. 1998; 18(5)467–473
- NKF-K/DOQI. Clinical practice guidelines for peritoneal dialysis adequacy: update 2000. Am. J. Kidney Dis. 2001; 37(Suppl. 1)S65–S136
- NKF-DOQI. Clinical practice guidelines for peritoneal dialysis adequacy. Am. J. Kidney Dis. 1997; 30(Suppl. 2)S69–S133
- Randerson D.H., Chapman G.V., Farrell P.C. Amino acid and dietary status in CAPD patients. Peritoneal Dialysis, R.C. Atkins, P.C. Farrell, N. Thomson. Churchill-Livingstone, Edingburgh 1981; 180–191
- Usha K., Moore H.L., Nolph K.D. Protein catabolic rate in CAPD patients: comparison of different techniques. Adv. Perit. Dial. 1996; 12: 284–287
- Virga G., Viglino G., Gandolfo C., Aloi E., Cavalli P.L. Normalization of protein equivalent of nitrogen appearance and dialytic adequacy in CAPD. Perit. Dial. Int. 1996; 16(Suppl. 1)S185–S189
- Leibowitz J., Uribarri J. Normalization of protein catabolic rate to a new body weight derived from lean body mass in dialysis patients. Clin. Nephrol. 1998; 50(5)315–319
- Szeto C.C., Wong T.Y., Leung C.B., Wang A.Y., Law M.C., Lui S.F., Li P.K. Importance of dialysis adequacy in mortality and morbidity of Chinese CAPD patients. Kidney Int. 2000; 58(1)400–407
- Dubois D., Dubois E.F. A formula to estimate the approximate surface area if height and weight be known. Arch. Intern. Med. 1916; 17: 863–871
- Department of Health, Republic of China (Taiwan). The ROC's Handbook of Diet, 2nd Ed. Taipei 1994; 20–21p
- Watson P.E., Watson I.D., Batt R.D. Total body water volumes for adult males and females estimated from simple anthropometric measurements. Am. J. Clin. Nutr. 1980; 33(1)27–39
- Nolph K.D., Moore H.L., Twardowski Z.J., Khanna R., Prowant B., Meyer M., Ponferrada L. Cross-sectional assessment of weekly urea and creatinine clearances in patients on continuous ambulatory peritoneal dialysis. ASAIO J. 1992; 38(3)M139–M142
- Van Olden R.W., Krediet R.T., Struijk D.G., Arisz L. Measurement of residual renal function in patients treated with continuous peritoneal dialysis. J. Am. Soc. Nephrol. 1996; 7(5)745–748
- Mak T.W., Cheung C.K., Cheung C.M., Leung C.B., Lam C.W., Lai K.N. Interference of creatinine measurement in CAPD fluid was dependent on glucose and creatinine concentrations. Nephrol. Dial. Transplant 1997; 12(1)184–186
- Bland J.M., Altman D.G. Statistical methods for assessing agreement between two methods of clinical measurement. Lancet 1986; 1(8476)307–310
- Maroni B.J., Steinman T.I., Mitch W.E. A method for estimating nitrogen intake of patients with chronic renal failure. Kidney Int. 1985; 27(1)58–65
- CANADA–USA (CANUSA). Peritoneal Dialysis Study Group. Adequacy of dialysis and nutrition in continuous peritoneal dialysis: association with clinical outcomes. J. Am. Soc. Nephrol. 1996; 7(2)198–207
- The Renal Association. Treatment of Adult Patients with Renal Failure, 2nd Ed. Royal College of Physicians of London. 1997
- de Fijter W.M., de Fijter C.W., Oe P.L., ter Wee P.M., Donker A.J. Assessment of total body water and lean body mass from anthropometry, Watson formula, creatinine kinetics, and body electrical impedance compared with antipyrine kinetics in peritoneal dialysis patients. Nephrol. Dial. Transplant 1997; 12(1)151–156
- Canaud B., Leblanc M., Garred L.J., Bosc J.Y., Argiles A., Mion C. Protein catabolic rate over lean body mass ratio: a more rational approach to normalize the protein catabolic rate in dialysis patients. Am. J. Kidney Dis. 1997; 30(5)672–679
- Harty J., Boulton H., Faragher B., Venning M., Gokal R. The influence of small solute clearance on dietary protein intake in continuous ambulatory peritoneal dialysis patients: a methodological analysis based on cross-sectional and prospective studies. Am. J. Kidney Dis. 1996; 28(4)553–560
- Forbes G.B., Bruining G.J. Urinary creatinine excretion and lean body mass. Am. J. Clin. Nutr. 1976; 29(12)1359–1366
- Szeto C.C., Kong J., Wu A.K., Wong T.Y., Wang A.Y., Li P.K. The role of lean body mass as nutritional index in Chinese peritoneal dialysis patients—comparison of creatinine kinetic and anthropometric methods. Perit. Dial. Int. 2000; 20(6)708–714