
Abstract
Objective
The CUPRAC–BCS and antioxidant activity (AOA) assays have been developed as indirect methods to determine the total antioxidant capacity (TAC). We examined these assays as markers, in erythrocytes, under oxidative stress (induced by storage) and with antioxidants – vitamin C, L-carnitine, and curcumin.
Methods
Antioxidants were added to blood samples, stored and assayed for TAC and reactive oxygen species (ROS).
Results
Vitamin C at lower concentrations and L-carnitine and curcumin at higher concentrations proved beneficial to the erythrocytes.
Discussion
CUPRAC–BCS and AOA effectively determined TAC of stored erythrocytes. This was in accordance with the levels of ROS, and hence, CUPRAC–BCS and AOA can be used as reliable markers of TAC, in erythrocytes during oxidative stress.
Introduction
Oxidative stress (OS) can be defined as a disturbance in the pro-oxidant–antioxidant balance in favor of the former, leading to potential damage.Citation1,Citation2 Assessment of the antioxidant defense and the reactive species together gives a complete outlook of the OS in a system.Citation3
Halliwell and Gutteridge defined an antioxidant as any substance that when present at low concentrations compared with those of an oxidizable substrate significantly delays or prevents oxidation of that substrate.Citation4 However, the methodology used to enumerate a substance as an ‘antioxidant’ is equally important.Citation2 Total antioxidant capacity (TAC) or antioxidant capacity refers to the resultant antioxidant activity (AOA) of all the substances present in a sample.Citation5,Citation6 TAC is defined as a measure of the amount of a given free radical scavenged by the non-enzymatic antioxidants present in an aqueous solution.Citation7,Citation8
Numerous protocols and techniques have been developed to assess TAC directly, such as, AOA,Citation9,Citation10 total radical-trapping antioxidant parameter,Citation11,Citation12 total oxidant scavenging capacity,Citation13,Citation14 total antioxidant status,Citation15,Citation16 and oxygen radical absorbance capacity.Citation17–Citation19 Indirect assays assess the total content of antioxidants in a sample based on determination of their reductive properties, i.e. their ability to reduce an indicator substance, or to evoke a reduction peak in a voltammetric measurement, such as ferric reducing ability of plasma,Citation20,Citation21 cupric ion reducing antioxidant capacity (CUPRAC),Citation7,Citation22 ABTS•+ decolorization,Citation23,Citation24 DPPH• decolorization,Citation25,Citation26 plasma oxidative capacity,Citation27 and total AOA.Citation28
AOA has been developed as a simple and rapid method of determination of total antioxidative activity in human biological fluids.Citation28 The CUPRAC assay has been widely used to detect the reduction of cupric ions by neocuproine (NC);Citation22,Citation29–Citation35 however, Da CruzCitation36 showed the possibility of using bathocuproinedisulfonic acid disodium salt (BCS) as a chelating agent as well, now known as ‘antioxidant power assay (PAO or AOP)’.
The CUPRAC method has been suggested and reviewed as a suitable method to assess the antioxidant power of biological and non-biological samplesCitation22,Citation29–Citation35 using NC as the chelating agent. The CUPRAC-NC method of TAC assay has been successfully applied to antioxidants in apricot and herbal teas;Citation33,Citation34 garlic;Citation37 kiwifruit;Citation38,Citation39 cereal;Citation40 medicinal and herbal plants;Citation41–Citation43 food;Citation44,Citation45 plant matrices;Citation46 to hydroxyl radical scavengers;Citation34 and to determine hydrophilic and lipophilic antioxidant componentsCitation47 in human serum.Citation22
Campos et al.Citation7 established the CUPRAC–BCS assay as a simple, fast, inexpensive, and suitable method for TAC assessment in human plasma and urine samples. Koracevic et al.Citation28 established the AOA assay as a simple and quick method for determining AOA in serum, plasma, saliva, urine, tears, aqueous humor oculi, cerebrospinal fluid, and kidney cyst fluid. However, the CUPRAC–BCS method and AOA method have not been explored in erythrocyte samples. The effectiveness of these methods in determining the TAC has therefore been studied in erythrocytes, under conditions of OS, such as storage and with antioxidants.
The assessment of the above two methods as reliable markers of AOA would be incomplete without the determination of the reactive oxygen species (ROS) produced in the system. The ROS in a system can be measured by the 2′,7′ dichlorofluorescein diacetate (DCFH-DA) assay, to assess the effect of antioxidants on erythrocytes during storage at concentrations higher and lower than those used in the CUPRAC–BCS and AOA assays.
Hence, this study aims to assess the use of CUPRAC–BCS and AOA as reliable markers of antioxidant capacity in erythrocytes, in comparison to the ROS produced, under two situations (i) by inducing stress through storage and (ii) with antioxidant additives such as vitamin C (VC), L-carnitine (LC), and curcumin.
Methods
Animal care and maintenance were in accordance with the ethical committee regulations (841/b/04/CPCSEA).
Blood sampling
Animals were lightly anesthetized with ether and restrained in dorsal recumbancy.Citation48 In brief, the syringe needle was inserted just below the xyphoid cartilage and slightly to the left of midline. Then, 4–5 ml of blood was carefully aspirated from the heart into 5 ml of plastic collecting tubes with citrate phosphate, dextrose and adenine-1 (CPDA-1) solution.
Experimental design
Blood was drawn from male Wistar rats (4 months old) and stored over a period of time (25 days) at 4°C in plastic vials. The samples were divided into two groups – (a) controls; (b) Experimentals – (i) samples without antioxidants, (ii) samples with antioxidants. The samples with antioxidants were further divided into subgroups, based on the concentration and type of antioxidant added, as shown in . Erythrocytes were isolated from all samples every fifth day and assessed for (i) antioxidant power by the CUPRAC–BCS assay and (ii) AOA. Antioxidants were added to a second set of samples at concentrations 5 µM, 50 µM, 500 µM, 5 mM, 50 mM, and 500 mM and assayed for ROS by the DCFH-DA assay.
Table 1. Experimental design
Erythrocyte separation
The erythrocytes were isolated by centrifugation for 20 min at 1000 g at 4°C. The plasma and buffy coat were removed. The cell pellet was washed three times with isotonic phosphate buffer, pH 7.4, centrifuged at 1000 g for 10 minutes, and finally suspended in an equal volume of isotonic phosphate buffer.Citation49 This constituted the erythrocyte suspension.
CUPRAC assay
The CUPRAC–BCS assay is based on the antioxidant power method of Da Cruz.Citation36 Two hundred microliters of the hemolysate (erythrocytes with hypotonic phosphate buffer – 20 mOsm, pH 7.4) diluted 1:40 with 0.25 mM BCS in 10 mM phosphate buffer (pH 7.4) was put into each well in duplicate and a first read at 490 nm was taken. After the addition of 50 µl of 0.5 mM CuSO4, the reaction mixture was incubated for 3 minutes at room temperature. The reaction was stopped by the addition of 50 µl of 0.01 M ethylenediaminetetraacetic acid (EDTA) and the absorbance was read at 490 nm. Results were compared with a standard curve obtained with uric acid and are expressed in mM uric acid equivalents/l.
AOA assay
AOA was determined by the method of Koracevic et al.Citation28 Briefly, 10 µl of the hemolysate (erythrocytes with hypotonic phosphate buffer – 20 mOsm, pH 7.4) was added to 490 µl of 0.1 M (pH 7.4) sodium phosphate buffer, followed by 500 µl of sodium benzoate (0.01 M), 200 µl of Fe-EDTA mixture (2 mM), and 200 µl of 10 mM H2O2. It was incubated for 60 minutes at 37°C and then 1 ml of 20% acetic acid and 1 ml of thiobarbituric acid (0.8% w/v in 0.05 M sodium hydroxide) were added. Further, it was incubated for 10 minutes at 100°C (in a boiling water bath) and then cooled in an ice bath. Absorbance was measured at 532 nm against deionized water. Uric acid standards were used for calibration.
ROS DCFH-DA assay
The intracellular ROS was measured by the method of Blasa et al., 2011.Citation50 Briefly, the packed erythrocytes were diluted 1:100 in phosphate-buffered saline (PBS) before the incubation with DCFH-DA. A stock solution, 20 mM DCFH-DA, was prepared in methanol and diluted in PBS to obtain a 75 µM working solution. The erythrocyte suspension was incubated at 37°C with 25 µM DCFH-DA in a 96-well microplate that was placed in the Fluostar Optima plate reader fluorimeter and the fluorescence was read at 485 nm (excitation) and 520 nm (emission) at 0, 15, and 30minutes.
Statistical analyses
Results are represented as mean ± standard error (SE). Values between the groups were analyzed by one-way and two-way analysis of variance (ANOVA) and was considered significant at P < 0.05. Tukey's and Bonferroni's Post-test were performed using GraphPad Prism 5 software.
Results
TACCUPRAC/AOP
Vitamin C
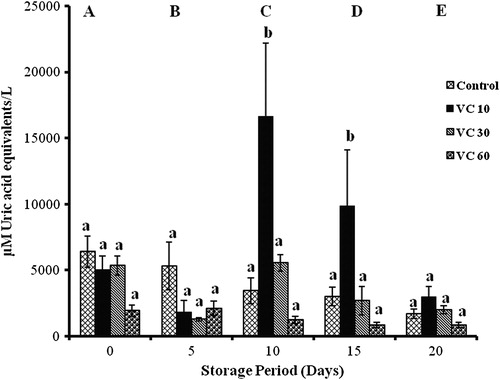
TACCUPRAC/AOP was found to be significant with storage in all groups. Controls showed decreases of 17, 46, 53, and 74% on days 5, 10, 15, and 20. In VC 10, decreases of 64 and 40% (days 5 and 20) and increases of 200 and 100% (days 10 and 15) were observed. In VC 30, decreases of 76, 49, and 63% (days 5, 10, and 15) were observed as storage progressed. VC 60 showed decreases of 36% (day 10) and 56% (days 15 and 20) with storage.
Significant increases were observed on days 10 and 15 in VC 10 against controls (400 and 200%). Decreases of 69% in VC 30 against VC 10 and 92% in VC 60 against VC 10 were observed on days 10 and 15 ().
Figure 1. TACCUPRAC/AOP of erythrocytes isolated from stored blood with VC. Values are expressed as mean ± SE from five samples. VC 10, vitamin C (10 mM); VC 30, vitamin C (30 mM); VC 60, vitamin C (60 mM). Changes are analyzed by two-way ANOVA followed by Bonferroni's post-test using Graphpad Prism software. P < 0.05 was considered significant. Values between groups are represented in upper case, while values within a group are represented in lower case. Those not sharing the same letters are significant.
L-carnitine
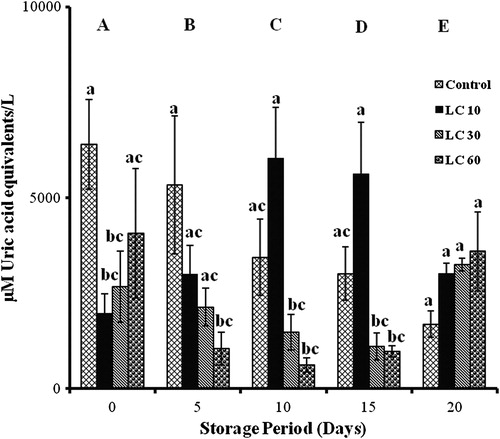
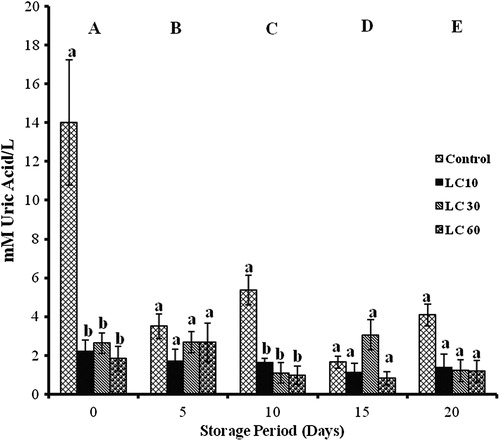
TACCUPRAC significantly changed with storage in all groups. Controls showed decrement throughout storage (17, 46, 53, and 74%). In the LC 10 groups, increments of 53% (days 5 and 20), 200% (day 10), and 100% (day 15) were observed. LC 30 showed a 50% decrease (days 10 and 15), while LC 60 showed a 78% decrease (days 5, 10, and 15) with storage.
LC 10 and LC 30 showed 65% decrease on day 0, while LC 60 showed 80% decrease on day 5 against controls. LC 30 and LC 60 showed 82% reduction on days 10 and 15 against LC 10 ().
Figure 2. TACCUPRAC/AOP of erythrocytes isolated from stored blood with LC. Values are expressed as mean ± SE from five samples. LC 10, L-carnitine (10 mM); LC 30, L-carnitine (30 mM); LC 60, L-carnitine (60 mM). Changes are analyzed by two-way ANOVA followed by Bonferroni's post-test using Graphpad Prism software. P < 0.05 was considered significant. Values between groups are represented in upper case, while values within a group are represented in lower case. Those not sharing the same letters are significant.
Curcumin
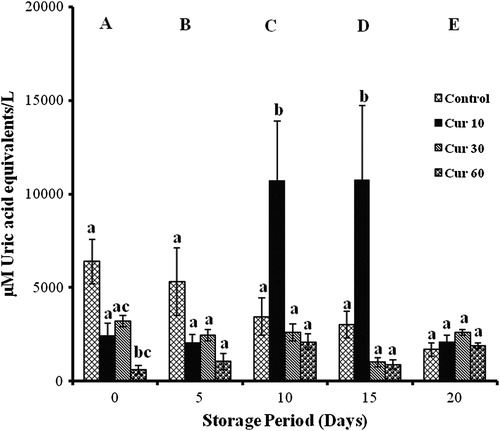
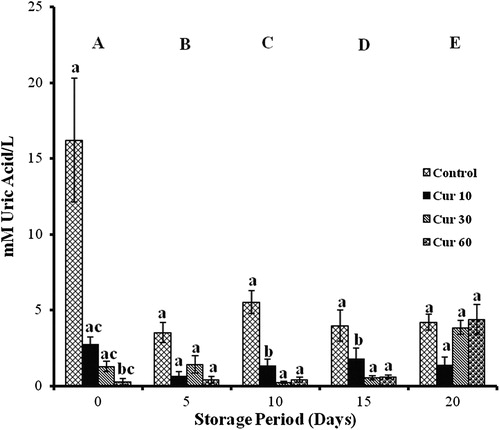
Changes in TACCUPRAC varied significantly with storage. In controls, it decreased by 17, 46, 53, and 74% with storage. Cur 10 showed 3 folds elevations on days 10 and 15, while Cur 30 showed 20% (days 5, 10, and 20) and 70% (day 15) decreases with storage. Increments in Cur 60 were observed throughout storage (70% on day 5, 45% on day 15, and 200% on days 10 and 20).
Cur 10 showed 200% increases on days 10 and 15 and Cur 60 showed 90% decrease on day 0 against controls. Cur 30 and Cur 60 showed 85% decrement against Cur 10 on days 10 and 15 ().
Figure 3. TACCUPRAC/AOP of erythrocytes isolated from stored blood with curcumin. Values are expressed as mean ± SE from five samples. Cur 10, curcumin (10 mM); Cur 30, curcumin (30 mM); Cur 60, curcumin (60 mM). Changes are analyzed by two-way ANOVA followed by Bonferroni's post-test using Graphpad Prism software. P < 0.05 was considered significant. Values between groups are represented in upper case, while values within a group are represented in lower case. Those not sharing the same letters are significant.
Antioxidant activity
Vitamin C
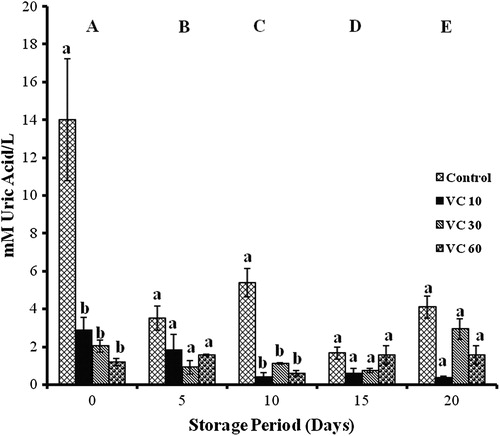
Changes in AOA were found to be significant with storage. Reduction in AOA by 74% was observed in controls on all days. VC 10 showed decreases of 37% (day 5) and 83% (days 10, 15, and 20) with storage. In VC 30, decreases on days 5, 10, and 15 (55%) and an increase of 44% was observed on day 20. Increment of 30% was observed in VC 60 on days 5, 15, and 20 and a decrement of 51% was observed on day 10.
VC 10, VC 30, and VC 60 showed decreases of 86% on days 0 and 10 with respect to controls ().
Figure 4. AOA of erythrocytes isolated from stored blood with VC. Values are expressed as mean ± SE from five samples. VC 10, vitamin C (10 mM); VC 30, vitamin C (30 mM); VC 60, vitamin C (60 mM). Changes are analyzed by two-way ANOVA followed by Bonferroni's post-test using Graphpad Prism software. P < 0.05 was considered significant. Values between groups are represented in upper case, while values within a group are represented in lower case. Those not sharing the same letters are significant.
L-carnitine
Significant changes were observed in all groups with storage. Controls and LC 10 showed decreases of 74 and 34%, respectively, on all days. LC 30 showed a decrease of 55% on days 10 and 20, while LC 60 showed an initial increase (45%) on day 0, followed by decreases of 45% on days 10, 15, and 20.
Decrements of 83% (day 0) and 66% (day 10) against the controls were observed in LC 10, LC 30, and LC 60 ().
Figure 5. AOA of erythrocytes isolated from stored blood with LC. Values are expressed as mean ± SE from five samples. LC 10, L-carnitine (10 mM); LC 30, L-carnitine (30 mM); LC 60, L-carnitine (60 mM). Changes are analyzed by two-way ANOVA followed by Bonferroni's post-test using Graphpad Prism software. P < 0.05 was considered significant. Values between groups are represented in upper case, while values within a group are represented in lower case. Those not sharing the same letters are significant.
Curcumin
Changes in all groups were found to be significant with storage. Controls showed decreases of 75% on all days, while in Cur 10, decreases of 75% (day 5), 50% (days 10 and 20), and 35% (day 15) were observed. Cur 30 showed a decrease of 70% (days 10 and 15) and 200% increase on day 20. Cur 60 showed 1 fold (day 15) and 10 folds increases with storage.
A decrement of 75 and 55% (days 10 and 15) was observed in Cur 10 against the controls. Cur 60 showed 100% reduction against controls (day 0) and 66% decreases (days 10 and 15) against Cur 10. Cur 30 showed 75% decrease against Cur 10 (days 10 and 15) ().
Figure 6. AOA of erythrocytes isolated from stored blood with curcumin. Values are expressed as mean ± SE from five samples. Cur 10, curcumin (10 mM); Cur 30, curcumin (30 mM); Cur 60, curcumin (60 mM). Changes are analyzed by two-way ANOVA followed by Bonferroni's post-test using Graphpad Prism software. P < 0.05 was considered significant. Values between groups are represented in upper case, while values within a group are represented in lower case. Those not sharing the same letters are significant.
ROS DCFH-DA assay
Controls
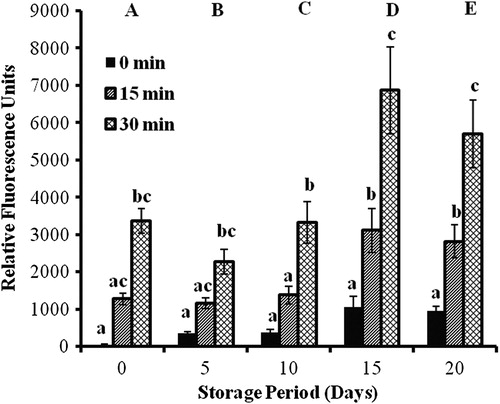
The initial studies on controls by the DCFH-DA assay showed significant maxima of ROS production on day 15 and with readings at 30 minutes. Subsequent studies with the addition of antioxidants were carried out on days 10 and 15, and relative fluorescence units were determined after incubation at 37°C for 30 minutes ().
Figure 7. DCFH-DA results of erythrocytes isolated from stored blood. Values are expressed as mean ± SE from five samples. Changes are analyzed by two-way ANOVA followed by Bonferroni's post-test using Graphpad Prism software. P < 0.05 was considered significant. Values between groups are represented in upper case, while values within a group are represented in lower case. Those not sharing the same letters are significant.
Vitamin C
Maximum reduction in ROS was observed at 500 µM concentration of VC on days 10 and 15 in stored erythrocytes ().
Table 2. DCFH-DA results of stored erythrocytes with antioxidants
L-carnitine
Maximum inhibition of ROS production was observed at 500 mM concentration of LC on days 10 and 15 in stored erythrocytes ().
Curcumin
Maximum inhibition of ROS production was observed at 50 and 500 mM concentrations of curcumin on days 10 and 15, respectively, in stored erythrocytes ().
Discussion
OS is induced in erythrocytes by storage, outside the physiological system in CPDA-1 solution at 4°C. During storage, erythrocytes undergo structural and functional changes that may reduce function and viability after transfusion.Citation51 Changes accompanying the storage of erythrocytes are known as the ‘storage lesion’, which can be defined as a series of biochemical and biomechanical changes in the erythrocyte and storage media during ex vivo preservation that reduce erythrocyte survival and function.Citation52 Time-dependent oxidative modifications of membrane lipids and proteins as well as reduced antioxidant defense systems seem to destabilize the stored erythrocytes.Citation51 This reduced antioxidant power is clearly indicated by the reduced TACCUPRAC and AOA activity in the controls, as storage progressed.
Studies on markers of OS namely, antioxidant enzymes (superoxide dismutase and glutathione peroxidase – GSH-Px), protein oxidation (sulfhydryls (P-SH) – hemolysate and membrane), and lipid peroxidation were previously carried out, in stored rat blood, with antioxidant additives. The antioxidants played a role in maintaining lipid peroxidation and protein oxidation products, while activating antioxidant enzymes (R. Soumya and R. Vani, unpublished data).
VC (ascorbic acid) acts in the aqueous phase as a chain breaking antioxidant. VC reduces superoxide and lipid peroxyl radicals, but is also a well-known synergistic agent for vitamin E. It has been shown to play a protective role against peroxidation of erythrocyte membrane lipids.Citation53,Citation54 Ascorbic acid serves as both an antioxidant and a pro-oxidant. As a pro-oxidant, it generates cofactors of activated oxygen radicals during the promotion of lipid peroxidation, in the presence of Fe3+ or Cu2+ ions.Citation55 Ascorbic acid has been shown to scavenge free radicals directly in the aqueous phases of cells and the circulatory system.Citation56 The use of the CUPRAC–BCS assay for determination of ascorbic acid has been well documented.Citation30 The TACCUPRAC varied among the different concentrations of VC added. Peaks observed on days 10 and 15 were indicative of maximum AOA in lower concentrations of VC, which was in conjunction with the maximum ROS. Higher concentration of 60 mM however, showed lesser TACCUPRAC activity with storage, indicative of the scavenging of free radicals on initial days of storage by VC itself. AOA results showed that VC at lower concentrations could benefit the erythrocytes. Maximum AOA activity on day 10 in all groups could be attributed to the maximum ROS production. The results of CUPRAC–BCS and AOA assays were in conjunction with (i) the DCFH-DA results, where VC at 500 µM concentration was found to inhibit maximum ROS production and (ii) the results obtained in the earlier work. In the previous studies, lower levels of GSH-Px were found in the VC groups, indicative of higher levels of GSH in the system. These results were also in accordance with the maintenance of P-SH in hemolysate and membrane.
Erythrocytes have substantial amounts of LC and its estersCitation57 with AOA.Citation58 They also contain carnitine palmitoyltransferaseCitation59 an enzyme that catalyzes the reversible transfer of the acyl moiety from coenzyme A to LC.Citation60 LC or its short-chain esters have demonstrated a positive effect on the stability of erythrocyte membranes under various adverse conditions.Citation56,Citation60–Citation63 Addition of LC to erythrocytes, when stored at 4°C, showed decreased hemolysis and improved in vivo viability.Citation64 In LC 30 and LC 60, antioxidant power normalized towards the end of storage, which can be attributed to decrease in free radicals and action of the added antioxidants. Maximum TACCUPRAC in LC 10 was observed in the middle of storage due to the maximum ROS produced. The addition of LC proved to be beneficial as the AOA increased on days of increased ROS production. Contradictory to the VC results, LC at higher concentrations seemed to be effective in combating the induced stress, which was in accordance with the DCFH-DA and previous results. The LC groups showed increased levels of GSH, corroborated by the results of lower GSH-Px levels and stable P-SH levels.
Curcumin is an important nutraceutical and is a non-toxic, highly promising natural compound having a wide spectrum of biological functions such as anti-inflammatory, hepato- and nephroprotective, antioxidant,Citation65,Citation66 antimicrobial, anticarcinogenic, and thrombosis-suppressing properties.Citation67 The curcuminoids have been shown to be scavengers of free radicals and ROS, such as hydroxyl radicals, superoxide radicals,Citation68–Citation70 singlet oxygen, peroxyl radicals, and peroxynitrite, whose production is implicated in the induction of OS.Citation71–Citation75 In erythrocytes, curcumin has been shown to impair ROS generation.Citation76 Curcumin has been found to be at least 10 times more active as an antioxidant than even vitamin E.Citation77 Curcumin prevents the oxidation of hemoglobin and inhibits lipid peroxidation. The AOA of curcumin could be mediated through antioxidant enzymes such as superoxide dismutase, catalase, and GSH-Px.Citation78 Increased TACCUPRAC was observed in the Cur 10 samples during storage, while in the other groups activity was low and normalized towards the end of storage. The higher concentrations of curcumin scavenged free radicals throughout storage. In AOA, the curcumin results showed that all concentrations amplified AOA on day 10. In Cur 30 and Cur 60, decrease in AOA towards the end of storage is in accordance with the decrease in ROS, indicating effective free radical scavenging by curcumin. The addition of curcumin to the blood was beneficial in scavenging the free radicals and increasing AOA, in accordance with the DCFH-DA. In earlier studies, the addition of curcumin was successful in maintaining GSH levels (as observed by the results of GSH-Px and P-SH in hemolysate) but ineffective in protecting the P-SH groups in the erythrocyte membrane. The TAC and AOA results are in accordance with the results of GSH-Px and P-SH (hemolysate).
Conclusion
VC at lower concentrations and LC and curcumin at higher concentrations could benefit the erythrocytes during storage. The DCFH-DA assay was clearly indicative of the effect of the additives on erythrocytes of stored blood. The CUPRAC–BCS and AOA assays determined the TAC of the stored erythrocytes in controls and experimentals, supported by the DCFH-DA and previous results. Thus, the present study demonstrates the effective use of the CUPRAC–BCS and AOA assays as reliable markers of TAC in erythrocytes, especially during storage.
Disclaimer statements
Contributors RV made substantial contributions to the research design and preparation of the research article. RS carried out the experiments, analyzed the data, and prepared the article.
Funding None.
Conflicts of interest None.
Ethics approval Animal care and maintenance was in accordance with the ethical committee regulations (841/b/04/CPCSEA).
Acknowledgments
The authors acknowledge Dr Leela Iyengar and Jain University for their support. The authors acknowledge Mr Edwin Richard and Mr Srikanth HS for assistance with fluorescence readings. The authors also acknowledge the award of INSPIRE-Fellowship from the Department of Science and Technology (DST), India to Ms Soumya.
References
- Sies H. Role of reactive oxygen species in biological processes. Wien Klin Wochenschr. 1991;69:965–8.
- Halliwell B, Whiteman M. Measuring reactive species and oxidative damage in vivo and in cell culture: how should you do it and what do the results mean? Br J Pharmacol. 2004;142:231–55.
- Gülçin İ. Antioxidant activity of food constituents: an overview. Arch Toxicol. 2012;86:345–91.
- Halliwell B, Gutteridge JMC. Oxygen toxicity, oxygen radicals, transition metals and disease. Biochem J. 1984;219:1–14.
- Bartosz G. Non-enzymatic antioxidant capacity assays: limitations of use in biomedicine. Free Radic Res. 2010;44:711–20.
- Ghiselli A, Serafini M, Natella F, Scaccini C. Total antioxidant capacity as a tool to assess redox status: critical view and experimental data. Free Radic Biol Med. 2000;29:1106–14.
- Campos C, Guzman R, Lopez-Fernandez E, Casado A. Evaluation of the copper (II) reduction assay using bathocuproinedisulfonic acid disodium salt for the total antioxidant capacity assessment: the CUPRAC–BCS assay. Anal Biochem. 2009;392:37–44.
- MacDonald-Wicks LK, Wood LG, Garg ML. Methodology for the determination of biological antioxidant capacity in vitro: a review. J Sci Food Agric. 2006;86:2046–56.
- Burlakova EB, Dziuba NM, Pal'mina NP, Emanuel NM. Antioxidative activity of lipids of mouse liver in radiation disease and reinoculation leucosis, and the effect of inhibitors of free-radical reactions. Dokl Akad Nauk SSSR 1965;163:1278–81.
- Burlakova EB, Dziuba NM. Synthetic inhibitors and natural antioxidants. II. The antioxidative activity of liver lipids of irradiated mice and the radioprotective effect of inhibitors of free radical reactions. Biofizika 1966;11:54–7.
- Wayner DD, Burton GW, Ingold KU, Locke SJ. Quantitative measurement of the total, peroxyl radical-trapping antioxidant capability of human blood plasma by controlled peroxidation. The important contribution made by plasma proteins. FEBS Lett. 1985;187:33–7.
- Wayner DD, Burton GW, Ingold KU, Barclay LR, Locke SJ. The relative contributions of vitamin E, urate, ascorbate and proteins to the total peroxyl radical-trapping antioxidant activity of human blood plasma. Biochim Biophys Acta 1987;924:408–19.
- Winston GW, Regoli F, Dugas AJJ, Fong JH, Blanchard KA. A rapid gas chromatographic assay for determining oxyradical scavenging capacity of antioxidants and biological fluids. Free Radic Biol Med. 1998;24:480–93.
- Regoli F, Winston GW. Quantification of total oxidant scavenging capacity of antioxidants for peroxynitrite, peroxyl radicals, and hydroxyl radicals. Toxicol Appl Pharmacol. 1999;156:96–105.
- Miller NJ, Rice-Evans C, Davies MJ, Gopinathan V, Milner A. A novel method for measuring antioxidant capacity and its application to monitoring the antioxidant status in premature neonates. Clin Sci. 1993;84:407–12.
- Rice-Evans CA, Miller NJ. Total antioxidant status in plasma and body fluids. Methods Enzymol. 1994;234:279–93.
- Ou B, Hampsch-Woodill M, Prior RL. Development and validation of an improved oxygen radical absorbance capacity assay using fluorescein as the fluorescent probe. J Agric Food Chem. 2001;49:4619–26.
- Ghiselli A, Serafini M, Maiani G, Azzini E, Ferro-Luzzi A. A fluorescence-based method for measuring total plasma antioxidant capability. Free Radic Biol Med. 1995;18:29–36.
- Cao G, Alessio HM, Cutler RG. Oxygen-radical absorbance capacity assay for antioxidants. Free Radic Biol Med. 1993;14:303–11.
- Benzie IFF, Strain JJ. The ferric reducing ability of plasma (FRAP) as a measure of ‘Antioxidant Power’: the FRAP assay. Nutr Res. 1996;76:70–6.
- Choy CK, Benzie IFF, Cho P. Ascorbic acid concentration and total antioxidant activity of human tear fluid measured using the FRASC assay. Invest Ophthalmol Vis Sci. 2000;41:3293–8.
- Apak R, Güçlü K, Özyürek M, Karademir SE, Altun M. Total antioxidant capacity assay of human serum using copper(II)-neocuproine as chromogenic oxidant: the CUPRAC method. Free Radic Res. 2005;39:949–61.
- Re R, Pellegrini N, Proteggente A, Pannala A, Yang M, Rice-Evans C. Antioxidant activity applying an improved ABTS radical cation decolorization assay. Free Radic Biol Med. 1999;26:1231–7.
- Pellegrini N, Re R, Yang M, Rice-Evans C. Screening of dietary carotenoids and carotenoid-rich fruit extracts for antioxidant activities applying 2,2′-azinobis(3-ethylenebenzothiazoline-6-sulfonic acid radical cation decolorization assay. Methods Enzymol. 1999;299:379–89.
- Blois MS. Antioxidant determinations by the use of a stable free radical. Nature 1958;181:1199–200.
- Bondet V, Brand-Williams W, Berset C. Kinetics and mechanisms of antioxidant activity using the DPPH free radical method. Food Sci Technol. 1997;30:609–15.
- Mehdi MM, Rizvi SI. N,N-Dimethyl-p-phenylenediamine dihydrochloride-based method for the measurement of plasma oxidative capacity during human aging. Anal Biochem. 2013;436:165–7.
- Koracevic D, Koracevic G, Djordjevic V, Andrejevic S, Cosic V. Method for the measurement of antioxidant activity in human fluids. J Clin Pathol. 2001;54:356–61.
- Çelik SE, Özyürek M, Güçlü K, Apak R. CUPRAC total antioxidant capacity assay of lipophilic antioxidants in combination with hydrophilic antioxidants using the macrocyclic oligosaccharide methyl β-cyclodextrin as the solubility enhancer. React Funct Polym. 2001;67:1548–60.
- Özyürek M, Güçlü K, Bektaşoğlu B, Apak R. Spectrophotometric determination of ascorbic acid by the modified CUPRAC method with extractive separation of flavonoids-La(III) complexes. Anal Chim Acta 2007;588:88–95.
- Karaman S, Tütem E, Başkan KS, Apak R. Comparison of total antioxidant capacity and phenolic composition of some apple juices with combined HPLC–CUPRAC assay. Food Chem. 2010;120:1201–9.
- Özyürek M, Bekatşoglu B, Güçlü K, Gungor N, Apak R. A novel hydrogen peroxide scavenging assay of phenolics and flavonoids using cupric reducing antioxidant capacity (CUPRAC) methodology. J Food Comp Anal. 2010;23:689–98.
- Apak R, Güçlü K, Özyürek M, Karademir SE, Erçağ E. The cupric ion reducing antioxidant capacity (CUPRAC) and polyphenolic content of some herbal teas. Int J Food Sci Nutr. 2006;57:292–304.
- Güçlü K, Altun M, Özyürek M, Karademir SE, Apak R. Antioxidant capacity of fresh, sun- and sulfited-dried malatya apricot (Prunus armeniaca) assayed by CUPRAC, ABTS/TEAC and Folin methods. Int J Food Sci Technol. 2006;41:76–85.
- Badarinath AV, Rao KM, Chetty CMS, Ramkanth S, Rajan TVS, Gnanaprakash K. A review on in vitro antioxidant methods: comparisons, correlations and considerations. Int J PharmTech Res. 2010;2:1276–85.
- Da Cruz G. Use of bathocuproine for the evaluation of the antioxidant power in liquids and solutions. US patent 6613577. 2003.
- Gorinstein S, Leontowicz M, Leontowicz H, Najman K, Namiesnik J, Park YS, et al. Supplementation of garlic lowers lipids and increases antioxidant capacity in plasma of rats. Nutr Res. 2006;26:362–8.
- Park YS, Jung ST, Kang SG, Delgado-Licon E, Katrich E, Tashma Z, et al. Effect of ethylene treatment on kiwifruit bioactivity. Plant Foods Hum Nutr. 2006;61:151–6.
- Park YS, Jung ST, Kang SG, Heo BG, Arancibia-Avila P, Toledo F, et al. Antioxidants and proteins in ethylene-treated kiwifruits. Food Chem. 2008;107:640–8.
- Gorinstein S, Lojek A, Ciz M, Pawelzik E, Delgado-Licon E, Medina OJ, et al. Comparison of composition and antioxidant capacity of some cereals and pseudocereals. Int J Food Sci Technol. 2008;43:629–37.
- Stef DS, Iosif G, Ioan-Trasca T, Stef L, Pop C, Harmanescu M, et al. Evaluation of 33 medicinal plant extracts for the antioxidant capacity and total phenols. J Food Agric Environ. 2010;8:207–10.
- Özyürek M, Güçlü K, Apak R. The main and modified CUPRAC methods of antioxidant measurement. Trends Anal Chem. 2011;30:652–4.
- Yıldız L, Başkan KS, Tütem E, Apak R. Combined HPLC-CUPRAC (cupric ion reducing antioxidant capacity) assay of parsley, celery leaves, and nettle. Talanta 2008;77:304–13.
- Bener M, Özyürek M, Güçlü K, Apak R. Development of a low-cost optical sensor for cupric reducing antioxidant capacity measurement of food extracts. Anal Chem. 2010;82:4252–8.
- Apak R, Güçlü K, Özyürek M, Karademir SE. A novel total antioxidant capacity index for dietary polyphenols, vitamins C and E, using their cupric ion reducing capability in the presence of neocuproine: CUPRAC method. J Agric Food Chem. 2004;52:7970–81.
- Çelik A, Herken EN, Arslan I, Ozel MZ, Mercan N. Screening of the constituents, antimicrobial and antioxidant activity of endemic Origanum hypericifolium. Nat Prod Res. 2010;24:1568–77.
- Özyürek M, Bektasoğlu B, Güçlü K, Apak R. Hydroxyl radical scavenging assay of phenolics and flavonoids with a modified cupric reducing antioxidant capacity (CUPRAC) method using catalase for hydrogen peroxide degradation. Anal Chim Acta 2008;616:196–206.
- Vani R, Koshy AA, Koushik AK, Kaur H, Kumari K, Agrawal M, et al. The efficacy of erythrocytes isolated from blood stored under blood bank conditions. Transfus Apher Sci. 2012;47:359–64.
- Dodge JT, Mitchell C, Hanahan DJ. The preparation and chemical characteristics of hemoglobin-free ghosts of human erythrocytes. Arch Biochem Biophys. 1963;100:119–30.
- Blasa M, Angelino D, Gennari L, Ninfali P. The cellular antioxidant activity in red blood cells (CAA-RBC): a new approach to bioavailability and synergy of phytochemicals and botanical extracts. Food Chem. 2011;125:685–91.
- Kucukakin B, Kocak V, Lykkesfeldt J, Nielsen HJ, Magnussen K, Rosenberg J, et al. Storage-induced increase in biomarkers of oxidative stress and inflammation in red blood cell components. Scand J Clin Lab Invest. 2011;71:299–303.
- Tinmouth A, Fergusson D, Yee IC, Hebert PC. Clinical consequences of red cell storage in the critically ill. Transfusion 2006;46:2014–27.
- Cimen MYB. Free radical metabolism in human erythrocytes. Clin Chim Acta 2008;390:1–11.
- Beyer ER. The role of ascorbate in antioxidant protection of biomembranes: interaction of vitamin E and coenzyme Q. J Bioenerg Biomembr. 1994;26:349–58.
- Yu BP. Cellular defenses against damage from reactive oxygen species. Immunol Rev. 1994;14:139–62.
- Devi SA, Vani R, Subramanyam MVV, Reddy SS, Jeevaratnam K. Intermittent hypobaric hypoxia-induced oxidative stress in rat erythrocytes: protective effect of vitamin E, vitamin C and carnitine. Cell Biochem Funct. 2007;25:221–31.
- Cooper MB, Forte CA, Jones DA. Carnitine and acetylcarnitine in red blood cells. Biochim Biophys Acta 1988;959:100–5.
- Gülçin I. Antioxidant and antiradical activities of L-carnitine. Life Sci. 2006;78:803–11.
- Ramsay RR, Mancinelli G, Arduini A. Carnitine palmitoyl-transferase in human erythrocyte membrane: properties and malonyl-CoA sensitivity. Biochem J. 1991;275:685–8.
- Bieber LL. Carnitine. Ann Rev Biochem. 1988;57:261–83.
- Kobayashi A, Watanabe H, Fujisawa S, Yamamoto T, Yamazaki T. Effects of L-carnitine and palmitoylcarnitine on membrane fluidity of human erythrocytes. Biochim Biophys Acta 1989;986:83–8.
- Watanabe H, Kobayashi A, Hayashi H, Yaniazaki N. Effects of long-chain acyl carnitine on membrane fluidity of human erythrocytes. Biochim Biophys Acta 1989;980:315–8.
- Arduini A, Rossi M, Mancinelli G, Belfiglio M, Scurti R, Radatti G, et al. Effect of L-carnitine and acetyl-L-carnitine on the human erythrocyte membrane stability and deformability. Life Sci. 1990;47:2395–400.
- Arduini A, Holme S, Sweeney JD, Dottori S, Sciarroni AF, Caluani M. Addition of L-carnitine to additive solution-suspended red cells stored at 4°C reduces in vitro hemolysis and improves in vivo viability. Transfusion 1997;37:166–74.
- Ruby AJ, Kuttan G, Babu KD, Rajasekharan KN, Kuttan R. Anti-tumour and antioxidant activity of natural curcuminoids. Cancer Lett. 1995;94:79–83.
- Venkatesen P, Unnikrishnan MK, Kumar MS, Rao MNA. Effect of curcumin analogues on oxidation of haemoglobin and lysis of erythrocytes. Curr Sci. 2003;84:74–8.
- Kaur G, Meena C. Amelioration of obesity, glucose intolerance, and oxidative stress in high-fat diet and low streptozotocin-induced rats by combination consisting of ‘Curcumin with Piperine and Quercetin’. ISRN Pharmacol. 2012 Article ID 957283. DOI:10.5402/2012/957283.
- Kunchandy E, Rao MNA. Oxygen radical scavenging activity of curcumin. Int J Pharm. 1990;58:237–40.
- Reddy AC, Lokesh BR. Studies on anti-inflammatory activity of spice principles and dietary n-3 polyunsaturated fatty acids on carrageenan-induced inflammation in rats. Ann Nutr Metabol. 1994;38:349–58.
- Basnet P, Skalko-Basnet N. Curcumin: an anti-inflammatory molecule from a curry spice on the path to cancer treatment. Molecules 2011;16:4567–98.
- Ahsan H, Parveen N, Khan NU, Hadi SM. Pro-oxidant, antioxidant and cleavage activities on DNA of curcumin and its derivatives demethoxycurcumin and bisdemethoxycurcumin. Chem Biol Interact. 1991;121:161–75.
- Kim JE, Kim AR, Chung HY, Han SY, Kim BS, Choi JS. In vitro peroxynitrite scavenging activity of diarylheptanoids from Curcuma longa. Phytother Res. 2003;17:481–4.
- Somparn P, Phisalaphong C, Nakornchai S, Unchern S, Morales NP. Comparative antioxidant activities of curcumin and its demethoxy and hydrogenated derivatives. Biol Pharm Bull. 2007;30:74–8.
- Subramanian M, Sreejayan N, Rao MN, Devasagayam TP, Singh BB. Diminution of singlet oxygen-induced DNA damage by curcumin and related antioxidants. Mutat Res. 1994;311:249–55.
- Sreejayan N, Rao MN. Free radical scavenging activity of curcuminoids. Arzneimittelforschung 1996;46:169–71.
- Tonnesen HH, Greenhill JV. Studies on curcumin and curcuminoids. XXII. Curcumin as a reducing agent and as a radical scavenger. Int J Pharm. 1992;87:79–87.
- Khopde SM, Priyadarshini KI, Venkatesan P, Rao MN. Free radical scavenging ability and antioxidant efficiency of curcumin and its substituted analogue. Biophys Chem. 1990;80:85–91.
- Ak T, Gülçin I. Antioxidant and radical scavenging properties of curcumin. Chem Biol Interact. 2008;174:27–37.