
ABSTRACT
Introduction: Tuberculosis remains a global health problem and pharmacokinetic variability has been postulated as one of the causes of treatment failure and acquired drug resistance. New developments enable implementation of therapeutic drug monitoring, a strategy to evaluate drug exposure in order to tailor the dose to the individual patient, in tuberculosis treatment.
Areas covered: Literature on pharmacokinetics and pharmacodynamics of anti-tuberculosis drugs was explored to evaluate the effect of drug exposure in relation to drug susceptibility, toxicity and efficacy. New, down-sized strategies, like dried blood spot analysis and limited sampling strategies are reviewed. In addition, molecular resistance testing of Mycobacteria tuberculosis, combining a short turn-around time with relevant information on drug susceptibility of the causative pathogen was explored. Newly emerging host biomarkers provide information on the response to treatment.
Expert opinion: Therapeutic drug monitoring can minimize toxicity and increase efficacy of tuberculosis treatment and prevent the development of resistance. Dried blood spot analysis and limited sampling strategies, can be combined to provide us with a more patient friendly approach. Furthermore, rapid information on drug susceptibility by molecular testing, and information from host biomarkers on the bacteriological response, can be used to further optimize tuberculosis treatment.
1. Introduction
Although tuberculosis (TB) mortality has fallen by 47% since 1990, it will remain a huge medical, social, and financial problem throughout the world for the coming decades. The World Health Organization (WHO) estimated that in 2014 about 9.6 million children, women, and men fell ill from TB. Twelve percent of these were human immunodeficiency virus (HIV) positive and of the 1.5 million who died from TB, 400,000 were HIV positive.[Citation1] One of the problems that facilitates ongoing transmission is the lack of early diagnosis. Only 63% of the new TB cases were diagnosed, and an even smaller proportion of multidrug-resistant (MDR)-TB disease is diagnosed. Approximately, 25% of the estimated annual number of prevalent 480,000 MDR-TB cases are detected and reported. The notification of MDR-TB and extensively drug resistant (XDR)-TB has risen in recent years, while the incidence rates of susceptible TB are slowly decreasing.[Citation1] Most MDR-TB cases are nowadays detected by molecular testing of the infecting mycobacteria. There are no exact data on the prevalence of more extended resistance profiles in this group. By molecular testing, we do know there is at least resistance to rifampicin and isoniazid, but molecular testing provides no information on to which alternative drugs the strain is still susceptible. Therefore, the true magnitude of the problem of drug-resistant TB in the world is in fact unknown. After the start of an effective drug regime, it was shown that transmission almost immediately stops.[Citation2] An effective treatment regime for TB, that prevents relapse after treatment completion, needs to be based on sufficient effective drugs in an effective dose for a sufficient duration. The standardized regimen for drug-susceptible TB was found to lead to treatment success in 85% of the cases.[Citation1] Further optimization by identifying patients that are over- or undertreated would be expected to increase treatment success rate further. Therapeutic drug monitoring (TDM) would help detect patients receiving a too high or too low drug dose and allow them to be provided with individualized treatment.[Citation3] TDM for TB includes evaluation of both pharmacokinetics (PK) and pharmacodynamics (PD) to enable individualized treatment optimization.
1.1. PK
PK describes what happens with a drug in the body. Generally, the drug is absorbed (A) into the systemic circulation after oral intake, after which it is distributed (D) throughout the body including to the TB infection sites. After metabolism (M) mainly by the liver, eventually the drugs are eliminated (E) mainly by the kidneys and released in the urine.[Citation4] Integration of these parameters results in a PK model that describes these processes (ADME) ().
Figure 1. Pharmacokinetic/pharmacodynamic integration.
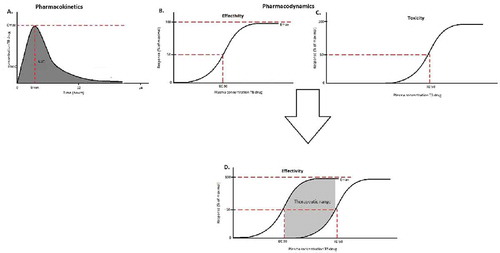
PK of TB drugs are not only influenced by the physical and chemical properties of the drug, but are also dependent on patient characteristics, such as age, gender, or kidney- or liver function.[Citation4,Citation6] PK variability is a well-known problem affecting drug exposure and thereby TB treatment.[Citation7,Citation8] For example, Pranger et al. observed a nine-fold variability in the area under the time concentration curve between 0 and 24 h (area under the curve [AUC0–24 h]) of moxifloxacin, possibly due to variation in protein binding. This led to suboptimal as well as potential toxic concentrations of moxifloxacin given in the same dosage of 400 mg.[Citation9] The most relevant measure of drug exposure is AUC0–24 h. To assess drug exposure, generally multiple samples are collected.[Citation7]
1.2. PD
PD describes effect of the drug on the target, for the purpose of this review on, Mycobacterium tuberculosis (Mtb). Anti-TB drugs can be subdivided in bactericidal and bacteriostatic drugs. The maximum effect of a drug is described by maximum effect (Emax). The EC50 is the concentration at 50% of Emax and describes the potency of the drug (). To describe the susceptibility of a pathogen to a drug, generally the minimal inhibitory concentration (MIC) is used, which reflects the drug concentration that is associated with >99% inhibition of growth of the pathogen.[Citation1,Citation10] Not only the effect of the drug on the pathogen, but also the effect of the drug on the patient, the toxicity, is described by PD (). When both the efficacy and the toxicity curves of the anti-TB drug are described in one figure, the therapeutic range can be derived (). The therapeutic range is the concentration at which the TB drug has high efficacy with low toxicity.
1.3. PK/PD
PK/PD integrates both concentration and effect of a drug in time. PK/PD focuses on the efficacy of the drug on Mtb as well as the toxicity on the patient. The in vitro Hollow Fiber infection model, in which the exposure to drugs can be varied, has been used to elucidate PK/PD indices for many anti-TB drugs ().[Citation10–Citation12] However, PK/PD indices can also be elucidated in preclinical and clinical studies by dose-fractionation studies and early bactericidal (EBA) studies. Dose-fractionation studies in preclinical models are often used to determine which PK/PD parameter is most important for the anti-TB drug. EBA studies measure the ability of anti-TB drugs to reduce the burden of Mtb in sputum to determine the efficacy of treatment. In contrast to dose-fractionation studies, EBA studies do not break the collinearity of PK/PD parameters.[Citation10,Citation13] For most anti-TB drugs, the AUC0–24 h relative to the MIC has been suggested as the best parameter to predict in vivo efficacy of drugs against Mtb.[Citation9–Citation11,Citation14] As only unbound drug is active, the free AUC is often used as a target.[Citation9,Citation11,Citation15] Other PK/PD parameters are peak concentration (Cmax)/MIC ratio or the time the concentration exceeds the MIC (T > MIC) ().[Citation16] If PK/PD targets are not met, this results in selection of resistant bacteria.[Citation10,Citation17]
Table 1. Pharmacokinetic and pharmacodynamic markers of antituberculosis drugs for the use of therapeutic drug monitoring [Citation7,Citation10,Citation18–Citation20].
2. Current status
The current programmatic TB treatment regimens use the principle of ‘One size fits all.’ Due to the PK variability, however, this carries the risk of hidden monotherapy that may result in treatment failure and development of drug resistance. More and more information is becoming available showing that underdosing is an important factor in the development of resistance.[Citation34,Citation35] Srivastava stated that pharmacological variability is also a factor that needs to be taken into consideration and could be an underlying reason for the occurrence of resistance.[Citation36] The use of TDM is not yet standard in the treatment of TB, neither is the way it is performed. No official guidelines for TDM are available at international (e.g. WHO) or national health organizations. The WHO recommends the use of drug susceptibility testing (DST) for (resistant) TB.[Citation1] There are only a limited number of laboratories in the world providing reliable and reproducible susceptibility testing on first-line drugs.[Citation37] Nowadays, most MDR-TB cases are diagnosed by the detection of mutations related to rifampicin resistance, for instance by the GeneXpert.[Citation38] This is a fast and relatively cheap diagnostic tool, but does not yield information on an alternative and effective treatment regime to be used when resistance occurs. A phenotypic resistance testing pattern, based on exact MIC’s and not breakpoints, is needed to enable PK/PD-guided dosing using TDM.[Citation39] Unfortunately, this is a time- and money-consuming procedure taking up to 10 weeks before the definite resistance pattern for second-line and third-line drugs becomes available. This implicates that in most cases treatment is started empirically using a standardized programmatic regime or an educated guess. Once drug susceptibility data have become available, the medication regime must be revised according to the results.
Using TDM, it is possible to adapt the dose, based on the drug concentration and thereby increase efficacy or prevent toxicity. Repeated sampling of blood is often required after a change of dose. The most frequent used sampling time points are 2 (C2 h)and 6 h (C6 h) post-drug intake. The C2 h is a surrogate of the peak plasma concentration (Cmax), which is linked to a certain time at which this peak concentration occurs (tmax) () [Citation7,Citation40] and the C6 h is often collected to evaluate potential delayed absorption.[Citation1,Citation40] Moreover, selected sample time points can be used to estimate the AUC precisely, referred to as limited sampling.[Citation16]
As already mentioned, to date, TDM is not recommended by the guidelines.[Citation21] However, to assess its value, the currently available data on efficacy, toxicity, and drug susceptibility is summarized.
2.1. Efficacy
To determine the efficacy of TB treatment, several measures are available: sputum smear conversion, sputum culture conversion, time to positivity, and treatment outcome. Sputum smear and culture conversion are defined by two consecutive negative sputum cultures at least 30 days apart.[Citation41,Citation42] Treatment outcome is either recorded as successful, defined as cured, treatment completed or still on treatment or recorded as failure defined as defaulted, relapsed or has deteriorated during treatment.[Citation1] Current treatment of drug susceptible TB with group 1 anti-TB drugs () is quite successful, with a treatment success rate of 85%.[Citation1] However, even though the treatment success target for MDR-TB was set on e75% by the WHO, this target has only been reached by a few countries.[Citation1] A MDR-TB treatment regimen is constructed, using ethambutol (if proven susceptible) and pyrazinamide in combination with second-line anti-TB drugs: an injectable in combination with a fluoroquinolone completed with group 4 drugs (ethionamide, cycloserine, and para-aminosaliciylic acid) ().[Citation21] The reference value for Cmax at a normal dose, which needs to be reached for effective treatment with these anti-TB drugs, is described in . There are several studies that describe the relationship between low drug levels and treatment failure. For example, a retrospectively evaluated cohort showing high treatment failure and high rates of acquired resistance indicated that most of these patients had low drug levels of rifampicin and isoniazid. After TDM, dose adjustments were made in 71.8% of the patients in order to increase plasma concentrations of the drugs, which led to variable results.[Citation43] The PK/PD index and the relationship with treatment outcome is difficult to study in ‘real-life.’ Technical complications with respect to drug concentration measurement and DST, long-term outcome evaluation, and budget restrains complicate these studies. Gumbo et al. did link sputum smear and the AUC0–24 h/MIC ratio for ciprofloxacin, which combines treatment outcome directly with PK/PD.[Citation17] The EBA is used to evaluate the efficacy of anti-TB drugs in this study. The EBA is based on the rate of decline in the bacterial density in sputum per day for the first few days of treatment. This study shows that when a mean MIC of TB isolates is known, the EBA that is found in human EBA studies is mediated through an AUC0–24 h/MIC ratio that is achieved in an in vitro TB model.[Citation13,Citation17]
The AUC0–24 h was also linked to treatment outcome in the study of Pasipanodya et al. (2013). They showed that the AUC of pyrazinamide, rifampicin, and isoniazid below a certain threshold, were predictors of a poor long-term outcome. They observed that poor outcomes were encountered in 32/78 patients with the AUC of at least one of these drugs below the threshold versus 3 out of 64 patients with AUC of all drugs above threshold.[Citation12] Another parameter that can be used for TDM is C2 h which has also been found to correlate with efficacy endpoints. For example, Prahl et al. (2014) found that patients with therapy failure had significantly lower C2 h of isoniazid and/or pyrazinamide, despite the fact that they received a higher dosage per kg of body weight. They also observed that more patients with both low rifampicin and isoniazid concentrations experienced therapy failure.[Citation44] These results, however, can be misinterpreted because C2 h might not represent the actual peak concentration. Therefore, a second sample might be necessary to make sure the drug absorption is assessed more completely.[Citation7] Furthermore, Chideya et al. found that pyrazinamide plasma concentrations below 35 µg/ml were a predictor of poor treatment outcome, which can function as a reference value in TDM.[Citation6] However, more studies are needed to elucidate PK/PD indices in ‘real life’ treatment, because the PK/PD index () of a drug in a combination regimen may differ from the index of that particular drug given as monotherapy in an EBA study.
2.2. Toxicity
It is well known that second-line anti-TB drugs are more toxic than first-line anti-TB drugs. The most severe and frequently observed adverse drug events are hematological changes, hepatotoxicity, immunological reactions, ototoxicity, nephrotoxicity, neurotoxicity, and neuromuscular blockade.[Citation45] Although many studies report on adverse effects of anti-TB drugs, there are relatively few that take plasma concentration into account. Ethambutol optical neuropathy, peripheral neuropathy due to isoniazid and pyrazinamide-induced hepatotoxicity, and QT-interval prolongation due to fluorquinolones are all dose-dependent,[Citation45] taking plasma concentration into account could reduce the occurrence of these toxicities. Satyaraddi et al. have studied the plasma-drug levels of first-line anti-TB drugs in 110 TB patients, in relation to hepatotoxicity. They showed that plasma rifampicin levels were higher in patients with drug-induced hepatotoxicity (DIH) than in controls. They found that a rifampicin Cmax at day 7 exceeding 12.50 mg/l, was associated with DIH in most patients.[Citation46] TDM of rifampicin might possibly reduce the occurrence of DIH, or reverse the toxicity without the need to withdraw the drug for DIH. Neuropsychiatric symptoms were shown to be associated with a cycloserine concentration above 40 µg/ml in a study of Holmes et al. Neuropsychiatric toxicities frequently require changes in DOTS-Plus regimens, including temporary suspension.[Citation47] TDM is intended for prevention of toxicity by individual dosing, neuropsychiatric toxicities could therewith be prevented. Torün et al. showed in their retrospective review of 263 patients that in 182 cases (69.2%) at least one side effect developed, and that in 146 cases (55.5%), one or more drugs were withdrawn from treatment due to side effects. These side effects were mostly due to amikacin ototoxicity or cycloserine neuropsychiatric toxicity.[Citation48] Other adverse effects of anti-TB drugs include ocular toxicity, which is more common with a daily dose of ethambutol above 30 mg/kg.[Citation18] Another study found that ocular toxicity may be due to overdosing of ethambutol in obese patients. Overdosing occurred in relation to the calculation of the dosage on total body weight. Ethambutol does not accumulate in fat tissue, which causes the dosage to be too high. They suggest ethambutol dosing according to lean body weight, for which more PK studies in obese patients are necessary.[Citation49] Linezolid is a second-line anti-TB drug that is found to have a higher degree of safety at a lower dose (≤600 mg a day), while it may still be effective at a dose of 300 mg.[Citation50–Citation52] Moreover, a dose of 600 mg is found to be safer than 1200 mg daily, with adverse effects occurring in respectively 14.3% and 54.4% of the cases, adverse effects mostly representing anemia and thrombocytopenia.[Citation41] If linezolid has to be used at a higher dose to maximize its efficacy, the toxic plasma concentrations should be closely monitored to minimize its toxicity.[Citation53] However, there is still research needed to determine reference values for toxic concentrations of most anti-TB drugs for adequate implementation of TDM.
2.3. Drug susceptibility
In order to select a treatment strategy for a TB patient, the drug susceptibility of the Mtb complex isolate to anti-TB drugs is determined on basis of growth inhibition in specialized laboratories. If the causative bacteria are ‘susceptible,’ the respective drug is included in the regimen; if the bacteria are considered ‘resistant,’ the drug is excluded.[Citation54]
Nowadays, the vast majority of the DST is performed in the mycobacteria growth indicator tube (MGIT) device at the ‘critical concentration.’ However, as recently published by an expert group in Europe, to adjust the dose of particular drugs in treatment, especially in complicated cases involving multidrug resistance and severe side effects, there is a need to determine the true MIC.[Citation22,Citation55,Citation56] This provides the possibility to increase the dose of the respective drug to overcome a reduced susceptibility.[Citation57,Citation58] Nowadays, MIC values of rifampicin near the breakpoint are also detected regularly.[Citation59]
In Bangladesh, this appeared to be a risk factor for treatment failure.[Citation60] Recent data showed that a higher dose of rifampicin is well tolerated;[Citation61] therefore, it may be considered in complicated cases to increase the dose of rifampicin. Nevertheless, evidence on long-term outcome supporting this approach is not yet available.
Another disadvantage of the use of the MGIT method for DST is that in fact only inhibition of growth of Mtb is measured and not the killing of bacteria. So this method does not take into account the survival of bacteria entering a stage of reduced metabolism to survive the harsh conditions. Furthermore, for particular drugs, like ethambutol, the reproducibility is questionable due to the close natural distribution of the MIC and the critical concentration.[Citation22,Citation55,Citation62]
2.4. Biomarkers
Nonspecific circulating biomarkers, whose kinetics are associated with the initiation of effective treatment, have been identified. Some of these biomarkers have the potential for point-of-care measurement, notably IP-10.[Citation63,Citation64] The clinical value for treatment optimization and the predictive power of these markers needs to be established in larger trials in different patient populations. To date, no biomarkers have been included in treatment evaluation.
3. Opportunities
3.1. Dried blood spots
Dried blood spot (DBS) analysis is a method in which a small amount of blood is collected on filter paper, after which it is allowed to air dry. At the moment of analysis, a circular punch is taken from the blood spot and eluted with solvent. Hereafter, the dried blood sample is ready to be analyzed.[Citation25] Blood concentrations of anti-TB drugs can be determined from the DBS using high performance liquid chromatography techniques coupled to mass spectrometry.[Citation65,Citation66] Allanson and colleagues were the first to examine the possibility of using DBS in the determination of the first-line anti-TB drug rifampicin in human plasma and blood spots.[Citation24] Vu and co-workers thereafter examined the simultaneous determination of rifampicin, clarithromycin, and their metabolites on basis of DBS.[Citation29] Both studies showed promising results for the use of DBS in TDM of anti-TB drugs. A recent review described which drugs used for pulmonary infections were potential candidates for the development and application of DBS monitoring from an analytical and clinical point of view.[Citation66] DBS has several advantages in comparison to conventional plasma sampling. First, the sampling is cheap and simple, while the blood can be directly analyzed from the blood spot and does not need time-consuming sample preparation. Second, DBS can be stored for longer time periods as a dried sample. This improves the stability and hence cooled shipment is unnecessary.[Citation28,Citation65] For example, the study of Vu showed that the second-line TB drug clarithromycin showed no significant degradation after exposure of the DBS at 50°C for 60 days. They also showed that rifampicin was stable for 2 months at ambient temperature.[Citation29] Because DBS improves stability, due to the use of dried blood, it could provide an answer for patients in remote areas where the temperature and humidity are high. Stability of samples under high temperature and humidity is of the utmost importance, because most of the new TB cases in 2014 were diagnosed in Southeast Asia and western Pacific regions (58%) and the African region (29%). Furthermore, the use of dried blood reduces the biohazard risk because it reduces contact with liquid blood, making it safe to use in high HIV prevalence areas. Also, FTA DMPK-A and B DBS cards have certain characteristics which makes them able to lyse cells and denature proteins on contact, making sure the blood is no longer virulent.[Citation66] However, further research should be performed to determine whether Mtb the DBS is still viable. Finally, DBS uses smaller blood volumes than conventional plasma sampling and is less invasively collected. This is especially important in children, because even sparse sampling, taking 3 ml of blood per sample, is often too much in relation to their limited total blood volume.[Citation67] From the 9.6 million new TB cases in 2014, an estimated 1.0 million were children.[Citation1] Although it is widely known that the PK of children is significantly different from that of adults, PK studies are usually not performed in children. Therefore, TDM of anti-TB drugs in children is needed. Because of the use of only a limited amount of blood in DBS, collected in a minimally invasive way, DBS could provide children with optimal drug dosing. The advantages of DBS analysis above conventional sampling make it an attractive analysis method for adults as well as children.
3.2. Limited sampling
Limited sampling is a strategy that uses a limited number of optimal sampling time points. In this approach, typically two or three [Citation11,Citation16,Citation23] samples are used to estimate the exposure. Optimal sampling times are calculated during limited sampling studies using PK models and Monte Carlo simulations. When the optimal sampling points have been obtained, they can be used to predict the AUC0–24 h, using population PK. For most anti-TB drugs, the AUC0–24 h/MIC ratio is the best parameter to predict efficacy.[Citation10,Citation17,Citation68] To determine the AUC0–24 h, conventionally 10–15 sample points are needed to cover 80% of the total AUC.[Citation11] A significant amount of blood samples are taken from the patients before- and at several time points after intake of the anti-TB drug.[Citation11,Citation15,Citation16,Citation23,Citation26,Citation27] However, blood sampling is invasive, and should be kept to a minimum. Limited sampling may be of help in minimizing the number of samples. Limited sampling has several other advantages over conventional blood sampling. Because it uses less samples, it is less expensive and less time consuming for the patient as well as for the laboratory analyzing the samples. Besides these advantages, there still remain some problems with limited sampling. For example, there is no qualification available on the laboratories where TDM should be performed. In contrast, according to the WHO guidelines, DST should only be performed at current good laboratory practices (cGLP) certified laboratories. It therefore seems plausible that TDM should also be performed at a cGLP laboratory. Not all laboratories in low- and middle-income countries are GLP licensed, TDM should therefore be performed at a central laboratory in the country that specializes in TDM. A central laboratory also has advantages for DBS analysis because it needs specialized equipment and standardized protocols. In the ideal situation, in each country DBS is performed at a central level along with sophisticated diagnostics. Currently, DBS samples can be sent to international labs, which is much cheaper compared to plasma samples as shipment on dry ice is not needed.[Citation66] Second, only few studies describe limited sampling for one of multiple anti-TB drugs. Alsultan et al. (2015) showed that with limited sampling at 1 and 6 h post dose an AUC could be estimated of levofloxacin.[Citation15] TDM could help find an optimal TB treatment by studying general optimal dosing and this could be performed in a simpler, less expensive, and less time consuming manner by using limited sampling. Limited sampling may be used for an accurate and precise estimation of the AUC0–24 h of a few anti-TB drugs, which are marked yes in . Limited sampling studies have to be performed for every anti-TB drug separately; therefore, more research is necessary to determine if limited sampling can be used for other anti-TB drugs.
3.3. Molecular testing
Because of the complications in phenotypic resistance testing, the acceptance of the molecular approach to determine the presence of resistance mutations of Mtb is increasing. Moreover, the information of molecular resistance tests is readily available. Whereas in the last two decades especially reverse line blot assays [Citation69–Citation71] were applied to detect or exclude the presence of particular resistance mutations in the genome of Mtb, nowadays whole genome sequencing (WGS) provides the possibility to detect all mutations previously associated with resistance.[Citation72] However, the general problem faced at the moment is that the predictive value of resistance mutations is not always clear, especially when they are rarely encountered.[Citation73] For the frequently observed mutations tested in reverse line blot assays, such as the ones associated with rifampicin and isoniazid, the positive- and negative-predictive value is high and this merits direct clinical use of these test results to steer the treatment.[Citation74] For other drugs, especially of the second-line category (), the predictive value is sometimes somewhat lower and this confuses the utility of this information. A part of the current confusion may well be caused by the low reproducibility of phenotypic resistance testing along with the fact that in reverse line blot assays only a small subset of the resistance mutations is revealed.
Table 2. Drug susceptibility test methods and critical concentrations for first- and second-line drug susceptibility tests together with molecular tests.
Nonetheless, with the introduction of WGS and hence the screening of the entire genome of Mtb for the presence of resistance mutations, the correlation of resistance indicators and the level of phenotypic resistance will improve rapidly, if this information is collected on a large scale, as is being done in several current initiatives.[Citation72,Citation81] It is conceivable that within a few years a large part of the phenotypic resistance testing could be avoided. Ideally also the correlation between the presence of particular resistance mutations and the level of resistance against all anti-TB drugs will be established, so the selection of the treatment regimen can be based solely on DNA analysis. This will speed up the adjustment of treatment and also avoid cumbersome, time consuming, and potentially dangerous, phenotypic resistance testing, requiring a complicated quality assurance. It has become conceivable in recent years that all information to select the proper treatment of TB in the majority of cases can be traced in the genome of the causative bacteria, also regarding the newly emerging drugs.[Citation82,Citation83] Just the collection of sufficient data to associate the occurrence of resistance mutations with phenotypic resistance, and eventually treatment outcome separates us from introducing this major improvement in TB control. If this becomes reality, most of the laboratory diagnosis for TB could be based on WGS analysis, that is identification of the causative agent to (sub)species- and genotype level, as well as resistance testing and epidemiological typing. This new approach may be much easier to implement in high-prevalence settings than the conventional approach that is based on the availability of a Biosafety Level 3 laboratory and many complicated procedures, which have proven hard to standardize.
3.4. Biomarkers
Established methods to measure bacterial killing include microscopy and culture performed at diagnosis and at month 2, and thereafter monthly until repeatedly negative. This is mostly referred to as AFB and culture conversion, respectively. Thus, these methods can only detect the effect of treatment after 2 months at the earliest. The currently available automated polymerase chain reaction assays are also unsuitable for tracking early bacterial killing, although adaptations to address this weakness have been proposed.[Citation84,Citation85] Innovations in microscopy, able to discriminate between viable and non-viable bacilli, are also under development.[Citation86,Citation87] Detection of mutations associated with resistance as a form of direct susceptibility testing also provides the possibility of predicting a failure to respond to certain drugs,[Citation88] as mentioned above. Interestingly, the possibility of objectively measuring host response by monitoring the kinetics of circulating host markers has recently received increased attention.[Citation89,Citation90] Measuring such markers in parallel with drug levels have the potential to facilitate and simplify personalized therapy. When biomarkers are measured in possibly infected plasma, appropriate measures for the protection of health care and laboratory workers must be implemented.
Here, we will briefly discuss the recent progression in identifying and validating host markers for treatment monitoring. These host markers used are not specific for TB but their potential for simple detection allows measurement of their kinetics in response to therapy, which may provide information to guide treatment and allow more complex specific laboratory-based assays to be targeted at the patients who are failing to respond to the therapy prescribed. Candidate biomarker selections have been based on systematic protein and mRNA profiling and on selection of cytokines/chemokines known to be associated with or involved in the immune response to TB infection.[Citation91–Citation93] It should be noted that for treatment monitoring circulating markers are of primary interest. The stimulated in vitro secretion of cytokines by white blood cells in response to challenge with TB antigens has also received considerable attention, but this is more suited to detecting previous exposure to and infection with TB.[Citation94]
From these studies a number of promising markers have been selected, a notable example is IP-10/CXCL-10, a chemokine involved in the establishment of a proinflammatory Th1 response. TB is associated with increased serum IP-10 levels [Citation93,Citation95–Citation97], and at completion of therapy, levels are significantly lower than before treatment/at diagnosis.[Citation64,Citation98,Citation99] This decrease is also measurable in the first weeks of therapy,[Citation63,Citation93] and therefore measurement of the kinetics of this cytokine during treatment may provide useful information on whether patients are responding to the prescribed drugs. It is also notable that host markers are present and detectable in all individuals. Unlike bacterial-derived markers such as LAM, which is one of the most promising bacterial derived biomarkers, which are still undetectable in most infected patients.[Citation100,Citation101] In fact, IP-10 is a particularly interesting treatment response biomarker as it has been shown to be stable in dried plasma spots [Citation64] and is present at high levels that are measurable with the new generation of simple near patient assays,[Citation102] which should facilitate rapid repeated costs effective measurement. IP10, however, measured at a single-time point cannot specifically identify TB, nor distinguish between TB and latent-TB infection. It is possible that combinations of biomarkers may be more informative,[Citation97,Citation99] or for example the kinetics of osteopontin combined with IP-10,[Citation103] which both appear to be associated with microscopic conversion.
The clinical value for treatment optimization and the predictive power of these markers for treatment monitoring need to be established in larger trials with different patient populations. To date, no biomarkers have been included in routine treatment evaluation.
3.5. Conclusion
TDM is currently not included in the management of TB treatment. To date, no randomized controlled trial has evaluated the potential benefits of this strategy for optimization of TB treatment. However, in current literature a lot of supportive evidence can be found. For example, in vitro studies have shown a relation between drug exposure and efficacy of treatment. In addition, acquired drug resistance could be predicted by these models. Furthermore, in actual patients a high variability in drug exposure has been shown for several drugs supporting the idea that drug exposure could play a significant role in treatment outcome. To overcome current hurdles to implement TDM in TB treatment, many new techniques have become available over the recent years. DBS analysis in combination with limited sampling strategies will enable more simple collection of patients’ samples to adequately assess drug exposure. Rapid diagnosis of bacterial resistance, using molecular tests (), will be enable to start the most appropriate drug regimen up front, preventing treatment with drugs that show resistance once results from classical drug susceptibility tests have become available. Biomarker kinetics linked to clinical response, is potentially easily measurable and may also help to optimize treatment.
4. Expert opinion
4.1. DBS
DBS shows promising results for application for TDM of anti-TB drugs in developed countries and less developed countries.[Citation29] However, some issues need to be addressed before DBS can be implemented for TDM. DBS has only been validated for a few drugs, which have been marked with yes in . The remaining anti-TB drugs must be individually validated for application of DBS.[Citation104] The validation process of DBS is more extensive than a normal method validation, while for example hematocrit variation has to be taken into account. Another problem is the blood spot sampling, while the blood spot has to satisfy certain requirements, such as filling the predefined 3 mm diameter circle with only one drop of blood. When these requirements are not met, analysis of the DBS sample cannot be performed. To make sure DBS is performed accurately, training of personnel is necessary. A future opportunity would be a combined LC–MS/MS method, where multiple anti-TB drug concentrations are determined from one DBS sample.[Citation105] This would reduce analyzing time and would provide an easier method. This seems to be a possibility looking at the study of Han et al.,[Citation106] but this need to be validated for DBS.
4.2. Limited sampling
Because PK/PD guided TDM requires an AUC for most of the anti-TB drugs, which is costly and time consuming, limited sampling could provide a long-awaited solution. Limited sampling time points need to be evaluated for each anti-TB drug individually. In order to obtain these, population PK studies are necessary, which are not readily available for all anti-TB drugs. To obtain this information, several studies remain to be conducted. In addition, it would be very helpful and an asset to TDM to have a limited sampling strategy that is suitable for more than one drug. Such a strategy is available for first-line drugs (), but has not been established for second-line drugs ().[Citation16] Furthermore, it is likely that limited sampling strategies need to be confirmed in different populations due to variability caused by pharmacogenetic differences. However, hopefully in the future this information is readily available for limited sampling to be performed routinely, because of the many advantages of limited sampling to conventional blood sampling.
4.3. Biomarkers and molecular testing
Using culture conversion and AFB conversion as indicators of treatment, response in the era of molecular diagnostics is too slow. A simple point of care test to objectively monitor clinical response would be highly valuable, especially if data on drug levels and bacterial genetic resistance markers are also available. This is a rapidly developing field, and initial combined results of multiple groups suggest measurement of circulating host markers contain highly valuable information on response within 14 days. However, monitoring of large cohorts of patients with- and without drug resistance and follow-up on treatment outcome is required for reliable validation. Much more focus is needed on treatment outcome and strategies to optimize the treatment of individual patients on the basis of clinical, bacteriological, and PK data. Drug susceptibility and resistance testing, including conventional DST and the detection of bacteriological genetic markers of resistance, could both serve as surrogate markers for patient response. If patient response could be measured directly and linked to blood drug levels and genotypic mutations, personalized treatment could be realized on a large scale. More data are expected on the impact of drug resistance and bacteriological factors (genotype and resistance profile) on host response and the link with successful outcome. But the ultimate challenge is to find predictors of cure or measure of relapse early in treatment. Therefore, much more effort should be put in the exploration and validation of host biomarker kinetics.
4.4. Integrated TDM approach to optimize TB treatment
To truly optimize TB treatment, an integrated approach a combination of all next generation tools is needed. The most appropriate drugs are selected, based on molecular resistance tests () and a combination of information on drug exposure and biomarker response with clinical expertise is employed to further tailor treatment to the individual patients’ needs ().
Figure 2. Next generation approach of integrated therapeutic drug monitoring approach including molecular testing and biomarker evaluation.
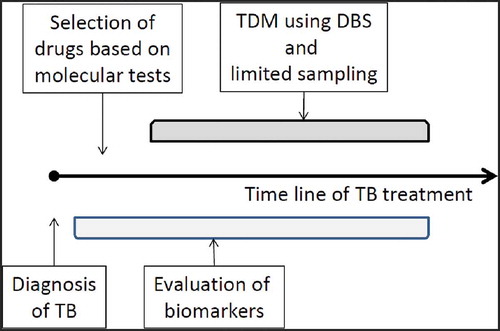
A new strategy, in which slow phenotypic evaluation of bacterial cultures can be avoided, will allow effective treatment to be much more rapidly identified and will allow failing patients to be provided with effective drugs. In addition, biomarker and drug exposure evaluation will avoid the need to wait for classical evaluation based on sputum culture conversion. However, also with these new markers, a rapid turnaround time of results and integration of all next generation tools is key to meeting the expectations of the clinician and the patient.
Although implementing TDM will increase the direct costs of TB treatment, it can prevent hospitalization due to toxicity and it can prevent development of drug resistance leading to MDR-TB treatment, which is even more expensive. To date, no randomized controlled trials have been performed comparing TDM with standard of care. Therefore a cost-effectiveness analysis is difficult to perform. This may hinder implementation of TDM in TB treatment.[Citation105,Citation107] TDM using limited sampling and available AUC/MIC indices, should be performed for isoniazid and rifampicin in selected patients to prevent the occurrence of MDR-TB. TDM has already been applied for second-line anti TB drugs to reduce toxicity and increase efficacy. However, due to lacking target values for some second-line anti-TB drugs and randomized clinical trials it has not yet been included in WHO treatment guidelines. In the ideal situation, TDM will be integrated in TB treatment to optimize care in individual patients.
Article highlights
TDM, tailoring the dose to the individual patient based on plasma concentrations, has the potential to improve therapy, but is not yet included in the treatment guidelines of TB of WHO.
TDM should ultimately be performed by using PK/PD targets, integrating both concentration and effect of the anti-TB drug in time, but for most anti-TB drugs these are still unknown.
Dried blood spots provide us with a more stable and patient friendly way, for the determination of plasma concentrations of anti-TB drugs as well as the diagnosis of TB, using IP-10 as a biomarker.
Limited sampling provides us with a new less expensive and less time-consuming way to determine the AUC of anti-TB drugs.
The rise of WGS and novel drug resistance testing methods provide opportunities to find mutations causing resistance in M. tuberculosis, that are currently still unknown.
Measurement of the kinetics of circulating host markers has potential to monitor treatment for the detection of treatment failures.
This box summarizes key points contained in the article.
Declaration of interest
The authors have no relevant affiliations or financial involvement with any organization or entity with a financial interest in or financial conflict with the subject matter or materials discussed in the manuscript. This includes employment, consultancies, honoraria, stock ownership or options, expert testimony, grants or patents received or pending, or royalties.
References
- Global tuberculosis report 2015 [Internet]. World Health Organization; 2015. Available from: http://apps.who.int/iris/bitstream/10665/191102/1/9789241565059_eng.pdf?ua=1; http://www.who.int/en/:.
- Nardell E, Dharmadhikari A. Turning off the spigot: reducing drug-resistant tuberculosis transmission in resource-limited settings. Int J Tuberc Lung Dis. 2010 Oct;14(10):1233–1243.
- Van Altena R, De Vries G, Haar CH, et al. Highly successful treatment outcome of multidrug-resistant tuberculosis in the netherlands, 2000–2009. Int J Tuberc Lung Dis. 2015 Apr;19(4):406–412.
- Overview of pharmacokinetics [Internet]. 2014. Available from: http://www.msdmanuals.com/professional/clinical-pharmacology/pharmacokinetics/overview-of-pharmacokinetics.
- Mehrotra N, Gupta M, Kovar A, et al. The role of pharmacokinetics and pharmacodynamics in phosphodiesterase-5 inhibitor therapy. Int J Impot Res. 2007 May–Jun;19(3):253–264.
- Chideya S, Winston CA, Peloquin CA, et al. Isoniazid, rifampin, ethambutol, and pyrazinamide pharmacokinetics and treatment outcomes among a predominantly HIV-infected cohort of adults with tuberculosis from botswana. Clin Infect Dis. 2009 Jun 15;48(12):1685–1694.
- Alsultan A, Peloquin CA. Therapeutic drug monitoring in the treatment of tuberculosis: An update. Drugs. 2014 Jun;74(8):839–854.
- Pasipanodya JG, Srivastava S, Gumbo T. Meta-analysis of clinical studies supports the pharmacokinetic variability hypothesis for acquired drug resistance and failure of antituberculosis therapy. Clin Infect Dis. 2012 Jul;55(2):169–177.
- Pranger AD, Van Altena R, Aarnoutse RE, et al. Evaluation of moxifloxacin for the treatment of tuberculosis: 3 years of experience. Eur Respir J. 2011 Oct;38(4):888–894.
- Gumbo T, Angulo-Barturen I, Ferrer-Bazaga S. Pharmacokinetic-pharmacodynamic and dose-response relationships of antituberculosis drugs: recommendations and standards for industry and academia. J Infect Dis. 2015 Jun 15;211(Suppl 3):S96–S106.
- Medellin-Garibay SE, Correa-Lopez T, Romero-Mendez C, et al. Limited sampling strategies to predict the area under the concentration-time curve for rifampicin. Ther Drug Monit. 2014 Dec;36(6):746–751.
- Pasipanodya JG, McIlleron H, Burger A, et al. Serum drug concentrations predictive of pulmonary tuberculosis outcomes. J Infect Dis. 2013 Nov 1;208(9):1464–1473.
- Diacon AH, Donald PR. The early bactericidal activity of antituberculosis drugs. Expert Rev Anti Infect Ther. 2014 Feb;12(2):223–237.
- Gumbo T, Louie A, Liu W, et al. Isoniazid bactericidal activity and resistance emergence: integrating pharmacodynamics and pharmacogenomics to predict efficacy in different ethnic populations. Antimicrob Agents Chemother. 2007 Jul;51(7):2329–2336.
- Alsultan A, An G, Peloquin CA. Limited sampling strategy and target attainment analysis for levofloxacin in patients with tuberculosis. Antimicrob Agents Chemother. 2015 Jul;59(7):3800–3807.
- Magis-Escurra C, Later-Nijland HM, Alffenaar JW, et al. Population pharmacokinetics and limited sampling strategy for first-line tuberculosis drugs and moxifloxacin. Int J Antimicrob Agents. 2014 Sep;44(3):229–234.
- Gumbo T, Louie A, Deziel MR, et al. Pharmacodynamic evidence that ciprofloxacin failure against tuberculosis is not due to poor microbial kill but to rapid emergence of resistance. Antimicrob Agents Chemother. 2005 Aug;49(8):3178–3181.
- Peloquin CA. Therapeutic drug monitoring in the treatment of tuberculosis. Drugs. 2002;62(15):2169–2183.
- Vaddady PK, Lee RE, Meibohm B. In vitro pharmacokinetic/pharmacodynamic models in anti-infective drug development: focus on TB. Future Med Chem. 2010 Aug;2(8):1355–1369.
- Lange C, Abubakar I, Alffenaar JW, et al. Management of patients with multidrug-resistant/extensively drug-resistant tuberculosis in europe: A TBNET consensus statement. Eur Respir J. 2014 Jul;44(1):23–63.
- World Health Organization. Treatment of tuberculosis guidelines. 4th ed. Geneva: World Health Organization; 2010.
- Gumbo T. New susceptibility breakpoints for first-line antituberculosis drugs based on antimicrobial pharmacokinetic/pharmacodynamic science and population pharmacokinetic variability. Antimicrob Agents Chemother. 2010 Apr;54(4):1484–1491.
- Sturkenboom MG, Mulder LW, De Jager A, et al. Pharmacokinetic modeling and optimal sampling strategies for therapeutic drug monitoring of rifampin in patients with tuberculosis. Antimicrob Agents Chemother. 2015 Aug;59(8):4907–4913.
- Allanson AL, Cotton MM, Tettey JN, et al. Determination of rifampicin in human plasma and blood spots by high performance liquid chromatography with UV detection: A potential method for therapeutic drug monitoring. J Pharm Biomed Anal. 2007 Aug 15;44(4):963–969.
- Vu DH, Koster RA, Alffenaar JW, et al. Determination of moxifloxacin in dried blood spots using LC-MS/MS and the impact of the hematocrit and blood volume. J Chromatogr B Analyt Technol Biomed Life Sci. 2011 May 1;879(15–16):1063–1070.
- Pranger AD, Kosterink JG, Van Altena R, et al. Limited-sampling strategies for therapeutic drug monitoring of moxifloxacin in patients with tuberculosis. Ther Drug Monit. 2011 Jun;33(3):350–354.
- Alffenaar JW, Kosterink JG, Van Altena R, et al. Limited sampling strategies for therapeutic drug monitoring of linezolid in patients with multidrug-resistant tuberculosis. Ther Drug Monit. 2010 Feb;32(1):97–101.
- Baietto L, D’Avolio A, Ariaudo A, et al. Development and validation of a new UPLC-PDA method to quantify linezolid in plasma and in dried plasma spots. J Chromatogr B Analyt Technol Biomed Life Sci. 2013 Oct 1;936:42–47.
- Vu DH, Koster RA, Bolhuis MS, et al. Simultaneous determination of rifampicin, clarithromycin and their metabolites in dried blood spots using LC-MS/MS. Talanta. 2014;121:9–17.
- Chahine EB, Karaoui LR, Mansour H. Bedaquiline: A novel diarylquinoline for multidrug-resistant tuberculosis. Ann Pharmacother. 2014 Jan;48(1):107–115.
- Parsons TL, Marzinke MA, Hoang T, et al. Quantification of rifapentine, a potent antituberculosis drug, from dried blood spot samples using liquid chromatographic-tandem mass spectrometric analysis. Antimicrob Agents Chemother. 2014 Nov;58(11):6747–6757.
- Lakshminarayana SB, Boshoff HIM, Cherian J, et al. Pharmacokinetics-pharmacodynamics analysis of bicyclic 4-nitroimidazole analogs in a murine model of tuberculosis. PLoS One. 2014 Aug 20;9(8):e105222.
- Diacon AH, Dawson R, Hanekom M, et al. Early bactericidal activity of delamanid (OPC-67683) in smear-positive pulmonary tuberculosis patients. Int J Tuberc Lung Dis. 2011 Jul;15(7):949–954.
- Alffenaar JC, Gumbo T, Aarnoutse RE. Acquired drug resistance: we can do more than we think! Clin Infect Dis. 2015 March 15;60(6):969–970.
- Cegielski JP, Dalton T, Yagui M, et al. Extensive drug resistance acquired during treatment of multidrug-resistant tuberculosis. Clin Infect Dis. 2014 Jul 23;59:1049–1063.
- Srivastava S, Pasipanodya JG, Meek C, et al. Multidrug-resistant tuberculosis not due to noncompliance but to between-patient pharmacokinetic variability. J Infect Dis. 2011 Dec 15;204(12):1951–1959.
- Van Deun A, Wright A, Zignol M, et al. Drug susceptibility testing proficiency in the network of supranational tuberculosis reference laboratories. Int J Tuberc Lung Dis. 2011 Jan;15(1):116–124.
- Boehme CC, Nabeta P, Hillemann D, et al. Rapid molecular detection of tuberculosis and rifampin resistance. N Engl J Med. 2010 Sep 9;363(11):1005–1015.
- Bottger EC. The ins and outs of mycobacterium tuberculosis drug susceptibility testing. Clin Microbiol Infect. 2011 Aug;17(8):1128–1134.
- Heysell SK, Moore JL, Peloquin CA, et al. Outcomes and use of therapeutic drug monitoring in multidrug-resistant tuberculosis patients treated in virginia, 2009–2014. Tuberc Respir Dis (Seoul). 2015 Apr;78(2):78–84.
- Migliori GB, Eker B, Richardson MD, et al. A retrospective TBNET assessment of linezolid safety, tolerability and efficacy in multidrug-resistant tuberculosis. Eur Respir J. 2009 Aug;34(2):387–393.
- Prasad R, Verma SK, Sahai S, et al. Efficacy and safety of kanamycin, ethionamide, PAS and cycloserine in multidrug-resistant pulmonary tuberculosis patients. Indian J Chest Dis Allied Sci. 2006 Jul-Sep;48(3):183–186.
- Van Tongeren L, Nolan S, Cook VJ, et al. Therapeutic drug monitoring in the treatment of tuberculosis: A retrospective analysis. Int J Tuberc Lung Dis. 2013 Feb;17(2):221–224.
- Prahl JB, Johansen IS, Cohen AS, et al. Clinical significance of 2 h plasma concentrations of first-line anti-tuberculosis drugs: A prospective observational study. J Antimicrob Chemother. 2014 Oct;69(10):2841–2847.
- Arbex MA, Varella Mde C, Siqueira HR, et al. Antituberculosis drugs: drug interactions, adverse effects, and use in special situations. part 2: second line drugs. J Bras Pneumol. 2010 Sep–Oct;36(5):641–656.
- Satyaraddi A, Velpandian T, Sharma SK, et al. Correlation of plasma anti-tuberculosis drug levels with subsequent development of hepatotoxicity. Int J Tuberc Lung Dis. 2014 Feb;18(2):188,95,i–iii.
- Holmes CX, Martin GE, Fetterhoff KI. The role of the cycloserine (seromycin) blood level in the treatment of pulmonary tuberculosis and the prevention and control of cycloserine (seromycin) toxicity. Dis Chest. 1959 Dec;36:591–593.
- Torun T, Gungor G, Ozmen I, et al. Side effects associated with the treatment of multidrug-resistant tuberculosis. Int J Tuberc Lung Dis. 2005 Dec;9(12):1373–1377.
- Hasenbosch RE, Alffenaar JW, Koopmans SA, et al. Ethambutol-induced optical neuropathy: risk of overdosing in obese subjects. Int J Tuberc Lung Dis. 2008 Aug;12(8):967–971.
- Koh WJ, Kang YR, Jeon K, et al. Daily 300 mg dose of linezolid for multidrug-resistant and extensively drug-resistant tuberculosis: updated analysis of 51 patients. J Antimicrob Chemother. 2012 Jun;67(6):1503–1507.
- De Lorenzo S, Alffenaar JW, Sotgiu G, et al. Efficacy and safety of meropenem-clavulanate added to linezolid-containing regimens in the treatment of MDR-/XDR-TB. Eur Respir J. 2013 Jun;41(6):1386–1392.
- Alffenaar JW, Van Altena R, Harmelink IM, et al. Comparison of the pharmacokinetics of two dosage regimens of linezolid in multidrug-resistant and extensively drug-resistant tuberculosis patients. Clin Pharmacokinet. 2010 Aug;49(8):559–565.
- Bolhuis MS, Tiberi S, Sotgiu G, et al. Linezolid tolerability in multidrug-resistant tuberculosis: A retrospective study. Eur Respir J. 2015 Oct;46(4):1205–1207.
- World Health Organization. Companion handbook to the WHO guidelines for the programmatic management of drug-resistant tuberculosis. Geneva: WHO, 2014. p. 39–60.
- Angeby K, Jureen P, Kahlmeter G, et al. Challenging a dogma: antimicrobial susceptibility testing breakpoints for mycobacterium tuberculosis. Bull World Health Organ. 2012 Sep 1;90(9):693–698.
- Angeby K, Giske CG, Jureen P, et al. Wild-type MIC distributions must be considered to set clinically meaningful susceptibility testing breakpoints for all bacterial pathogens, including mycobacterium tuberculosis. Antimicrob Agents Chemother. 2011 Sep;55(9):4492,3. author reply 4493.
- Katiyar SK, Bihari S, Prakash S, et al. A randomised controlled trial of high-dose isoniazid adjuvant therapy for multidrug-resistant tuberculosis. Int J Tuberc Lung Dis. 2008 Feb;12(2):139–145.
- Niehaus AJ, Mlisana K, Gandhi NR, et al. High prevalence of inhA promoter mutations among patients with drug-resistant tuberculosis in KwaZulu-natal, south africa. PLoS One. 2015 Sep 2;10(9):e0135003.
- Van Deun A, Barrera L, Bastian I, et al. Mycobacterium tuberculosis strains with highly discordant rifampin susceptibility test results. J Clin Microbiol. 2009 Nov;47(11):3501–3506.
- Aung KJ, Declercq E, Ali MA, et al. Extension of the intensive phase reduces relapse but not failure in a regimen with rifampicin throughout. Int J Tuberc Lung Dis. 2012 Apr;16(4):455–461.
- Boeree MJ, Diacon AH, Dawson R, et al. A step toward an optimized rifampin dose completed. Am J Respir Crit Care Med. 2015 Aug 15;192(4):525–526.
- Christianson S, Voth D, Wolfe J, et al. Re-evaluation of the critical concentration for ethambutol antimicrobial sensitivity testing on the MGIT 960. PLoS One. 2014 Sep 26;9(9):e108911.
- Den Hertog AL, Montero-Martin M, Saunders RL, et al. Cytokine kinetics in the first week of tuberculosis therapy as a tool to confirm a clinical diagnosis and guide therapy. PLoS One. 2015 Jun 26;10(6):e0129552.
- Tonby K, Ruhwald M, Kvale D, et al. IP-10 measured by dry plasma spots as biomarker for therapy responses in mycobacterium tuberculosis infection. Sci Rep. 2015 Mar 18;5:9223.
- Vu DH, Alffenaar JW, Edelbroek PM, et al. Dried blood spots: A new tool for tuberculosis treatment optimization. Curr Pharm Des. 2011;17(27):2931–2939.
- Hofman S, Bolhuis MS, Koster RA, et al. Role of therapeutic drug monitoring in pulmonary infections: use and potential for expanded use of dried blood spot samples. Bioanalysis. 2015;7(4):481–495.
- Pandya HC, Spooner N, Mulla H. Dried blood spots, pharmacokinetic studies and better medicines for children. Bioanalysis. 2011 Apr;3(7):779–786.
- Gumbo T, Dona CS, Meek C, et al. Pharmacokinetics-pharmacodynamics of pyrazinamide in a novel in vitro model of tuberculosis for sterilizing effect: A paradigm for faster assessment of new antituberculosis drugs. Antimicrob Agents Chemother. 2009 Aug;53(8):3197–3204.
- Hillemann D, Rusch-Gerdes S, Richter E. Evaluation of the GenoType MTBDRplus assay for rifampin and isoniazid susceptibility testing of mycobacterium tuberculosis strains and clinical specimens. J Clin Microbiol. 2007 Aug;45(8):2635–2640.
- Hillemann D, Rusch-Gerdes S, Richter E. Feasibility of the GenoType MTBDRsl assay for fluoroquinolone, amikacin-capreomycin, and ethambutol resistance testing of mycobacterium tuberculosis strains and clinical specimens. J Clin Microbiol. 2009 Jun;47(6):1767–1772.
- Rigouts L, Hoza AS, De Rijk P, et al. Evaluation of the genotype(R) MTBDRplus assay as a tool for drug resistance surveys. Int J Tuberc Lung Dis. 2011 Jul;15(7):959–965.
- Walker TM, Kohl TA, Omar SV, et al. Whole-genome sequencing for prediction of mycobacterium tuberculosis drug susceptibility and resistance: A retrospective cohort study. Lancet Infect Dis. 2015 Oct;15(10):1193–1202.
- Van Deun A, Aung KJ, Hossain A, et al. Disputed rpoB mutations can frequently cause important rifampicin resistance among new tuberculosis patients. Int J Tuberc Lung Dis. 2015 Feb;19(2):185–190.
- Simons SO, van der Laan T, De Zwaan R, et al. Molecular drug susceptibility testing in the netherlands: performance of the MTBDRplus and MTBDRsl assays. Int J Tuberc Lung Dis. 2015 Jul;19(7):828–833.
- Simons SO, van der Laan T, Mulder A, et al. Rapid diagnosis of pyrazinamide-resistant multidrug-resistant tuberculosis using a molecular-based diagnostic algorithm. Clin Microbiol Infect. 2014 Oct;20(10):1015–1020.
- Zhang S, Chen J, Shi W, et al. Mutations in panD encoding aspartate decarboxylase are associated with pyrazinamide resistance in mycobacterium tuberculosis. Emerg Microbes Infect. 2013 Jun;2(6):e34.
- ElMaraachli W, Slater M, Berrada ZL, et al. Predicting differential rifamycin resistance in clinical mycobacterium tuberculosis isolates by specific rpoB mutations. Int J Tuberc Lung Dis. 2015 Oct;19(10):1222–1226.
- Tagliani E, Cabibbe AM, Miotto P, et al. Diagnostic performance of the new version (v2.0) of GenoType MTBDRsl assay for detection of resistance to fluoroquinolones and second-line injectable drugs: A multicenter study. J Clin Microbiol. 2015 Sep;53(9):2961–2969.
- Brossier F, Veziris N, Aubry A, et al. Detection by GenoType MTBDRsl test of complex mechanisms of resistance to second-line drugs and ethambutol in multidrug-resistant mycobacterium tuberculosis complex isolates. J Clin Microbiol. 2010 May;48(5):1683–1689.
- Vadwai V, Ajbani K, Jose M, et al. Can inhA mutation predict ethionamide resistance? Int J Tuberc Lung Dis. 2013 Jan;17(1):129–130.
- Takiff HE, Feo O. Clinical value of whole-genome sequencing of mycobacterium tuberculosis. Lancet Infect Dis. 2015 Sep;15(9):1077–1090.
- Keller PM, Homke R, Ritter C, et al. Determination of MIC distribution and epidemiological cutoff values for bedaquiline and delamanid in mycobacterium tuberculosis using the MGIT 960 system equipped with TB eXiST. Antimicrob Agents Chemother. 2015 Jul;59(7):4352–4355.
- Torrea G, Coeck N, Desmaretz C, et al. Bedaquiline susceptibility testing of mycobacterium tuberculosis in an automated liquid culture system. J Antimicrob Chemother. 2015 Aug;70(8):2300–2305.
- Miotto P, Bigoni S, Migliori GB, et al. Early tuberculosis treatment monitoring by xpert(R) MTB/RIF. Eur Respir J. 2012 May;39(5):1269–1271.
- Honeyborne I, McHugh TD, Phillips PP, et al. Molecular bacterial load assay, a culture-free biomarker for rapid and accurate quantification of sputum mycobacterium tuberculosis bacillary load during treatment. J Clin Microbiol. 2011 Nov;49(11):3905–3911.
- Datta S, Sherman JM, Bravard MA, et al. Clinical evaluation of tuberculosis viability microscopy for assessing treatment response. Clin Infect Dis. 2015 Apr 15;60(8):1186–1195.
- Kayigire XA, Friedrich SO, van der Merwe L, et al. Simultaneous staining of sputum smears for acid-fast and lipid-containing myobacterium tuberculosis can enhance the clinical evaluation of antituberculosis treatments. Tuberculosis (Edinb). 2015 Aug 13;95:770–779.
- Campbell PJ, Morlock GP, Sikes RD, et al. Molecular detection of mutations associated with first- and second-line drug resistance compared with conventional drug susceptibility testing of mycobacterium tuberculosis. Antimicrob Agents Chemother. 2011 May;55(5):2032–2041.
- Den Hertog AL, Mayboroda OA, Klatser PR, et al. Simple rapid near-patient diagnostics for tuberculosis remain elusive–is a “treat-to-test” strategy more realistic? PLoS Pathog. 2011 Nov;7(11):e1002207.
- Gardiner JL, Karp CL. Transformative tools for tackling tuberculosis. J Exp Med. 2015 Oct 19;212(11):1759–1769.
- Den Hertog AL, De Vos AF, Klatser PR, et al. Early specific host response associated with starting effective tuberculosis treatment in an infection controlled placebo controlled mouse study. PLoS One. 2013;8(2):e57997.
- Cliff JM, Kaufmann SH, McShane H, et al. The human immune response to tuberculosis and its treatment: A view from the blood. Immunol Rev. 2015 Mar;264(1):88–102.
- Djoba Siawaya JF, Beyers N, Van Helden P, et al. Differential cytokine secretion and early treatment response in patients with pulmonary tuberculosis. Clin Exp Immunol. 2009 Apr;156(1):69–77.
- Pai M, Denkinger CM, Kik SV, et al. Gamma interferon release assays for detection of mycobacterium tuberculosis infection. Clin Microbiol Rev. 2014 Jan;27(1):3–20.
- De Steenwinkel JE, De Knegt GJ, Ten Kate MT, et al. Dynamics of interferon-gamma release assay and cytokine profiles in blood and respiratory tract specimens from mice with tuberculosis and the effect of therapy. Eur J Clin Microbiol Infect Dis. 2012 Jun;31(6):1195–1201.
- Riou C, Perez Peixoto B, Roberts L, et al. Effect of standard tuberculosis treatment on plasma cytokine levels in patients with active pulmonary tuberculosis. PLoS One. 2012;7(5):e36886.
- Ruhwald M, Bodmer T, Maier C, et al. Evaluating the potential of IP-10 and MCP-2 as biomarkers for the diagnosis of tuberculosis. Eur Respir J. 2008 Dec;32(6):1607–1615.
- Hong JY, Lee HJ, Kim SY, et al. Efficacy of IP-10 as a biomarker for monitoring tuberculosis treatment. J Infect. 2014 Mar;68(3):252–258.
- Azzurri A, Sow OY, Amedei A, et al. IFN-gamma-inducible protein 10 and pentraxin 3 plasma levels are tools for monitoring inflammation and disease activity in mycobacterium tuberculosis infection. Microbes Infect. 2005 Jan;7(1):1–8.
- Dheda K, Davids V, Lenders L, et al. Clinical utility of a commercial LAM-ELISA assay for TB diagnosis in HIV-infected patients using urine and sputum samples. PLoS One. 2010 Mar 24;5(3):e9848.
- Pan SJ, Tapley A, Adamson J, et al. Biomarkers for tuberculosis based on secreted, species-specific, bacterial small molecules. J Infect Dis. 2015 Dec 1;212(11):1827–1834.
- Corstjens PL, Tjon Kon Fat EM, De Dood CJ, et al. Multi-center evaluation of a user-friendly lateral flow assay to determine IP-10 and CCL4 levels in blood of TB and non-TB cases in africa. Clin Biochem. 2016 Jan;49(1):22–31.
- Zhu Y, Jia H, Chen J, et al. Decreased osteopontin expression as a reliable prognostic indicator of improvement in pulmonary tuberculosis: impact of the level of interferon-x03B3;-inducible protein 10. Cell Physiol Biochem. 2015;37(5):1983–1996.
- Vu DH, Bolhuis MS, Koster RA, et al. Dried blood spot analysis for therapeutic drug monitoring of linezolid in patients with multidrug-resistant tuberculosis. Antimicrob Agents Chemother. 2012 Nov;56(11):5758–5763.
- Veringa A, Sturkenboom MGG, Dekkers BGJ, et al. LC-MS/MS for therapeutic drug monitoring of anti-infective drugs. TrAC Trends Anal Chem. 2016. doi:10.1016/j.trac.2015.11.026.
- Han M, Jun SH, Lee JH, et al. Method for simultaneous analysis of nine second-line anti-tuberculosis drugs using UPLC-MS/MS. J Antimicrob Chemother. 2013 Sep;68(9):2066–2073.
- Ghimire S, Bolhuis MS, Sturkenboom MGG, et al. Incorporating therapeutic drug monitoring in WHO’s hierarchy of tuberculosis diagnostics! Eur Respir J. 2016;47(6).