Abstract
Fractal characteristics of chromatin, revealed by light or electron microscopy, have been reported during the last 20 years. Fractal features can easily be estimated in digitalized microscopic images and are helpful for diagnosis and prognosis of neoplasias. During carcinogenesis and tumor progression, an increase of the fractal dimension (FD) of stained nuclei has been shown in intraepithelial lesions of the uterine cervix and the anus, oral squamous cell carcinomas or adenocarcinomas of the pancreas. Furthermore, an increased FD of chromatin is an unfavorable prognostic factor in squamous cell carcinomas of the oral cavity and the larynx, melanomas and multiple myelomas. High goodness-of-fit of the regression line of the FD is a favorable prognostic factor in acute leukemias and multiple myelomas. The nucleus has fractal and power-law organization in several different levels, which might in part be interrelated. Some possible relations between modifications of the chromatin organization during carcinogenesis and tumor progression and an increase of the FD of stained chromatin are suggested. Furthermore, increased complexity of the chromatin structure, loss of heterochromatin and a less-perfect self-organization of the nucleus in aggressive neoplasias are discussed.
Fractality: a general concept in biology & medicine
The fractal concept, which was introduced by Mandelbrot Citation[1], provides a general theoretical framework for the description of many objects or processes and is nowadays applied to every kind of science. From a mathematical point of view there are different definitions of dimension. In the Euclidian geometry, objects are homogeneous and uniform. The Euclidian dimension is now calculated after scaling down. Let us now have a look at a surface measured in square decimeters. After scaling down by a factor of 10, that is, now measuring in centimeters, 100 (102) squared centimeters will fit in the original squared decimeter. So, the Euclidean dimension is now given by the exponent 2. In the same way, after scaling down a cube (originally measured in cubic decimeters) into cubic centimeters, the Euclidean dimension of the original cube will be 3 Citation[2].
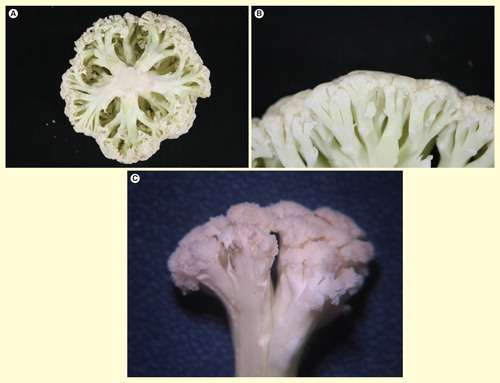
The topolocal dimension is based on the connectedness among points in a set. It is the dimension of the object required to separate any part of the original set from the rest, plus one. According to this definition, a line has a topological dimension of one, a plane of two and a solid of three. In contrast to the ideal forms of Euclidean geometry, many natural objects are highly irregular with dimensions in between the integer values Citation[2]. In order to define fractal dimension (FD), we compare the topological dimension with the object´s space filling properties, which can be quantified by the so-called Hausdorff–Besicovitch dimension. A fractal is a set for which the Hausdorff–Besicovitch dimension strictly exceeds its topological dimension Citation[2,3]. The fractal dimension (FD) of a binarized, that is, black-white image, for instance a line in 2D, is a non-integer number between 1 and 2. An intensively folded and wrinkled line would fill the 2D plane more than a smoother curve and therefore has a higher FD. Regarding a ‘rough’ landscape-like surface, this dimension varies between 2 and 3 and expresses the amount of filling the 3D cube. shows an example of a cauliflower plant. Its curved surface reveals myriads of infoldings. In other words, the cauliflower surface is ‘leaking’ into the third Euclidean dimension Citation[2], that is, approximating a 3D object and corresponding to a non-integer FD. Fractals are self-similar structures, that is, they reveal a characteristic pattern that can be repeatedly observed at any magnification, or, in other words, comprise nested copies of the whole object Citation[2]. In order to estimate the FD, we can measure a feature, for example, the perimeter of an object, at a certain scale. Then we repeat this measurement at different scales and create a so-called log-log diagram. In our example, we are plotting on the x-axis the logarithmic values of the scaling unit and on the y-axis the logarithmic values of the perimeter. When the regression curve of these observed data points builds a line, we can say that the perimeter of this object has fractal characteristics. The relation between x and y obeys a non-linear power-law: y = a × xk. The FD is derived from the slope of the regression line in the log-log-plot. Therefore, there is no especially defined scale for the measurement of a fractal. In other words, fractals are scale-independent. In a strict sense, this is only true for mathematical objects which are self-similar over an unlimited range of scales. In nature, however, biological objects or processes are self-similar only within a fractal domain which is defined by an upper and a lower limit (also called the scaling window), in which fractality can be observed Citation[4,5]. Fractality, that is, the whole set of fractal features, is a characteristic of a certain measurement variable. Any object or process can, obviously, be described by many variables and each of them may, or not, reveal fractal characteristics. Therefore, an object or process can simultaneously show fractality in completely different aspects of its description. In computer simulations, fractals can be constructed in a rather simple way by iteration of an initial motif Citation[6,7]. In nature, however, irregular shapes are not as perfectly built as by simple iterative computer programs, since the self-similar or hierarchical structures are influenced by random effects, that is, the structure of smaller parts is only similar, but not identical to the structure of the whole. A cauliflower plant is an example for natural fractal growth Citation[8] with a rather simple, iterative branching pattern, but at a closer look, it is not exactly regular (). Castro et al. explained the cauliflower growth as the result of an interplay between different factors: an interaction among the branches sustaining the external surface with competitive growth among different plant features, non-conservation of mass, intrinsic biologic fluctuations and an extra stabilizing component Citation[7]. Furthermore, they showed that the surfaces of actual cauliflower plants and combustion fronts obey the same scaling laws, and that a rather simple equation is able to capture the non-trivial dynamics of cauliflower-type growth in general. The fractal concept has improved our understanding of many physiological phenomena, for instance, metabolic rate, intracellular bio-energetic dynamics, drug clearance, population genetics, tissue organization and tumor growth. Fractality describes very well the complexity of macroscopic and microscopic anatomic structures and reveals the design principles of organisms Citation[2–67].
Figure 1. A cauliflower plant as an example for a naturally occurring fractal structure. A self-similar pattern across different magnification scales (A–C) is visible in the ramification pattern as well as in the surface structure. When trying to measure the surface, we will recognize an astonishing phenomenon: with increasing zoom factor (A–C), we will detect more and more structural details and surface infoldings, which will result in an increase of the surface.
From the standpoint of evolution, fractal structures have advantages. In nature, biological fractal structures are generated by the repetition of the same morphogenetic mechanism many times, for example, branching. Thus, fractal algorithms based on a set of similar scale-invariant modules are a parsimonious way of morphogenesis, because they need only relatively small genetic programs Citation[51–63].
Fractal branching permits the construction of complex connections with short distances for transport. In membranes, fractal foldings multiply the surface area without the necessity to increase the volume. The fractal construction principle enables the morphogenesis of complex structures which are more stable than those generated by classical scaling, being more error tolerant. In any physiological system, power-law organization, that is, linearity in a log-log diagram, is the basis for rapid adaptations of the organism after challenges from the environment. Some authors try to relate structure and function more closely. According to Isaeva, the fractal structure of neurons appears to correlate with chaotic processes in the nervous system Citation[51,63].
Bizzarri et al. postulated that the morphologic characterization of a cell population by fractal analysis could provide independent data for the description of the dynamics of the underlying system and help to characterize its behavior by a phase-space diagram Citation[56].
Self-organization is a fundamental feature of living organisms, at all hierarchical levels Citation[18]. Self-organization and fractality are intimately related. Molski and Konarski postulated that the fractal structure of the space in any biological system could characterize self-organization Citation[14]. Kurakin Citation[16] proposed the universal ‘self-organizing fractal theory’ which is based on the concept of the scale-invariance of self-organizational dynamics of energy or matter at all levels of organizational hierarchy, such as elementary particles, cells, organisms or the universe as a whole. This hypothetical concept postulates living matter as an organizational state or phase of non-living matter created by evolution and self-organization of the latter.
Fractality in the cell nucleus
Since the fractal concept is ubiquitous in life sciences, we expect it also to be present as a construction and organization principle in the cell nucleus in different levels of organization. As early as in 1989, Takahashi suggested a fractal model of chromosomes and chromosomal DNA replication Citation[65]. This author described the FD as a method to measure chromatin condensation and prophesized, that ‘a fractal theory of chromatin structure will find an application in the morphological study of malignant cell nucleus’. Matioli, based on observations of hemopoietic stem cells, identified several parameters, including FDs and oscillatory behavior in a multi-stable landscape, that scale down to subcellular structures such as chromatids, chromatin entanglements and DNA segmental motions Citation[68].
A recent study on the effects of colcemid on chromosome condensation showed that the dynamic of this process was deterministically chaotic with a long-term correlation and scaling exponents 0.5 < α < 1.0, thus underlining the non-linear properties of human chromatin Citation[69].
Chromatin forms two large nuclear compartments: i) heterochromatin that is dense, with repressed transcription activity, which forms mainly clusters around the nuclear periphery or nucleolus, the so-called ‘peripheral heterochromatic compartment’ and ii) the loosely packed, active euchromatin, which fills most of the internal nucleoplasm Citation[70]. Spinelli Citation[71] determined the FDs of heterochromatic sequences and suggested the hypothesis of heterochromatin as a self-organizing system at the edge of cellular and environmental chaos. On the molecular level, scale-independent self-similarity in DNA and RNA sequences has been reported Citation[72–74]. GA-sequences, which are composed of hundreds of thousands of segments of DNA containing only guanine and adenine, have been described as a class of fractal genomic sequences, scattered densely throughout the chromosomes. They can be detected in a large number of genomes from different species and are considered to be useful universal natural markers of the non-coding regions of genomes Citation[75]. Repetitive DNA sequences derived from transposable elements are co-clustering with other classes of repeat elements, genes or other components of the genome, and in that way, not randomly distributed. Sellis et al. reported power-law-like size distributions in the spatial arrangement of Alu and LINE1 elements in the human genome, with a very large scaling window Citation[76]. Besides that, a power-law-like pattern of the distribution of protein-coding segments has been described for several organisms Citation[77].
Small angle neutron scattering on isolated chicken erythrocyte nuclei revealed DNA power-law relations between the scattering intensity and the scattering vector, thus indicating a fractal organization with a dimension of 2.4 between 15 and 400 nm and 2.9 for larger length scales. In the same experiments, nuclear protein organization also revealed fractal features with a dimension of about 2.5 over the full-length spectrum. Neutron scattering has the advantage to demonstrate the fractal organization of chromatin over a broad spatial range, between 15 nm and 10 μm Citation[78–80]. The motion of nuclear proteins in the inter-chromatin space is hindered by chromatin fibers. Therefore, indirect information on nuclear structures may be obtained from nuclear rheology. Bancaud et al. studied in living mouse cell nuclei the diffusion of tracers Citation[80]. Complex behaviors equivalent to anomalous diffusion or multiple-component diffusion were observed at smaller length scales of about 100–200 nm. It was demonstrated that the dynamics of soluble nuclear proteins was independent of their size. Quantitative modeling of interaction kinetics favored a fractal model of chromatin organization with a distinct fractal architecture of nucleoplasmic euchromatin (FD: 2.6) and heterochromatin (FD: 2.2) in the 2- to 100-nm scaling window. Thus, euchromatin with a higher FD is characterized by a rougher, highly branched and more space-filling surface, and heterochromatin, by a smoother surface with a smaller surface area Citation[80,81]. But it is important to emphasize that these FDs are only valid for a scaling window smaller than 100 nm.
These findings were corroborated by experiments with another technique. A new sequencing technology, the so-called Hi-C technique Citation[82] cross-links spatially adjacent chromatin segments. After DNA shattering, loose ends of the cross-linked DNA fragments are joined, thus creating hybrid fragments which contain DNA from spatially near, but genomically distinct locations. Sequencing of these hybrid fragments allows a precise and unbiased genome-wide mapping of long-range chromatin interactions. With this technique, DNA across the entire genome of K562 and GM06990 cells was analyzed Citation[82]. The intra- and inter-chromosomal interaction pattern gave strong evidence for a spatial segregation in two genome-wide compartments, equivalent to an organization of chromosomes in ‘open’ euchromatin, less compact and enriched in active genes, and ‘closed’ heterochromatin, more compact and nearly without transcriptional activity. The intra-chromosomal contact probabilities followed a power-law scaling in a spatial range between 500 nm and 2 μm. These data gave rise to a new theory of the DNA organization: the fractal globule, that is, a crumpled, knot-free polymer conformation of about 1 μm in diameter with a FD of nearly 3, which enables maximally dense packing, but maintains the ability to easily fold and unfold any genomic locus. Recent experimental studies report comparable findings in mouse nuclei Citation[83].
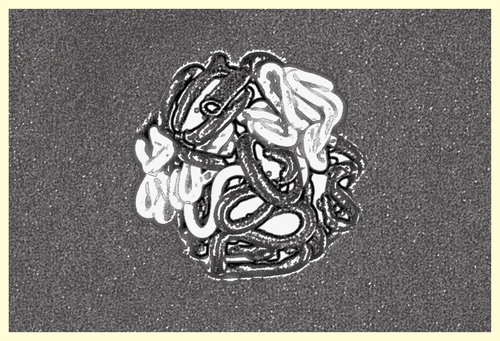
This model derived from experimental observations had been theoretically predicted two decades ago and, at that time, been named ‘crumpled globule model’ Citation[84–86] () DNA can be considered a polymer configuration. Repeated folding of polymers (crumpling) turns them into condensed fractal structures without self-crossings or entanglements. This configuration has the advantage of rapid and easy unraveling when this should be necessary. Yet, it must be stated that some authors Citation[80] consider the crumpled globule to be a transient arrangement and that it could ultimately collapse into an equilibrium globule which would be the stable configuration in a poor solvent.
According to Hübner et al., chromosomes are organized in chromosome territories, which comprised fractal globules Citation[87]. Fractal globules coming from adjacent chromosomes form an interdigitated surface. Chromatin fibers can interact within a fractal globule, more frequently between fractal globules of the same chromosome territory or, very rarely, between adjacent chromosome territories.
Bancaud et al. summarizing different models of chromatin configuration support the concept of a fractal architecture of the nuclear DNA mass distribution at length scales larger than 300 nm, but emphasize the absence of a consensus about the nature of the underlying DNA structure at smaller scales Citation[80].
Other authors, however, claim to have found inconsistencies of the fractal globule model Citation[88,89]. Dekker et al. draw attention to the fact that although in the original model the fractal globule is formed during condensation, there is evidence for the emergence of a similar chromatin organization during decondensation from mitotic chromosomes. Furthermore, it is believed that the fractal globule could also be the result of an equilibrium state of a polymer ring in a melt of rings with stable chromatin loops Citation[90].
Figure 2. Schematic representation of the fractal globule model after crumpled folding. Open (transcriptionally active) chromatin drawn in white and closed (silent) chromatin in black symbolizing darker heterochromatin and lighter euchromatin in stained nuclei.
de Wit and de Laat Citation[91] try to explain nuclear organization with a hybrid of a microenvironment and a network model.
A more generalized concept, the ‘strings and binders switch model’, recently introduced by Barbieri et al. seems to overcome many contradictions Citation[92]. This concept integrates the scaling properties of chromatin folding, the fractal features of chromatin and the processes of domain formation and looping out. It also includes the fractal–globule model, but only as one possible transient conformation. Cavalli and Mistelli postulated an extensive self-enforcing feedback between genome activity and spatial organization, and suggest a self-organizing and self-perpetuating system of the nucleus Citation[93].
We would like to emphasize here that fractal features of the chromatin organization are present in different neoplasias, irrespective of their origin and type. This was shown in a study on a data set comprising more than 3000 cancer specimens from 26 histological types Citation[94] that the 3D chromatin organization and spatial co-localization influence the distribution of somatic copy-number alterations (SNCAs) in cancer. Interestingly, there was a power-law relation between the distance between SNCA ends and their mean number, both for amplifications and deletions. Regions enriched for 3D interactions appeared to experience frequent SCNAs. In the best-fitting model, the 3D chromatin configuration explained a factor of about 100 in relative frequencies of SCNAs, whereas purifying selection contributed only by an additional factor of about 3 for long SCNAs. Finally, the authors compared different models of chromatin organization and found that the fractal globule concept was the best model to explain their results. Thus, this study shows that the fractal globule model is valid to describe the nuclear chromatin organization in various tumors and that the fractal configuration is also important for the formation and localization of chromosomal alterations.
In the former paragraphs, we demonstrated the global fractal organization of the nucleus where these features can be found in different elements and construction levels (e.g., DNA, chromatin, the nucleoplasm or the whole nucleus) with varying scaling windows.
An intriguing question is now, whether these organization levels are all completely independent or whether, for instance, a power-law organization on a lower level (e.g., 1D DNA sequences) could provoke the emergence of fractal features on a higher level (e.g., the 3D nuclear configuration). According to Albrecht-Buehler, a conceivable linkage between the fractal DNA packing and the GA-fractal sequences has not been established yet Citation[75]. When, however, considering the ubiquitous principle of parsimony in nature, it would be difficult to imagine that the different forms of fractal organization in various levels in the nucleus would all be completely unrelated. Several authors postulated an interplay of fractal characteristics between different levels in the nucleus. Li speculated that the fractal chromatin structure might have a causal relationship with the fractal statistics of the fluctuating proportion of guanine (G) or cytosine (C) nucleotide bases in the human genome Citation[95]. Tang suggested that repeats may coordinate the higher-order structure of chromatin, since disparate repeats of the same family often cluster in the 3D space of the nucleus, by means of ‘repeat pair’ interactions Citation[96].
Klimopoulos et al. investigated the large-scale features of the spatial arrangement of transposable elements and observed power-law-like size distributions of inter-repeat distances extending up to several orders of magnitude Citation[97]. The authors postulated that power-law distributions of transposable elements might contribute to the ‘fractal globule’ genome structure through recombinational DNA-DNA ‘kissing interactions’. Applying photo-activated light microscopy, Récamier et al. analyzed recently the 3D distribution of the histone protein H2B at nanometric resolution. The distribution of distances of the resulting point pattern was following a power-law. The authors concluded that their findings linked linear genomic distances to 3D distances and could add a higher complexity level to chromatin organization with a ‘stronger than anticipated relation’ Citation[201].
Arneodo et al. pointed out the need of a multi-scale approach for improving our understanding of chromatin physiology integrating different levels of chromatin organization. Citation[98] They emphasized that all these levels are consistently functionally coupled and cannot be investigated separately and claimed to have demonstrated that the lowest levels condition the organization at larger scales and vice versa.
Singh Sandhu et al. described a general theoretical framework of the chromatin and genome organization Citation[99]. They suggested a fractal hierarchy of chromatin organization starting from gene loops at a basic level, to distant enhancer–promoter interactions at a middle level, and finally, a long-range cis- and trans-enhancer–promoter and promoter–promoter interactions at a higher level. Their concept comprises the progressive transformation of 1D genomic information to 2D interaction networks and, finally, to the 3D chromatin fractal globule architecture, based on a crude 3D space-filled model of the genome obtained by reverse engineering from RNAPII-mediated chromatin interaction data. Thus we can see, that different research groups try to establish causal links between the fractal organization at different levels, although many of these above-mentioned concepts are still hypothetical and need further experimental corroboration.
Fractality in microscopic images of chromatin
In this chapter, we will discuss the fractal characteristics of stained histologic sections or stained cytologic smears. The resulting images are representations (sections or projections) of the 3D dye binding to the chromatin structure of fixed nuclei. Basically, two distinct chromatin conformations can be distinguished by light microscopy: euchromatin, which is uncondensed and heterochromatin, which is darker and considered to be transcriptionally less active.
Classical morphologists have demonstrated an indirect evidence for the fractal organization of chromatin for more than two decades Citation[100–139] using conventional light microscopy, confocal microscopy or electron microscopic analysis.
In some investigations, the fractal characteristics of the nuclear membrane outline and the nuclear membrane-bound heterochromatin were analyzed Citation[119,120]. In this case, the gray value images were binarized above or below a certain threshold value, thus creating FDs between 1 and 2. The most common technique for fractal analysis is box counting. Grids of different box sizes are layered on a binarized image. The number of boxes containing the regions of interest are counted for each grid and then a log-log plot is created with x = log (number of boxes per length of the grid) and y = log (number of boxes containing a part of the structure of interest). The slope of the linear regression curve is equivalent to the FD.
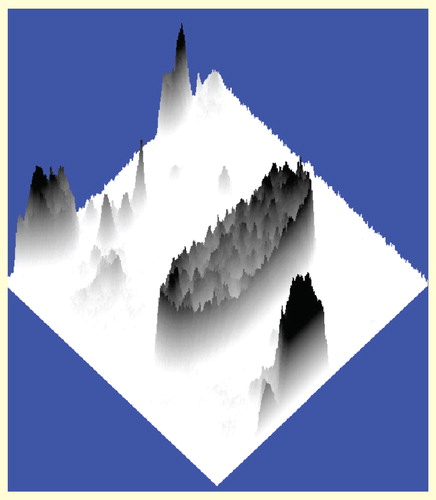
The choice of the gray-level cut-off point for thresholding may strongly influence the results, however Citation[140]. Thresholding reduces the information content of, for instance, 256 gray values (8 bits/pixel) to a binarized ‘black and white’ image (1 bit/pixel). In order to use all information provided by the gray values, the fractal measurement should be based on pseudo-3D images Citation[103,106,107,110–113,122–129,131–134,134–138]. In these images, the gray values of the nuclear chromatin create a pseudo-3D representation (also called 2½ D image) in form of ‘rough’ landscape-like surfaces. Here, the x and y coordinates are equivalent to the position of the pixel and the z coordinate represents its gray level (). The FD can now be calculated by the box-counting method or other algorithms extended to three dimensions. Since the three coordinates do not share the same unit, we do not use the term ‘self-similarity’ for the rough surface, but rather the term ‘self-affinity’ and characterize them by a FD. It has been shown that there is a high correlation between the FD of these surfaces and the human visual perception of roughness and irregularity Citation[141]. Thus, the FD is an ideal measurement variable for quantitation of chromatin irregularity.
In a further step, the squared value of the Pearson correlation coefficient (R) between the real and the estimated y values on the regression line is calculated. The R2 value characterizes the goodness-of-fit of the regression line and is therefore an estimate of the ‘quality of the fractal’. An ideal fractal has a R2 = 1.0. Real fractals show R2 values below 1.0.
Figure 3. Microscopic image of a H&E-stained cytologic preparation with (segmented) nuclei of a 60 days old Wistar rat.
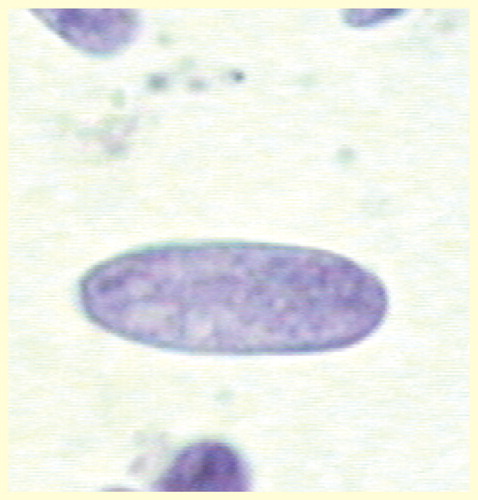
Figure 4. Pseudo-3D representation of . In this image, the inverse gray level (256 gray values) of each pixel represents the height on the z-axis. In that way, white pixels correspond to the bottom and black pixels to maximum height.
Fractal changes of chromatin during normal development
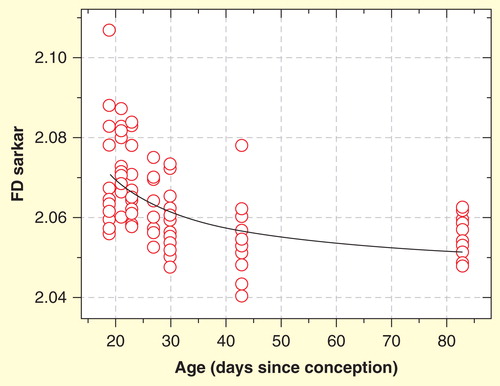
In an experimental study, the nuclear texture of cytologic preparations of hematoxylin eosin (H&E)-stained cardiomyocyte nuclei of normal and healthy Wistar rats with ages between 19 and 83 days after conception were compared. Following normal development of the rat heart, the FD of nuclear chromatin of cardiomyocytes diminished significantly (r = -0.603; p = 0.001; Spearman rank order correlation) with increasing age () Citation[133]. In a similar way, the FD of nuclear chromatin in kidney macula densa cells declined during postnatal development of male Swiss albino mice Citation[134].
Alterations of the nuclear architecture during physiologic development and growth may reflect epigenomic changes and a topological redistribution. The arrangement of chromosome territories and peri-centromeric heterochromatin is changing during differentiation, thus creating distinct cell type-specific distribution patterns Citation[142].
Figure 5. Decreasing fractal dimension of the cardiomyocyte chromatin with increasing age of normal rats in H&E-stained cytologic preparations. X-axis shows age in days after conception.
Fractal changes of chromatin in neoplasias, during carcinogenesis & tumor progression
In a pilot study, Stefan et al. demonstrated in binarized chromatin images of H&E-stained cytologic smears a higher FD for dog lymphoma nuclei (range 1.588–1.617) than for normal lymphoblasts (range 1.503–1.536 Citation[143]), but since these results are based on very few cases, these data should be interpreted with caution. A similar pilot study was done on human lymphomas by Mashiah et al. using binarized cytological images Citation[109]. Normal lymph node cells had an average FD of 1.168 and reactive lymph nodes of 1.2038. The average FDs in chronic lymphocytic leukemia, follicular lymphoma and diffuse large B-cell lymphoma nuclei were 1.218, 1.224 and 1.299, respectively. Differences between the FDs of all groups were significant. The authors interpreted these data as a relation between the FD and the aggressiveness of the lymphoma, or, in other words, the more aggressive the lymphoma subtype, the higher the FD.
In two studies, the FD was measured according to the ‘Minkowski sausage method’ in pseudo-3D representations of routinely May-Grünwald-Giemsa-stained cytologic smears. The reported mean values were for acute precursor B lymphoblastic leukemia blasts 2.265 (range 2.238–2.285) Citation[131], and for myeloma cells 2.113 (range 2.071–2.278) Citation[124].
Nielsen et al. studied digitalized transmission electron micrographs (TEM) of mouse liver cell nuclei and compared normal liver, hyperplastic nodules and hepatocellular carcinomas Citation[138]. A combination of several single fractal features derived from a polygonization-based method applied on the periphery of the cell nuclei discriminated samples from the hyperplastic nodules and hepatocellular carcinomas from normal ones.
Sedivy et al. analyzed digitalized images of H&E-stained paraffin sections of biopsies from the uterine cervix Citation[126]. After automatic thresholding, binary nuclear images (showing the outlines of darker H&E-stained chromatin regions) were analyzed by box-counting. The FD increased significantly from normal epithelial cells (FD: 1.02) to CIN1 (FD: 1.32) and CIN2 (FD: 1.37) and was highest in CIN3 cells (FD: 1.40). In a similar study on cervical lesions, Dey et al. measured the FDs on cytological smears with similar techniques and came to a comparable result: the mean FD of the normal nucleus was 1.2425, in low-grade lesions (LSIL) 1.3504 and in high-grade cases (HSIL) 1.4379 (p < 0.0001) Citation[127]. In an additional investigation, CIN lesions were studied with a different analysis technique Citation[128]. In Papanicolaou-stained cytological preparations of cervical lesions, the FD of the pseudo 3D gray images of the nuclear chromatin was calculated. The results, however, were very similar. The mean FD rose from 2.4225 in normal cases, to 2.5159 in LSIL cases and was 2.5905 in HSIL lesions.
In Feulgen-stained paraffin-sections of oral squamous cell carcinomas, the nuclear FD was determined after binarization Citation[108]. Nuclei of carcinomas presented higher mean fractal values (mean FD: 1.315) than nuclei of normal mucosa (mean FD: 1.28). Well-differentiated neoplasms had lower FD values (mean FD: 1.29) than poorly differentiated ones (mean FD: 1.335). Generally, in the control group and stage I neoplasms the FD values were low, whereas in stage II–IV tumors they were high. Delides et al. determined the mean FD of H&E-stained chromatin in binarized histologic images of squamous cell carcinomas of the larynx as FD: 1.68 (range 1.60–1.77) Citation[104].
In H&E-stained histologic sections of malignant melanomas, the chromatin FD, measured in pseudo-3D representations, ranged between 2.01 and 2.082 with a median value of 2.06 and was significantly correlated with tumor thickness (r = 0.482) and the mitotic rate (r = 0.342) Citation[113].
Vasilescu et al. studied biopsy samples from pancreatic adenocarcinomas and compared the FDs of chromatin in H&E-stained histologic sections of paraffin-embedded material between patients with resectable and non-resectable cases Citation[130]. The FD, measured after binarization of the gray value images, was significantly higher in the non-resectable carcinomas (FD: 1.78) than in the resectable ones (FD: 1.45).
Ahammer et al. compared the FD of the pseudo-3D gray images of histologic sections in cases of anal intraepithelial neoplasia (AIN) Citation[129]. Although their images comprised besides the nuclear chromatin structures also cytoplasmic features, their results are interesting and comparable with the aforementioned studies based only on nuclear chromatin. They found for AIN1 a mean FD of 2.19, for AIN2 a mean of 2.28 and for AIN3 a mean FD of 2.39. The results were statistically significant between the groups. In other words, in intraepithelial anal lesions, the actual value of the FD increases with the grade of dysplasia.
In an interesting study on Feulgen-stained histologically non-malignant-appearing diploid nuclei from prostatic lesions, it was possible to differentiate cases with benign hyperplasia from cases with adjacent adenocarcinoma by a discrimination analysis based on chromatin texture. Among different texture parameters, comprising gray-level co-occurrence parameters and others, fractal features were of high discriminative power. The discriminator was composed of only three components, two of them fractal-derived variables: the mean FD and the standard deviation of the fractal area Citation[115]. In other words, fractal-derived variables characterize very well the discrete chromatin changes, which are invisible to the human eye, in non-malignant epithelial cells in the vicinity of prostate carcinomas. In summary, the FD of stained nuclear chromatin tends to increase during the evolution of intraepithelial clones to the invasive carcinoma and during the progression to higher tumor stages ()
Table 1. Fractal changes of chromatin during carcinogenesis and tumor progression .
Fractal features of chromatin as prognostic factors in malignant neoplasias
In histological slides, meningiomas with a higher FD of the nuclear border tended to recur faster Citation[136], but this feature was no longer an independent prognostic factor in a multivariate analysis.
The question is now, whether at a certain defined stage of the tumor evolution, chromatin characteristics could predict the tumor behavior in future, that is, separate the potentially aggressive, early metastasizing neoplasias from those with a slow tumor growth and absence of metastatization. In other words, the question is whether the FD of nuclear chromatin could be a prognostic factor.
In an investigation on the FD of nuclei in Feulgen-stained paraffin-sections of oral squamous cell carcinomas, patients with lower FDs had statistically significant higher survival rates. The FD of chromatin was found to be an independent for survival in those patients Citation[108]. In a similar study, Delides et al. analyzed squamous cell carcinomas in laryngectomy specimens Citation[104]. Fractal analysis of nuclear chromatin was performed after binarization of the gray value images by the box-counting method. Again, patients with lower FDs had statistically significant higher survival rates. In histological sections of primary superficial spreading cutaneous melanomas stained with H&E, the FD of the pseudo-3D nuclear images was a significant independent risk factor for overall survival in a multivariate Cox regression together with the Clark level. Patients with a higher FD had a worse prognosis Citation[113].
But not only in solid tumors, also in hematologic neoplasias, fractal characteristics showed to be important prognostic factors. In a preliminary study on 19 patients, Mashiah et al. suggested some relation between the FD of binarized routinely stained leukemic blasts and the clinical response of the patients Citation[109]. But since these authors did not add an adequate statistical analysis, there results regarding survival should be interpreted with caution.
In the investigation of Adam et al. on routinely May-Grünwald-Giemsa-stained bone marrow smears of patients with acute precursor B-cell leukemia, the chromatin FD was of no prognostic relevance, but patients with higher R2 values showed a prolonged survival Citation[131]. Goodness-of-fit (R2) still remained as an independent prognostic factor for overall survival in the final multivariate Cox-regression, together with the peripheral blood cell count and mean fluorescence intensity of CD45 in flow cytometry ().
A recent study using the same methodology in patients with acute myeloid leukemia revealed similar results. In this investigation, the goodness-of-fit was also an independent favorable prognostic factor for overall survival in the final multivariate Cox-regressions, whereas the FD was of no prognostic relevance Citation[132].
Figure 6. Regression plot of the fractal determination in a blast nucleus of a patient with acute precursor B lymphoblastic leukemia. The y values of the measured values (diamonds) are rather close to those of the calculated (ideal) regression curve. The goodness-of-fit (R2 = 0.976) shows that the observed structure approximates an ideal fractal. Scaling window: 200 nm–6.000 nm.
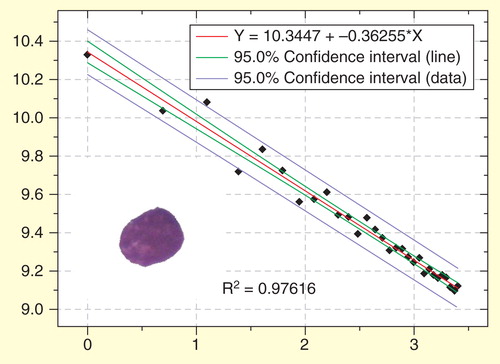
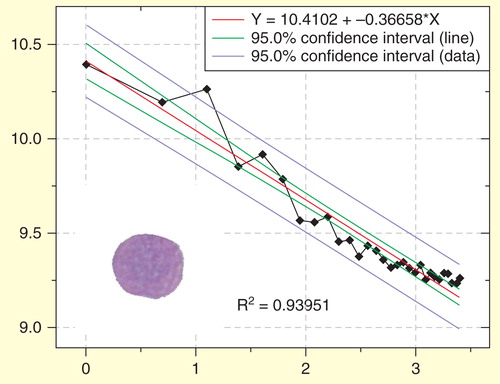
Figure 7. Regression plot of the fractal determination in a blast nucleus of another patient with acute precursor B lymphoblastic leukemia. In this case the y values of the measured values (diamonds) are more distant to the calculated (ideal) regression curve. The goodness-of-fit (R2 = 0.9395) shows that the observed structure is more distant to an ideal fractal than in . Scaling window: 200 nm–6.000 nm.
In a study applying the same techniques in May-Grünwald-Giemsa-stained cytological bone marrow preparations from patients with multiple myelomas, both the FD and its goodness-of-fit were together with ISS stage independent prognostic factors for overall survival in the final Cox model () Citation[124]. The FD was, again, an adverse prognostic factor in contrast to the goodness-of-fit, which was independently a favorable feature ().
Figure 8. Estimation of the fractal dimension of a myeloma cell nucleus. (A) Myeloma cell nucleus after segmentation (left) and its pseudo 3D transformation (right). (B) The log-log-plot (also called log-log plot or log-log graph ) for the determination of the fractal dimension (FD) is estimated from the slope of the ideal regression line (black) obtained by curve fitting. X-axis shows the logarithms of the inverse values of the size of the structuring element and y axis the logarithmic values of the fractal areas. The fractal dimension (FD) is derived from the slope of the regression line.
Scaling window: 200 nm–6.000 nm.
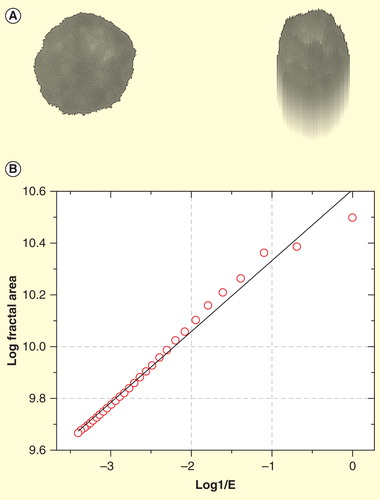
Figure 9. Kaplan–Meier survival plot of patients with multiple myeloma. Shorter survival for patients with higher values of the fractal dimension of nuclear chromatin in routinely stained bone marrow smears.
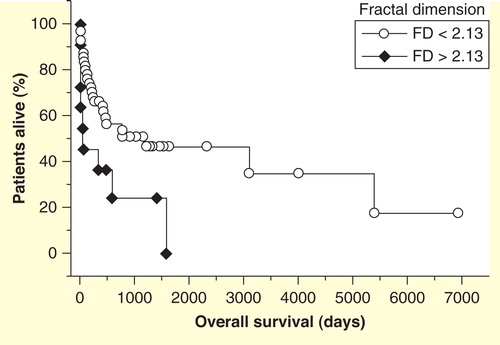
Table 2. Fractal parameters of chromatin as prognostic factors in malignant neoplasias.
Expert commentary
In summary, investigations from different and independent laboratories have shown that the FD of chromatin in routinely stained histological or cytological preparations:
1. Increases in various neoplasias during the evolution from pre-neoplastic stages to cancer (carcinogenesis);
2. Increases in various malignancies during the evolution from initial cancer stages to advanced stages (tumor progression);
3. Is higher in patients with bad prognosis. When this is not the case, the goodness-of-fit of the FD is lower in these patients.
It is noteworthy that in all these cases we are dealing with cut sections (histology) or projections (cytology) of nuclei with dyes bound to a 3D chromatin structure. There is experimental and theoretical evidence of a relation between 3D fractal characteristics and their counterparts in bi-dimensional projections. Lee and Kramer performed image analysis of particulate aggregates formed in coagulation processes and demonstrated that the 3D FDs can be estimated using the 2D properties of fractal aggregates Citation[144]. Vormoor demonstrated that the FD of clusters of colloidal particles can be calculated from the X-ray micrographs, which may be considered as projections of these clusters Citation[145]. According to Pentland, 2D intensity images show a fractal pattern, if the corresponding 3D structure is fractal in the general case of Brownian self-similarity Citation[141]. Therefore, relatively thick and stained histological 2D sections, as well as 3D projections of the nucleus into the second dimension in cytological smears, both with fractal properties, represent well the 3D optical organization Citation[80].
From these studies, we can conclude that the 3D dye-staining arrangement in fixed nuclei has fractal features, and that changes of this 3D arrangement will be detectable in histologic cut-sections or cytological smears.
Although it is rather intuitive to believe that the fractal characteristics of this 3D dye-binding configuration and the fractal-folding model of chromatin in the nucleus should be somehow related, a clear-cut proof has not been demonstrated up to now.
It is important to describe the general changes, in different levels of the nuclear structure and organization, during carcinogenesis and tumor progression and to look for differences between nuclei of neoplasias with a good or a bad prognosis.
Carcinogenesis and tumor progression are accompanied by both genomic and epigenomic changes, equivalent to alterations of the chromatin texture. Genomic alterations include single-nucleotide substitutions, insertions, gene fusions, deletions, chromosomal rearrangements, copy-number alterations, whole-chromosome duplications/deletions and inheritable changes in cell state or alterations of the chromosomal position Citation[146,147]. Traditionally, these alterations have been considered to arise sequentially and to give rise to the progressively more aggressive and invasive phenotypes observed during tumorigenesis Citation[148]. Some replication timing changes can directly provoke overt genomic instability and induce dramatic mutational changes, such as chromothripsis and kataegis Citation[149,150].
Recent work suggests that the pattern of the SNCAs in cancer depends on the spatial proximity of DNA regions replicating at the same time, and thus is a consequence of the fractal globule configuration Citation[151]. Cancer progression is driven by the accumulation of a small number of genetic alterations, together with the collective effect of tens of thousands of additional mutations termed passengers. Moreover, neoplastic cells often reveal alterations of chromosomal positioning associated with increased gene expression. In this context, it was hypothesized that relocation of the chromosomes may provoke alterations of the chromatin pattern in malignant cells Citation[114].
Epigenetic alterations may be very important for the pathogenesis and progression of cancer Citation[152,153]. Frequent epigenetic changes in malignant neoplasias are global hypomethylation and focal hypermethylation of multiple CpG island gene regulatory regions. Hypomethylated repeat sequences are decondensed. Hypomethylation may induce genetic instability and be associated with tumor progression Citation[154,155]. Malignant growth may provoke histone modifications, which are epigenetic regulators of chromatin and can influence the genome compartmentalization. DNA methylation, together with histone modifications may induce aberrant gene expression in many tumors Citation[156]. Finally, it was postulated that malignant neoplasias could not only reveal genetic but also epigenetic instability Citation[157].
During carcinogenesis and tumor progression these phenomena accumulate all over the nucleus, which is undergoing constant remodeling with a progressive gain of dark chromatin spots with hypomethylated ‘clear’ surroundings, resulting in an increasing number of chromatin areas of varying staining intensity. Additionally, translocations, gene amplifications and alterations of the chromosomal positions create inside the rather limited nuclear space more and more irregularly folded borders between the darker (inactive) and lighter (active) chromatin areas. In the pseudo-3D images, these nuclei are expected to show a ‘rougher’, more space-filling surface, which is equivalent to a higher FD of the chromatin. In other words, these multiple and widespread, in part invisible chromatin alterations are added as a kind of noise to the pre-existent fractal structure of the cancer cell nucleus, which gains complexity and thus a higher FD. It is well known that the addition of noise to a fractal image may increase its FD.
Generally, aggressive neoplasias are characterized by genetic instability, with increased number of genetic or epigenetic changes, which provoke more chromatin rearrangements per nucleus. For various neoplasias, it has been shown that an increasing number of chromosomal alterations is accompanied by a worse prognosis. For example, metastasis development in synovial sarcoma has been associated with chromosome complexity Citation[158]. In patients with myelodysplasia, a complex karyotype has been related to poor prognosis Citation[159] and the multifactor copy number index has shown to be an unfavorable prognostic factor in patients with Ewing sarcoma Citation[161]. In a similar manner, patients with high-risk neuroblastomas and only few copy number aberrations had a better prognosis Citation[160].
Therefore, in genetically unstable neoplasias with a poor prognosis we expect more complex chromatin remodeling, with many areas of varying optical density (alternating lighter and darker spots) and more irregular borders between them. These morphologic features would be more space filling in the pseudo-3D images, equivalent to a higher FD.
An alternative hypothesis to explain the increasing FD of stained nuclei in more aggressive neoplasias would be based on changes in the hetero-euchromatin balance. Recently, special attention has been drawn to the darkly staining heterochromatin texture in neoplastic cells, which, for pathologists, is a very important diagnostic criterion. In cancer, heterochromatin domains can change their localization and form aberrant aggregates, but the most frequent change is general heterochromatin loss in cancer nuclei, very often associated with high malignancy and poor prognosis Citation[70]. Assuming a considerable heterochromatin loss in high-risk neoplasias and a lower FD of heterochromatin than of euchromatin, the average FD of the nuclei would be higher in patients with bad prognosis, thus explaining the results of the aforementioned studies. It is noteworthy that in the studies of Bancaud et al., heterochromatin had a considerably lower FD than euchromatin Citation[80,81]. But it has to be emphasized that this was only valid for a scaling window from 2 to 100 nm, whereas the scaling windows of the cited light microscopic studies were situated in the range between 200 and 10,000 nm. On the other hand, it is possible that the structural differences between eu- and heterochromatin at the molecular level might have influenced the binding characteristics of the dyes so that these differences at a molecular scale are now, again, present in the scaling window of light microscopic observation. To the best of our knowledge, no studies comparing the FDs of eu- and heterochromatin in routinely stained slides are available. But these investigations would be essential in order to corroborate our hypothesis.
An equivalent to our variable ‘goodness-of-fit’, the so-called ‘fractal fit’ was described by Di Giovanni et al. and used for the analysis of breast tumors analyzed by dynamic contrast-enhanced magnetic resonance imaging. The fractal fit of the tumor images showed to be related to the tumor response to chemotherapy Citation[162]. At the moment, it is difficult to explain the genetic or epigenetic equivalent of the variable ‘goodness-of-fit’. In three studies, it had been shown that chromatin with higher goodness-of-fit, that is, with a structure more close to the ‘ideal’ fractal, was an independent favorable prognostic feature, that is, this variable revealed additional prognostic information in the Cox regressions, that was independent from the prognostic relevance of the FD and from other well-established clinical and laboratory prognostic parameters.
The scaling window for the variable goodness-of-fit ranged between 200 and 6000 nm. In order to explain the pathophysiological meaning of this variable, we can hypothesize that the large number of genetic and epigenetic modifications in more aggressive neoplasias could disturb the process of chromatin self-organization to such an extent that the fractal characteristics are not as perfect as in less aggressive cases. But this explanation is highly speculative at the moment.
FD analysis shows significant changes with image resolution and exposure time in radiographic studies Citation[163] and staining intensity in cytological analysis Citation[111]. The variable ‘goodness-of-fit’ is a very robust texture analysis feature, since it is much more independent of staining variations than the FD Citation[111]. This may in part explain, why in some studies only this variable and not the FD was associated with patients’ survival.
It is noteworthy that the aforementioned studies were based on images acquired from histological or cytological slides, stained with various dyes (mainly H&E or Giemsa stains) in different laboratories. Some investigators used binarized, others pseudo-3D image projections. The binarization criteria varied, of course, between the study groups, which makes a comparison of the absolute values of the FDs rather difficult. Nevertheless, in all studies an increasing FD (or decreasing goodness-of-fit) was an indicator of a worse prognosis. Most probably, this might be due to the fact that even under these varying conditions, all staining procedures, although non-stoichiometric for DNA or proteins, permit to distinguish eu- and heterochromatin in a satisfactory manner, both in pseudo-3D and binarized images.
In summary, fractal features can be easily obtained from digitalized images of routinely stained cytological or histological tumor preparations using simple, reproducible and inexpensive techniques. Even routine slides from the archives may be used. Therefore, retrospective studies are feasible without any additional costs. Both, the FD and its goodness-of-fit, permit to estimate the complexity of the chromatin rearrangement in a global manner in tumor cells. Several studies indicate that both variables may reveal new and biologically relevant prognostic information.
Five-year view
Although the presented methods have shown to be rather robust, more basic studies must be done. The influence of different fixation procedures, as well as of different staining protocols on the nuclear fractal features must be prospectively studied. Comparison of light and electron microscopic images would be useful. Suggestions of alternative staining and analysis techniques were discussed in detail by Bancaud et al. Citation[80]. As mentioned before, eu- and heterochromatin should be evaluated separately. The practical value for prognosis of the fractal features should be studied in many more tumor types, such as breast, gastrointestinal and renal cancer, as well as gliomas, sarcomas and lymphomas. At the moment, we do not know the whole spectrum of histological tumor types where fractal features of chromatin in routinely prepared slides could be used as a prognostic marker. These studies should always include a multivariate comparison with well-established clinical, laboratory and prognostic features. Further studies should include molecular biologic evaluations, so that genetic and epigenetic modifications could be related to changes of the fractal characteristics. These studies are necessary, since we do not know the extent of genetic or epigenetic alterations which is necessary to cause morphologically detectable changes of fractality. It is desirable to investigate which tumor types need a separate investigation of chromatin from the nuclear periphery and the central part of the nucleus Citation[138]. Furthermore, it would be interesting to include fractal variables in commercial softwares, especially the feature of goodness-of-fit. The concept of goodness-of-fit should be compared with the concept of asymptotic fractals Citation[119,164] and variables derived from the latter should be tested in prognostic marker studies. In general, it is necessary to compare the classical methods to estimate the FD, described in this review, with other mathematical concepts of the characterization of fractality Citation[164–166]. It would also be interesting to use other methods for image generation, for example, new non-invasive photonic techniques such as the FD measurements in light scattering microscopy and look for the equivalence of the results Citation[165–167].
A new challenge for the fractal analysis is the introduction of virtual microscopy Citation[168–171], which uses whole or near-whole slide digitalization with the creation of a huge storage demand. Therefore, data compression is necessary, but this procedure reduces considerably the reliability of the computational texture analysis Citation[172]. The development of alternative compression techniques is desirable. Finally, fractal variables could be compared with other texture parameters, for example, those obtained by partial-wave spectroscopy of nuclear density variations, which has shown to detect chromosome condensations in computer simulations Citation[173]. Since the entropy concept has shown to reveal important information on growth and evolution of malignant neoplasias, entropy calculations of the chromatin structure or its image configurations should be compared with fractal features Citation[2,174,175].
In a recent study on the genome of Drosophila melanogaster, Cattani and Pierro demonstrated in nucleotide sequences with high FD a higher frequency distribution of guanine whereas a low FD was characterized by more adenine Citation[176]. Therefore, it would be interesting to investigate whether the FD of stained chromatin would, in a similar manner, indicate variations of the chemical composition.
Finally, since it had been postulated that the fractal globule might be an unstable conformation only existing in the presence of extra constraints such as cross-links, the influence of different fixative solutions on the fractal characteristics of stained chromatin should be investigated Citation[177].
Key issues
• The fractal concept has improved our understanding of many phenomena in biomedical sciences.
• Recently, a fractal globule model describing the 3D configuration of the cell nucleus has been introduced.
• In histology and cytology, fractal characteristics of chromatin have been described during the last 20 years.
• Fractal features, such as the fractal dimension or the goodness-of-fit of the regression curve can easily be estimated in digitalized microscopic images.
• During carcinogenesis and tumor progression, the fractal dimension (FD) of chromatin usually increases.
• In various tumors, an increased FD is an unfavorable prognostic facture.
• The goodness-of-fit of the regression line may predict outcome, with a closer fit to the ideal fractal structure indicating a better prognosis.
• Accumulating genetic and epigenetic alterations cause progressive chromatin remodeling.
• A more complex chromatin structure, less heterochromatin and a less perfect self-organization of the nucleus are expected in more aggressive neoplasias.
Acknowledgments
The author would like to thank AA Piaza for assistance with the creation of the figures.
Financial & competing interests disclosure
The author has received grants from the São Paulo Research Foundation FAPESP (project 2007/52015–0) and the National Council of Technological and Scientific Development CNPq (project 307270/2010-6). The author has no other relevant affiliations or financial involvement with any organization or entity with a financial interest in or financial conflict with the subject matter or materials discussed in the manuscript apart from those disclosed.
No writing assistance was utilized in the production of this manuscript.
Notes
References
- Mandelbrot BB. Stochastic models for the Earth’s relief, the shape and the fractal dimension of the coastlines, and the number-area rule for islands. Proc. Natl Acad. Sci. U. S. A. 72, 3825–3828 (1975).
- van Rooij MMJW, Nash BA, Rajaraman S et al. A fractal approach to dynamic inference and distribution analysis. Front. Physiol. 4, 1 (2013).
- Mandelbrot BB. Fractals and Chaos. Springer, Berlin (2004).
- Losa, G. A. Fractals in Biology and Medicine. Encyclopedia of Molecular Cell Biology and Molecular Medicine. Wiley-VCH Online Library, Germany (2011).
- Losa GA: The fractal geometry of life. Riv. Biol. 102, 29–59. (2009)
- Wolfram, S. A new kind of science. Wolfram Media Inc, UK (2002).
- Castro M, Cuerno R, Nicoli M et al. Universality of cauliflower-like fronts: from nanoscale thin films to macroscopic plants. N. J. Phys. 14, 103039 (2012).
- Kim SH. Fractal structure of a white cauliflower. J. Korean Phys. Soc. 46, 474–477 (2005).
- Thamrin C, Stern G, Frey U. Fractals for physicians. Paediatr. Respir. Rev. 11, 123–131 (2010).
- Waliszewski P, Konarski J. Tissue as a self-organizing system with fractal dynamics. Adv. Space Res. 28, 545–548 (2001).
- Waliszewski P, Molski M, Konarski J. On the holistic approach in cellular and cancer biology: nonlinearity, complexity, and quasi-determinism of the dynamic cellular network. J. Surg. Oncol. 68(2), 70–78 (1998).
- Waliszewski P, Konarski J, Molski M. On the modification of fractal self-space during cell differentiation or tumor progression. Fractals 8(2), 195–203 (2000).
- Waliszewski P. A principle of fractal-stochastic dualism and Gompertzian dynamics of growth and self-organization. Biosystems 82, 61–73 (2005).
- Molski M, Konarski J. Tumor growth in the space-time with temporal fractal dimension. Chaos Soliton. Fract. 36, 811–818 (2008).
- Herreros FO, Cintra ML, Adam RL et al. Remodeling of the human dermis after application of salicylate silanol. Arch. Dermatol. Res. 299, 41–45 (2007).
- Kurakin A. The self-organizing fractal theory as a universal discovery method: the phenomenon of life. Theor. Biol. Med. Model. 8, 4 (2011).
- Rocha LB, Adam RL, Leite NJ et al. Shannon's entropy and fractal dimension provide an objective account of bone tissue organization during calvarial bone regeneration. Microsc. Res. Tech. 71(8), 619–625 (2008).
- Tiraihi A, Tiraihi M, Tiraihi T. Self-organization of developing embryo using scale-invariant approach. Theor. Biol. Med. Model. 8, 17 (2011).
- Bizzarri M, Pasqualato A, Cucina A et al. Physical forces and non-linear dynamics mould fractal cell shape. Quantitative morphological parameters and cell phenotype. Histol. Histopathol. 28, 155–174 (2013).
- Guidolina D, Crivellatob E, Ribatti D. The ‘self-similarity logic’ applied to the development of the vascular system Dev. Biol. 351, 156–162 (2011).
- Grizzi F, Colombo P, Taverna G et al. Geometry of human vascular system: is it an obstacle for quantifying antiangiogenic therapies? Appl. Immunohistochem. Mol. Morphol. 15, 134–139 (2007).
- West BJ. Fractal physiology and the fractional calculus: a perspective. Front. Physiol. 1, 12 (2010).
- Meier J, Roberts C, Avent K et al. Fractal organization of the human t cell repertoire in health and after stem cell transplantation. Biol. Blood Marrow Transplant. 19, 366–377 (2013).
- Adam RL, Corsini TCG, Silva PV et al. Fractal dimensions applied to thick contour detection and residues-Comparison of keloids and hypertrophic scars. Cytometry A 59A, 63–64 (2004).
- Di Ieva A, Bruner E, Widhalm G et al. Computer-assisted and fractal-based morphometric assessment of microvascularity in histological specimens of gliomas. Sci. Rep. 2, 429 (2012).
- D'Anselmi F, Valerio M, Cucina A et al. Metabolism and cell shape in cancer: a fractal analysis. Int. J. Biochem. Cell Biol. 43, 1052–1058 (2011).
- Okie JG. General models for the spectra of surface area scaling strategies of cells and organisms: fractality, geometric dissimilitude, and internalization. Am. Nat. 181, 421–439 (2013).
- Vasiljevic J, Reljin B, Sopta J et al. Application of multifractal analysis on microscopic images in the classification of metastatic bone disease. Biomed. Microdevices. 14(3), 541–548 (2012).
- Jo J, Hörnblad A, Kilimnik G et al. The fractal spatial distribution of pancreatic islets in three dimensions: a self-avoiding growth model. Phys. Biol. 10(3), 036009 (2013).
- Pittman-Polletta BR, Scheer FA, Butler MP et al The role of the circadian system in fractal neurophysiological control. Biol. Rev. Camb. Philos. Soc. doi:10.1111/brv.12032 (2013) ( Epub ahead of print).
- Karperien A, Ahammer H, Jelinek HF. Quantitating the subtleties of microglial morphology with fractal analysis. Front. Cell. Neurosci. 7, 3 (2013).
- Delignieres D, Marmelat V. Fractal fluctuations and complexity: current debates and future challenges. Crit. Rev. Biomed. Eng. 40, 485–500 (2012).
- Kelty-Stephen D, Dixon JA. When physics is not ‘just physics’: complexity science invites new measurement frames for exploring the physics of cognitive and biological development. Crit. Rev. Biomed. Eng. 40(6), 471–483 (2012).
- Yang J, Wang Y. Design of vascular networks: a mathematical model approach. Int. J. Numer. Method. Biomed. Eng. 29, 515–529 (2013).
- Cattani C, Pierro G, Altieri G. Entropy and multifractality for the myeloma multiple TET 2 gene. Math. Probl. Eng. 12, 193761 (2012).
- West D, West BJ. On allometric relations. Int. J. Mod. Physics. B 26, 1230010 (2012).
- Goldberger AL, West BJ. Fractals in physiology and medicine. Yale J. Biol. Med. 60 421–435 (1987).
- West BJ, Goldberger AL. Physiology in fractal dimensions. Am. Sci. 75, 354–365 (1987).
- West BJ. Physiology in fractal dimensions-error tolerance. Ann. Biomed. Eng. 18(2), 135–149 (1990).
- Losa GA, Di Ieva A, Grizzi F, De Vico G. On the fractal nature of nervous cell system. Front. Neuroanat. 5, 45 (2011).
- Garland J. Energy management – a critical role in cancer induction? Crit. Rev. Oncol. Hematol. doi:10.1016/j.critrevonc.2013.04.001 (2013) ( Epub ahead of print).
- Grizzi F, Russo C, Colombo P et al. Quantitative evaluation and modeling of two-dimensional neovascular network complexity: the surface fractal dimension. BMC Cancer 5, 14 (2005).
- Metze K. Fractal dimension of chromatin and cancer prognosis. Epigenomics 2, 601–604 (2010).
- Weyn B, Tjalma WAA, Vermeylen P et al. Determination of tumour prognosis based on angiogenesis-related vascular patterns measured by fractal and syntactic structure analysis. Clin. Oncol. 16, 307–316 (2004).
- W. Klonowski, M. Pierzchalski, P. Stepien et al. Application of higuchi’s fractal dimension in analysis of images of anal intraepithelial neoplasia. Chaos Soliton. Fract. 48, 54–60 (2013).
- Dixon JA, Holden JG, Mirman D et al. Multifractal dynamics in the emergence of cognitive structure. Top. Cogn. Sci. 4, 51–62 (2012).
- Ngamsaad W, Khompurngson K. Self-similar dynamics of bacterial chemotaxis. Phys. Rev. E. Stat. Nonlin. Soft Matter Phys. 86, 062901 (2012).
- Stoop R, Saase V, Wagner C et al. Beyond scale-free small-world networks: cortical columns for quick brains. Phys. Rev. Lett. 110, 108105 (2013).
- Rodríguez L, Jovani R, Mougeot F. Fractal geometry of a complex plumage trait reveals bird's quality. Proc. Biol. Sci. 280(755), 20122783 (2013).
- Gao J, Hu J, Tung WW et al. Multiscale analysis of biological data by scale-dependent lyapnov exponent. Front. Physiol. 2, 110 (2011).
- Isaeva VV, Kasyanov NV, Presnov EV. Topological singularities and symmetry breaking in development. BioSystems 109, 280–298 (2012).
- West G, Brown J, Enquist B. A general model for the origin of allometric scaling laws in biology. Science 276, 122–126 (1997).
- Dinicola S, D'Anselmi F, Pasqualato A et al. A systems biology approach to cancer: fractals, attractors, and nonlinear dynamics. OMICS 15(3), 93–104 (2011).
- Ryan JJ, Dows BL, Kirk MV et al. A systems biology approach to invasive behavior: comparing cancer metastasis and suburban sprawl development. BMC Res. Notes 3, 36 (2010).
- Stoop R, Saase V, Wagner C et al. Beyond scale-free small-world networks: cortical columns for quick brains. Phys. Rev. Lett. 110(10), 108105 (2013).
- Bizzarri M, Giuliani A, Cucina A et al. Fractal analysis in a systems biology approach to cancer. Semin. Cancer. Biol. 21, 175–182 (2011).
- Milotti E, Vyshemirsky V, Sega M et al. Metabolic scaling in solid tumours. Sci. Rep. 3, 1938 (2013).
- Rudge TJ, Federici F, Steiner PJ et al. Cell shape-driven instability generates self-organised, fractal patterning of cell layers. ACS Synth. Biol. doi:10.1021/sb400030p (2013) ( Epub ahead of print).
- Ong YT, De Silva DA, Cheung CY et al. Microvascular structure and network in the retina of patients with ischemic stroke. Stroke 44(8), 2121–2127 (2013).
- Macintosh AJ, Pelletier L, Chiaradia A et al. Temporal fractals in seabird foraging behaviour: diving through the scales of time. Sci. Rep. 3,1884 (2013).
- Baselga A, Fujisawa T, Crampton-Platt A et al. Whole-community DNA barcoding reveals a spatio-temporal continuum of biodiversity at species and genetic levels. Nat. Commun. 4, 1892 (2013).
- Plotze RO, Falvo M, Pádua JG et al. Leaf shape analysis using the multiscale Minkowski fractal dimension, a new morphometric method: a study with Passiflora (Passifloraceae). Can. J. Bot. 83, 287–301 (2005).
- Isaeva VV. Self-organization in biological systems Biol. Bull. 39, 110–118 (2012).
- Cymberknop LJ, Legnani W, Pessana FM et al. Coronary arterial stiffness is related with a loss of fractal complexity in the aortic pressure. Conf. Proc. IEEE Eng. Med. Biol. Soc. 2012, 4200–4203 (2012).
- Takahashi M. A fractal model of chromosomes and chromosomal DNA replication. J. Theor. Biol. 141, 117–136 (1989).
- Di Ieva A, Weckman A, Di Michel J et al. Microvascular morphometrics of the hypophysis and pituitary tumors: From bench to operating theatre. Microvasc. Res. 89, 7–14 (2013).
- Sejdic E, Lipsitz LA. Necessity of noise in physiology and medicine. Comput. Methods Programs Biomed. 111(2), 459–470 (2013).
- Matioli GT. Scaling concepts in cellular and subcellular dynamics. Med. Hypotheses 34, 316–330 (1991).
- de Salazare Fernandes T, da Silva IMS, Moraes RB et al. Non-linear dynamics of chromosome condensation induced by colcemid. Braz. Arch. Biol. Technol. 56, 85–92 (2013).
- Carone DM, Lawrence JB. Heterochromatin instability in cancer: from the Barr body to satellites and the nuclear periphery. Semin. Cancer Biol. 23(2), 99–108 (2013).
- Spinelli G. Heterochromatin and complexity: a theoretical approach. Nonlinear Dynamics Psychol. Life Sci. 7, 329–361 (2003).
- Peng CK, Buldyrev SV, Goldberger AL et al. Long-range correlations in nucleotide–sequences. Nature 356, 168–170 (1992).
- Stanley HE, Buldyrev SV, Goldberger AL et al. Scaling features of noncoding DNA. Phydica A 273, 1–18 (1999).
- Cattani C, Gaetano P. Complexity on acute myeloid leukemia mRNA transcript variant. Math. Probl. Eng. 2011, 16 (2011).
- Albrecht-Buehler G. Fractal genome sequences. Gene 498, 20–27 (2012).
- Sellis D, Provata A, Almirantis Y. Alu and LINE1 distributions in the human chromosomes: evidence of global genomic organization expressed in the form of power laws. Mol. Biol. Evol. 24, 2385–2399 (2007).
- Sellis D, Almirantis Y. Power-laws in the genomic distribution of coding segments in several organisms: an evolutionary trace of segmental duplications, possible paleopolyploidy and gene loss. Gene 447, 18–28 (2009).
- Lebedev DV, Filatov MV, Kuklin AI et al. Fractal nature of chromatin organization in interphase chicken erythrocyte nuclei: DNA structure exhibits biphasic fractal properties. FEBS Lett. 579, 1465–1468 (2005).
- Lebedev DV, Filatov MV, Kuklin AI et al. Structural hierarchy of chromatin in chicken erythrocyte nuclei based on small-angle neutron scattering: fractal. nature of the large-scale chromatin organization. Crystallogr. Reports 53, 110–115 (2008).
- Bancaud A, Lavelle C, Huet S et al. A fractal model for nuclear organization: current evidence and biological implications. Nucleic Acids Res. 40, 8783–8792 (2012).
- Bancaud A, Huet S, Daigle N et al. Molecular crowding affects diffusion and binding of nuclear proteins in heterochromatin and reveals the fractal organization of chromatin. EMBO J. 28, 3785–3798. (2009).
- Lieberman-Aiden E, van Berkum NL, Williams L et al. Comprehensive mapping of long-range interactions reveals folding principles of the human chromosome. Science 326, 289–293 (2009).
- Zhang Y, McCord RP, Ho YJ et al. Spatial organization of the mouse genome and its role in recurrent chromosomal translocations. Cell 148, 908–921 (2012).
- Grosberg A, Rabin Y, Havlin A et al. Crumpled globule model of the 3-dimensional structure of DNA. Europhys. Lett. 23, 373–378 (1993).
- McNally JG, Mazza D. Fractal geometry in the nucleus. EMBO J. 29, 2–3 (2010).
- Grosberg, AY. How two meters of DNA fit into a cell nucleus: Polymer models with topological constraints and experimental data. Polymer Science Ser. C 54, 1–10 (2012).
- Hübner MR, Eckersley-Maslin MA, Spector DL. Chromatin organization and transcriptional regulation. Curr. Opin. Genet. Dev. 23(2), 89–95 (2013).
- Mirny LA. The fractal globule as a model of chromatin architecture in the cell. Chromosome Res. 19, 37–51 (2011).
- Bickmore WA, van Steensel B. Genome architecture: domain organization of interphase. Chromosomes Cell 152, 1270–1284 (2013).
- Dekker J, Marti-Renom MA, Mirny LA. Exploring the three-dimensional organization of genomes: interpreting chromatin interaction data. Nat. Rev. Genet. 14, 390–403 (2013).
- de Wit E, de Laat W. A decade of 3C technologies: insights into nuclear organization. Genes Dev. 26(1), 11–24 (2012).
- Barbieri M, Chotaliab M, Fraser J et al. Complexity of chromatin folding is captured by the strings and binders switch model. Proc. Natl Acad. Sci. U. S. A. 109, 16173–16178 (2012).
- Cavalli G, Misteli T. Functional implications of genome topology. Nat. Struct. Mol.Biol. 20, 290–299 (2013).
- Fudenberg G, Getz G, Meyerson M et al. High order chromatin architecture shapes the landscape of chromosomal alterations in cancer. Nat. Biotechnol. 29, 1109–1113 (2011).
- Li W. G+C Content evolution in the human genome. In: eLS. John Wiley & Sons, Ltd, Chichester, UK (2013).
- Tang SJ. Chromatin organization by repetitive elements (CORE): a genomic principle for the higher-order structure of chromosomes. Gene 2, 502–515 (2011).
- Klimopoulos A, Sellis D, Almirantis Y. Widespread occurrence of power-law distributions in inter-repeat distances shaped by genome dynamics. Gene 499, 88–98 (2012).
- Arneodo A, Vaillant C, Audit B et al. Multi-scale coding of genomic information: From DNA sequence to genome structure and function. Phys. Rep. 498, 45–188 (2011).
- Singh Sandhu K, Li G, Sung WK et al. Chromatin interaction networks and higher order architectures of eukaryotic genomes. J. Cell. Biochem. 112(9), 2218–2221 (2011).
- Irinopoulou T, Rigaut JP, Benson MC. Toward objective prognostic grading of prostatic carcinoma using image analysis. Anal. Quant. Cytol. Histol. 15, 341–344 (1993).
- MacAulay C, Palcic B. Fractal texture features based on optical density surface area: use in image analysis of cervical cells. Anal. Quant. Cytol. Histol. 12, 394–398 (1990).
- Graber R, Losa GA. Changes in the activities of signal transduction and transport membrane enzymes in CEM lymphoblastoid cells by glucocorticoid-induced apoptosis. Anal. Cell. Pathol. 8, 159–175 (1995).
- Einstein AJ, Wu HS, Gil J. Self-affinity and lacunarity of chromatin texture in benign and malignant breast epithelial cell nuclei. Phys. Rev. Let. 80, 397–400 (1998).
- Delides A, Panayiotides I, Alegakis A et al. Fractal dimension as a prognostic factor for laryngeal carcinoma. Anticancer Res. 25, 2141–2144 (2005).
- Nielsen B, Albregtsen F, Danielsen HE. Fractal analysis of monolayer cell nuclei from two different prognostic classes of early ovarian cancer. In: Fractals in Biology and Medicine (Volume 4). Losa GA, Merlini D, Nonnenmacher TF, Weibel ER ( Eds). Birkhäuser, Basel, 175–186 (2005).
- Ferreira RC, de Matos PS, Adam RL, Leite NJ, Metze K. Application of the Minkowski fractal dimension for the differential diagnosis in thyroid follicular neoplasias. Cell. Oncol. 28, 5–6 (2006).
- Mello MRB, Metze K, Adam RA et al. Phenotypic subtypes of acute lymphoblastic leukemia associated with different nuclear chromatin texture. Anal. Quant. Cytol. Histol. 30, 175–184 (2008).
- Goutzanis L, Papadogeorgakis N, Pavlopoulos PM et al. Nuclear fractal dimension as a prognostic factor in oral squamous cell carcinoma. Oral Oncol. 44, 345–353 (2008).
- Mashiah A, Wolach O, Sandbank Juziel O et al. Lymphoma and leukemia cells possess fractal dimensions that correlate with their biological features. Acta Haematol. 119, 142–150 (2008).
- Metze K, Ferreira RC, Adam RL et al. Chromatin texture is size dependent in follicular adenomas but not in hyperplastic nodules of the thyroid. World J. Surg. 32, 2744–2746 (2008).
- Metze K, Adam RL, Vido JR et al. The influence of staining characteristics on nuclear texture features in cytology. Anal. Quant. Cytol. Histol. 31, 241–246 (2009).
- Metze K, Ferro DP, Falconi MA et al. Fractal characteristics of nuclear chromatin in routinely stained cytology are independent prognostic factors in patients with multiple myeloma. Virchows Archiv. 445(Suppl. 1), 7 (2009).
- Bedin V, Adam RL, de Sá BC et al. Fractal dimension of chromatin is an independent prognostic factor for survival in melanoma. BMC Cancer 10, 260 (2010).
- Dey P. Cancer nucleus: morphology and beyond. Diagn. Cytopathol. 38, 382–390 (2010).
- Mairinger T, Mikuz G, Gschwendtner A. Nuclear chromatin texture analysis of nonmalignant tissue can detect adjacent prostatic adenocarcinoma. Prostate 41(1), 12–19 (1999).
- Huisman A, Ploeger LS, Dullens HF et al. Development of 3D chromatin texture analysis using confocal laser scanning microscopy. Cell. Oncol. 27, 335–345 (2005).
- Castelli C, Rosa GA. Ultrastructural complexity of nuclear components during early apoptotic phases in breast cancer cells. Anal. Cell. Pathol. 23, 1–9 (2001).
- Losa GA, Castelli C. Nuclear patterns of human breast cancer cells during apoptosis: characterisation by fractal dimension and co-occurrence matrix statistics. Cell Tissue Res. 322, 257–267 (2005).
- Landini G, Rippin JW. Quantification of nuclear pleomorphism using an asymptotic fractal model. Anal. Quant. Cytol. Histol. 18, 167–176 (1996).
- Losa GA, Graber R, Baumann G et al. Steroid hormones modify nuclear heterochromatin structure and plasma membrane enzyme of MCF-7 cells. A combined fractal, electron microscopical and enzymatic analysis. Eur. J. Histochem. 42, 21–29 (1998).
- Doudkine A, Macaulay C, Poulin N, Palcic B. Nuclear texture measurements in image cytometry. Pathologica 87(3), 286–299 (1995).
- De Mello MR, Albuquerque DM, Pereira-Cunha FG et al. Molecular characteristics and chromatin texture features in acute promyelocytic leukemia. Diagn. Pathol. 7, 75 (2012).
- Vido JR, Adam RL, Lorand-Metze IG et al. Computerized texture analysis of atypical immature myeloid precursors in patients with myelodysplastic syndromes: an entity between blasts and promyelocytes. Diagn. Pathol. 6, 93 (2011).
- Ferro DP, Falconi MA, Adam RL et al. Fractal characteristics of May-Grünwald-Giemsa stained chromatin are independent prognostic factors for survival in multiple myeloma. PLoS ONE 6, e20706 (2011).
- Metze K, Lorand-Metze I, Leite NJ et al. Goodness-of-fit of the fractal dimension as a prognostic factor. Cell. Oncol. 31, 503–504 (2009).
- Sedivy R, Windischberger C, Svozil K et al. Fractal analysis: an objective method for identifying atypical nuclei in dysplastic lesions of the cervix uteri. Gynecol. Oncol. 75, 78–83 (1999).
- Dey P, Sharma N, Samanta S. Fractal dimension of cervical intraepithelial lesions on cytology smear. Anal. Quant. Cytol. Histol. 32, 320–322 (2010).
- Dey P, Banik T. Fractal dimension of chromatin texture of squamous intraepithelial lesions of cervix. Diagn. Cytopathol. 40, 152–154 (2012).
- Ahammer H, Kroepfl JM , Hackl C et al. Fractal dimension and image statistics of anal intraepithelial neoplasia. Chaos Soliton. Fract. 44, 86–92 (2011).
- Vasilescu C, Giza DE, Petrisor P et al. Morphometrical differences between resectable and non-resectable pancreatic cancer: a fractal analysis. Hepatogastroenterology 59, 284–288 (2012).
- Adam RL, Silva RC, Pereira FG et al. The fractal dimension of nuclear chromatin as a prognostic factor in acute precursor B lymphoblastic leukemia. Cell. Oncol. 28, 55–59 (2006).
- Metze K, Mello MRB, Albanez K, et al. Fractal characteristics of chromatin as independent prognostic factor in acute myeloid leukemias, submitted.
- Metze K, Adam RL. Fractality of chromatin. In: Fractals and Complexity. Waliszewski P ( Ed.). Format-Wroclaw, Poland, 12–15 (2013).
- Pantic I, Basta-Jovanovic G, Starcevic V et al. Complexity reduction of chromatin architecture in macula densa cells during mouse postnatal development. Nephrology (Carlton) 18, 117–124 (2013).
- Oszutowska-Mazurek D, Mazurek P, Sycz K et al. Estimation of fractal dimension according to optical density of cell nuclei in papanicolaou smears. Lect. Notes Comput. Sci. 7339, 456–463 (2012).
- Noy S, Vlodavsky E, Klorin G et al. Computerized morphometry as an aid in distinguishing recurrent versus nonrecurrent meningiomas. Anal. Quant. Cytol. Histol. 33(3), 141–150 (2011).
- Tóth KF, Knoch TA, Wachsmuth M et al. Trichostatin A-induced histone acetylation causes decondensation of interphase chromatin. J. Cell. Sci. 117, 4277–4287 (2004).
- Nielsen B, Albregtsen F, Danielsen HE. The use of fractal features from the periphery of cell nuclei as a classification tool. Anal. Cell. Pathol. 19, 21–37 (1999).
- Chan KL. Quantitative characterization of electron micrograph image using fractal feature. IEEE Trans. Biomed. Eng. 42, 1033–1037 (1995).
- Haidekker MA, Andresen R, Evertsz CJ et al. Issues of threshold selection when determining the fractal dimension in HRCT slices of lumbar vertebrae. Br. J. Radiol. 73(865), 69–72 (2000).
- Pentland AP. Fractal-based description of natural scenes. IEEE Trans. Pattern Anal. Mach. Intell. 6, 661–674 (1984).
- Mayer R, Brero A, von Hase J et al Common themes and cell type specific variations of higher order chromatin arrangements in the mouse. BMC Cell Biol. 6, 44 (2005).
- Stefan A, Taulescu M, Vidrighinescu R et al. Evaluating the endonuclear structure of normal and pathological lymphoblasts quantitatively. Bulletin UASMV, Veterinary Medicine 69, 1–2 (2012).
- Lee C, Kramer TA. Prediction of three-dimensional fractal dimensions using the two-dimensional properties of fractal aggregates. Adv. Colloid. Interface Sci. 112, 49–57 (2004).
- Vormoor O. Techniques for characterization of fractal clusters using X-ray microscopy. J. Phys. IV France 104, 513 (2003).
- Stratton MR, Campbell PJ, Futreal PA. The cancer genome. Nature 458, 720–724 (2009).
- McFarland C D, Korolev K S., GV Kryukov et al. Impact of deleterious passenger mutations on cancer progression. PNAS 110, 2910–2915 (2013).
- Podlaha O, Riester M, De S et al. Evolution of the cancer genome. Trends Genet. 28, 155–163 (2012).
- Wang E. Understanding genomic alterations in cancer genomes using an integrative network approach. Cancer Lett. (2013) ( In Press).
- Donley N, Thayer MJ. DNA replication timing, genome stability and cancer: Late and/or delayed DNA replication timing is associated with increased genomic instability. Semin. Cancer Biol. 23, 80–89 (2013).
- De S, Michor F. DNA replication timing and long-range DNA interactions predict mutational landscapes of cancer genomes. Nat. Biotechnol. 29, 1103–1108 (2011).
- Arai E, Kanai Y. DNA methylation profiles in precancerous tissue and cancers: carcinogenetic risk estimation and prognostication based on DNA methylation status. Epigenomics 2, 467–481 (2010).
- Ross JP, Rand KN, Molloy P. Hypomethylation of repeated DNA sequences in cancer. Epigenomics 2, 245–269 (2010).
- Ehrlich M. DNA hypomethylation in cancer cells. Epigenomics 1, 239–259 (2009).
- Suvà ML, Riggi N, Bernstein BE. Epigenetic reprogramming in cancer. Science 339(6127), 1567–1570 (2013).
- Bapat SA. Modulation of gene expression in ovarian cancer by active and repressive histone marks. Epigenomics 2, 39–51 (2010).
- Fischer AH, Zhao C, Li QK et al. The cytologic criteria of malignancy. J. Cell. Biochem. 110, 795–811 (2010).
- Lagarde P, Przybyl J, Brulard C et al. Chromosome instability accounts for reverse metastatic outcomes of pediatric and adult synovial sarcomas. J. Clin. Oncol. 31(5), 608–615 (2013).
- Valcárcel D, Ademà V, Solé F et al. Complex, not monosomal, karyotype is the cytogenetic marker of poorest prognosis in patients with primary myelodysplastic syndrome. J. Clin. Oncol. 31, 916–922 (2013).
- Stigliani S, Coco S, Moretti S. High genomic instability predicts survival in metastatic high-risk neuroblastoma. Neoplasia 14(9), 823–832 (2012).
- Mona S. Jahromi MS, Putnam AR, Druzgal C et al. Molecular inversion probe analysis detects novel copy number alterations in Ewing sarcoma. Cancer Genet. 205(7–8), 391–404 (2012).
- Di Giovanni P, Ahearn TS, Semple SI et al. The biological correlates of macroscopic breast tumour structure measured using fractal analysis in patients undergoing neoadjuvant chemotherapy. Breast Cancer Res. Treat. 133(3), 1199–1206 (2012).
- Baksi BG, Fidler A. Image resolution and exposure time of digital radiographs affects fractal dimension of periapical bone. Clin. Oral. Investig. 16, 1507–1510 (2012).
- Landini G. Fractals in microscopy. J Microsc. 241:1–8 (2011)
- Muniandy SV, Stanslas J. Modelling of chromatin morphologies in breast cancer cells undergoing apoptosis using generalized Cauchy field. Comput. Med. Imaging Graph. 32, 631–637 (2008).
- Chalut KJ, Kulangara K, Wax A et al. Stem cell differentiation indicated by noninvasive photonic characterization and fractal analysis of subcellular architecture. Integr. Biol. (Camb) 3, 863–867 (2011).
- Chalut KJ, Ekpenyong AE, Clegg WL et al. Quantifying cellular differentiation by physical phenotype using digital holographic microscopy. Integr. Biol. (Camb) 4(3), 280–284 (2012).
- Kayser G, Kayser K. Quantitative pathology in virtual microscopy: history, applications, perspectives. Acta Histochem. 115(6), 527–532 (2013).
- Kayser K. Introduction of virtual microscopy in routine surgical pathology--a hypothesis and personal view from Europe. Diagn. Pathol. 7, 48 (2012).
- Kayser K, Görtler J, Borkenfeld S et al. How to measure diagnosis-associated information in virtual slides. Diagn. Pathol. 6(Suppl. 1), S9 (2011).
- Kayser K, Ogilvie R, Borkenfeld S et al. E-education in pathology including certification of e-institutions. Diagn. Pathol. 6(Suppl. 1), S11 (2011).
- Metze K, Adam RL, Leite NJ. Changes of texture features due to image compression. Diagn. Pathol. 5(Suppl. 1), S15 (2010).
- Kim JS, Pradhan P, Backman V et al The influence of chromosome density variations on the increase in nuclear disorder strength in carcinogenesis. Phys. Biol. 8(1), 015004 (2011).
- Kayser K, Kayser G, Metze K. The concept of structural entropy in tissue-based diagnosis. Anal. Quant. Cytol. Histol. 29, 296–308 (2007).
- Metze K, Adam RL, Kayser G et al. Pathophysiology of cancer and the entropy concept. Model-based reasoning in science and technology. Stud. Comput. Intell. 314, 199–206 (2010).
- Cattani C, Pierro G. On the fractal geometry of DNA by the binary image analysis. Bull. Math. Biol. (2013) doi:10.1007/s11538-013-9859-9 (Epub ahead of print).
- Schram RD, Barkema GT, Schiessel H. On the stability of fractal globules. J. Chem. Phys. 138(22), 224901 (2013).
Website
- Récamier V, Izeddin I, Darzacq X (2013) Fractal dimension of chromatin revealed by palm distribution of 3d palm data. http://www.focusonmicroscopy.org/2013/PDF/423_Recamier.pdf ( Accessed 03 May 2013)