
Abstract
Objective: Quantification of small molecule numbers often requires preamplification to generate enough copies for accurate downstream enumerations. Here, we studied experimental parameters in targeted preamplification and their effects on downstream quantitative real-time PCR (qPCR). Methods: To evaluate different strategies, we monitored the preamplification reaction in real-time using SYBR Green detection chemistry followed by melting curve analysis. Furthermore, individual targets were evaluated by qPCR. Result: The preamplification reaction performed best when a large number of primer pairs was included in the primer pool. In addition, preamplification efficiency, reproducibility and specificity were found to depend on the number of template molecules present, primer concentration, annealing time and annealing temperature. The amount of nonspecific PCR products could also be reduced about 1000-fold using bovine serum albumin, glycerol and formamide in the preamplification. Conclusion: On the basis of our findings, we provide recommendations how to perform robust and highly accurate targeted preamplification in combination with qPCR or next-generation sequencing.
Today, many research studies and clinical assessments are based on DNA and RNA analyses of limited sample sizes, including rare tissues, liquid biopsies, fine-needle aspirates and single cells. Numerous techniques to analyze individual cells are available, and single-cell analysis has become a powerful tool to identify and characterize distinct cell types and cell states, as well as to decipher molecular processes relevant in development and disease Citation[1–4]. Single-cell studies have revealed large cell-to-cell variability, even within seemingly homogenous populations, and we have only started to understand the role and importance of different molecular concentrations in cells and their impact on cellular functions and signaling Citation[5,6]. The analysis of DNA and RNA in a few or single cells with quantitative real-time PCR (qPCR) or next-generation sequencing usually requires that the material is preamplified to a level that is compatible with method constraints . Preamplification can be either global, targeting all molecules in an unselective manner Citation[7,8], or specific, targeting sequences of interest only Citation[9–13]. The most common strategy for targeted preamplification is based on multiplex PCR using pools of specific primer pairs Citation[14]. The preamplification PCR is performed in a limited number of cycles to avoid competition for reagents among the parallel reactions. To reduce the formation of nonspecific PCR products, the applied primer concentration is 10–20 times lower than a standard PCR. To compensate for the lower primer concentration, the annealing time is usually extended up to several minutes. The properties and limitations of targeted preamplification in DNA and cDNA quantification are poorly understood, despite its wide application.
Figure 1. (A) Overview of RNA and DNA analysis using qPCR and next-generation sequencing for small sample sizes. (B) Experimental setup evaluating the properties of targeted preamplification.
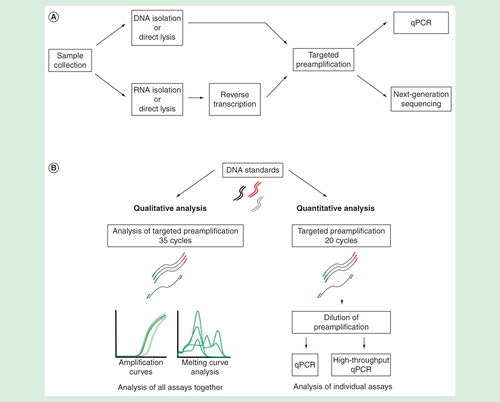
In this work, we studied targeted preamplification in detail. To assess its overall performance, we monitored the preamplification reaction in real-time using SYBR Green I detection chemistry followed by melting curve analysis. Furthermore, the formation of specific amplicons was evaluated with standard qPCR . We estimated the impact of assay numbers used, template and primer-pool concentrations, annealing-time and temperature on the reproducibility, specificity and efficiency of targeted preamplification. To minimize the amount of formed nonspecific PCR products, several additives were tested. Altogether, our data allow us to provide general recommendations for accurate targeted DNA and cDNA preamplification.
Methods
Cell culture & single-cell collection
All cell lines were cultured at 37°C and 5% CO2. The myxoid liposarcoma cell lines MLS1765-92 and DL221 were cultured in RPMI 1640 GlutaMAX medium supplemented with 5% fetal bovine serum, 50 U/ml penicillin and 50 µg/ml streptomycin (all Life Technologies). MCF-7 cells and experimentally generated cancer-associated fibroblasts Citation[15] were cultured in DMEM medium supplemented with 10% fetal bovine serum, 2 mM L-glutamine and 1% penicillin/streptomycin (all PAA).
For single-cell collection, MCF-7 cultures were washed with 1X PBS, pH 7.4 (Sigma-Aldrich) and enzymatically dissociated with 0.25% Trypsin-EDTA (PAA). Dead cells were removed with the MACS Dead Cell Removal Kit (Miltenyi Biotec) according to the manufacturer’s instructions. Cells were resuspended in 1X PBS, pH 7.4, supplemented with 2% bovine serum albumin (Sigma-Aldrich) and kept at 4°C until sorting. Cell aggregates were removed by filtering through a 35 μm cell strainer (BD Biosciences). Individual cells were sorted into 96-well PCR plates (Life Technologies), containing 5 μl 1 μg/μl bovine serum albumin and 2.5% glycerol (Thermo Scientific) in DNase/RNase-free water (Life Technologies) using a BD FACSAria II (Becton Dickinson) instrument and the FACSDiva software as previously described Citation[16]. Sorted plates were immediately frozen on dry ice and stored at –80°C.
RNA extraction & reverse transcription
Total RNA was extracted from DL221, MLS1765-92 cell lines and experimentally generated cancer-associated fibroblasts using the RNeasy Mini Kit, including DNase treatment (Qiagen). RIN values were determined with the 2100 Bioanalyzer Instrument (Agilent Technologies) and were larger than nine for all RNA samples. Reverse transcription was performed with SuperScript III reverse transcriptase (Life Technologies) Citation[17]. To each sample containing 500–1000 ng total RNA, 0.5 mM dNTPs, 2.5 μM random hexamers and 2.5 μM oligo(dT15) primers (all Sigma-Aldrich) were added to a total volume of 6.5 μl. Samples were incubated at 65°C for 5 min and subsequently cooled on ice. 100 U SuperScript III, 20 U RNaseOUT, 5 mM dithiothreitol, 50 mM Tris-HCl, pH 8.3, 75 mM KCl and 3 mM MgCl2 (all Life Technologies, final concentrations are shown) were added to a final volume of 10 μl. The following temperature profile was applied: 25°C for 5 min, 50°C for 60 min, 55°C for 15 min and 70°C for 15 min. cDNA was diluted to a concentration corresponding to 1 ng/μl with nuclease-free water and stored at –20°C.
Single MCF-7 cell cDNA synthesis was performed using TATAA GrandScript cDNA Synthesis Kit (TATAA Biocenter). Briefly, 2 μl 5X TATAA GrandScript RT Reaction Mix, 0.5 μl TATAA GrandScript RT Enzyme and 2.5 μl water were added to a final volume of 10 μl. The following thermal program was used: 22°C for 5 min, 42°C for 30 min and 85°C for 5 min and samples were stored at –20°C.
PCR assays & quantitative real-time PCR
Quantitative PCR was performed in 6 μl reactions utilizing the 2X TATAA SYBR GrandMaster Mix (TATAA Biocenter), 400 nM of each primer (Sigma-Aldrich) and 2 μl template. PCR assays were designed for 96 human transcripts, applying Primer-BLAST Citation[18]. In silico oligonucleotide secondary structure prediction was performed with NetPrimer (PREMIER Biosoft International). Detailed primer information is provided in (Supplementary Table 1 [supplementary material can be found online at www.informahealthcare.com/suppl/14737159.2015.1057124]). All assays were target specific, highly sensitive and exhibited a high dynamic range and reproducibility Citation[19]. No additional nonspecific PCR products were formed within 45 cycles of amplification. All assays have been applied for single-cell gene expression profiling on different cell types, including fibroblasts, myxoid liposarcoma and breast cancer cell lines (data not shown) as described Citation[12,20]. To test for specificity all PCR products were subjected to melting curve analysis and were further validated by gel electrophoresis. Quantitative PCR was performed in a CFX384 Touch Real-Time PCR Detection System (Bio-Rad), applying the following thermal protocol: 95°C for 2 min, followed by 40 cycles of amplification (95°C for 5 s, 60°C for 20 s and 70°C for 20 s). Melting curve analysis was performed in the range of 60°C to 95°C, 0.5°C per 5 s increments. Cycle of quantification (Cq) values were determined by the second derivative maximum method. Preamplification efficiencies were estimated from standard curves with GenEx (MultiD Analyses). All qPCR experiments were conducted in accordance with the Minimum Information for Publication of Quantitative Real-Time PCR Experiments (MIQE) guidelines Citation[21]. Single-cell data were preprocessed as described Citation[22], and absolute quantification of each cDNA species was performed with known DNA standards Citation[20]. Missing single-cell data were assigned a value of 0.5 cDNA molecules to calculate the geometric mean.
Generation of DNA standards
Reverse transcribed RNA from MLS1765-92, DL221 cells and experimentally generated cancer-associated fibroblasts was used as template in qPCR to generate PCR product standards for all experiments in this study. Specific PCR products were purified with the MinElute PCR Purification Kit (Qiagen) and eluted in EB buffer. DNA concentration was quantified with the Qubit dsDNA HS Assay Kit on the Qubit Fluorometer (Life Technologies) and converted to molecules per microliter Citation[23]. Concentrations of all PCR products were adjusted to 5 × 10⁹ molecules per µl and stored at –20°C.
Targeted DNA preamplification
Preamplification was performed under various experimental conditions: a detailed summary of all tested parameters is shown in . Targeted preamplification was performed in 10 µl reactions, or in 20 μl reactions for MCF-7 single-cells, using 2X TATAA SYBR GrandMaster Mix, 40 nM of each primer and 0.1–2.0 µl template. Identical primer pairs were applied for targeted preamplification and downstream qPCR. One hundred purified DNA molecules of each target sequence were used as template if not stated otherwise. The following thermal profile for targeted preamplification was applied on a T100 Thermal Cycler (Bio-Rad): 95°C for 3 min, followed by 20 cycles of amplification (95°C for 20 s, 60°C for 3 min and 72°C for 20 s). After the final extended (10 min) elongation step, the samples were immediately frozen on dry ice, slowly thawed on ice, diluted 1:20 in 10 mM Tris and 1 mM EDTA, pH 8.0 (Life Technologies) and stored at –20°C until analysis. Individual assay performance was analyzed on the CFX384 Touch Real-Time PCR Detection System or on the BioMark high-throughput qPCR platform (Fluidigm).
To monitor the targeted preamplification reaction in real time, we used SYBR Green I detection chemistry in the CFX384 Touch Real-Time PCR Detection System. The following thermal protocol was used: 95°C for 3 min, followed by 35 cycles of amplification (95°C for 20 s, 60°C for 3 min and 72°C for 20 s). Melting curve analysis was performed in the range of 60°C to 95°C, 0.5°C per 5 s increments. Cq values were determined using a threshold.
Preamplification additives
The effects of 18 different PCR additives on the preamplification reaction were evaluated (final tested concentrations are shown): 7-deaza-2′-deoxyguanosine 5′-triphosphate lithium salt (50 and 100 µM; Sigma-Aldrich), ammonium sulfate (10 and 15 mM; Sigma-Aldrich), betaine (0.25 and 0.50 M; Sigma-Aldrich), bovine serum albumin supplied at 20 mg/ml in 10 mM Tris-HCl, 100 mM KCl, 1 mM EDTA and 50% glycerol (1 and 2 µg/µl; Thermo Scientific), D-(+)-trehalose dehydrate (0.15 and 0.30 M; Sigma-Aldrich), dimethyl sulfoxide (1%; Sigma-Aldrich), dithiothreitol (1.5 and 3.0 mM; Life Technologies), formamide (0.5 M; Sigma-Aldrich), gelatin (0.01 and 0.10%; Sigma-Aldrich), glycerol (2.5 and 5.0%; Sigma-Aldrich), IGEPAL CA-630 (0.25 and 0.50%, Sigma-Aldrich), l-carnitine inner salt (0.25 and 0.50 M; Sigma-Aldrich), GenElute-LPA (50 and 100 ng/µl; Sigma-Aldrich), polyinosinic:polycytidylic acid potassium salt (5 and 50 ng/µl; Sigma-Aldrich), tetramethylammonium chloride (30 and 60 mM; Sigma-Aldrich), Triton X-100 (0.2 and 0.4%; Sigma-Aldrich), TWEEN 20 (0.10 and 0.50%, Sigma-Aldrich) and yeast tRNA (50 and 100 ng/µl, Life Technologies).
High-throughput quantitative real-time PCR
High-throughput qPCR was performed on the BioMark system using the 96.96 Dynamic Array Chip for Gene Expression and EvaGreen-based detection. Each 5 μl sample reaction contained 2 µl diluted preamplification product as template, 2.5 µl SsoFast EvaGreen SuperMix (Bio-Rad), 0.25 µl DNA Binding Dye Sample Loading Reagent (Fluidigm), as well as 0.01 µl ROX (Life Technologies, final concentration in the sample mix was 50 nM) and water. The 5 μl assay reaction mix contained 2.5 µl Assay Loading Reagent (Fluidigm) and 2.5 µl of 10 µM mix of reverse and forward primer. Priming and loading of the dynamic array were performed according to the manufacturer´s instructions using the IFC controller HX. The temperature profile was thermal mixing at 70°C for 40 min and 60°C for 30 s, followed by hot start activation at 95°C for 60 s and 40 cycles of amplification (96°C for 5 s and 60°C for 20 s). Melting curve analysis was performed in the range of 60°C to 95°C at 0.5°C per s increments. Amplification data were analyzed with the Fluidigm Real-Time PCR Analysis software, applying the linear derivative baseline subtraction method and a user-defined global threshold to obtain Cq-values. Melting curve analysis was performed on all the samples.
Results
To study targeted preamplification, we used 96 individually optimized qPCR assays (Supplementary Table 1). To control and monitor the effect of variable numbers of molecules, we generated DNA standards based on PCR products for each assay. Preamplification efficiencies of all 96 multiplexed assays were evaluated with standard curves, ranging from 5 to 5120 DNA molecules, applying optimal run conditions: 40 nM of each primer, 60°C annealing temperature and 3 min annealing time. The overall preamplification efficiency was 101.4% (± 3.5%, 95% confidence) (Supplementary Figure 1). Individual assay efficiencies are provided in Supplementary Table 1. Five of the 96 assays failed in the preamplification reaction.
To investigate the preamplification reaction in detail, we analyzed the performance of the total amount of PCR products formed and each individual assay . Individual assays were evaluated with downstream qPCR after 20 cycles of preamplification, while the overall preamplification performance was monitored over 35 cycles in a real-time qPCR instrument using SYBR Green I detection chemistry. Here, we refer to the latter method as analysis of preamplification. The rationale behind running 35 cycles preamplification was to produce sufficient amount of DNA for melting curve analysis, which allowed us to distinguish between specific and nonspecific PCR products. Applying such large number of cycles drives the reaction beyond its exponential phase, which may alter the ratio of specific to nonspecific PCR products. Still, the analysis of preamplification proved to be the most informative tool providing important insights into the reaction mechanism of targeted preamplification.
The optimal number of preamplification cycles depends on the downstream application, here qPCR. In qPCR, the variation across reaction chambers attributable to the Poisson noise leads to substantial uncertainty in the measured cycle of quantification (Cq). Theoretically, applying the Poisson distribution, with an average of 5 molecules per reaction chamber, we calculate 99.3% probability that a reaction chamber will contain at least one molecule. An average of about 35 molecules per reaction chambers is needed to reduce the variation in Cq due to the Poisson effect below the variation observed for typical qPCR Citation[11,14]. Following preamplification, samples are diluted to inactivate the enzymatic activity still present in the reaction tube and because of the sample loading architecture of high-throughput qPCR platforms. Taking the dilution into account and considering the effect of Poisson noise, we can calculate the number of preamplification cycles required to produce sufficient amount of amplicons for reliable detection and reproducible quantification of the targets in downstream qPCR analysis. Supplementary Figure 2 shows that when starting with a sample containing five target molecules, 19 preamplification cycles are required to generate an average of five molecules per reaction chamber in the BioMark high-throughput qPCR platform assuming a preamplification efficiency of 80%. In this study, our optimized assays displayed a preamplification efficiency of approximately 100%, which results in an average of 36 molecules per reaction chamber (Supplementary Figure 2).
Dependence on target molecule numbers
To assess the dynamic range of preamplification, we performed two experiments . In the first experiment, the initial number of target molecules for six of the assays was 100 each per reaction, while the initial number of target molecules for each of the remaining 90 assays was varied from 0 to 107 per reaction . In the second experiment, the initial number of target molecules for each of the 95 assays was 100 per reaction, and only for one assay (IGF2BP3) the initial amount of target molecules was varied from 100 to 109 per reaction .
Figure 2. Dynamic range of preamplification – the effect of total template concentration. The preamplification dynamic range with six targets at a constant initial concentration, while increasing the amounts of the other 90 targets. Analysis of preamplification: (A) preamplification response curves and corresponding (B) melting curves at six selected conditions. (C) Average Cq ± SD (n = 3) of the six assays kept at a constant initial template concentration of 100 molecules each per reaction. The linear fit is to guide the eye only. (D) Average Cq ± SD (n = 3) of six randomly selected assays from the preamplification with an initial template concentration of 0 to 107 molecules each. The linear fit is to guide the eye only.
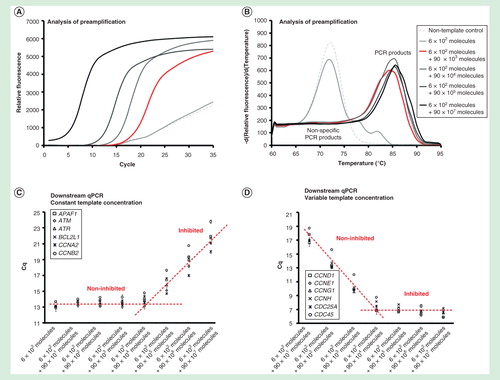
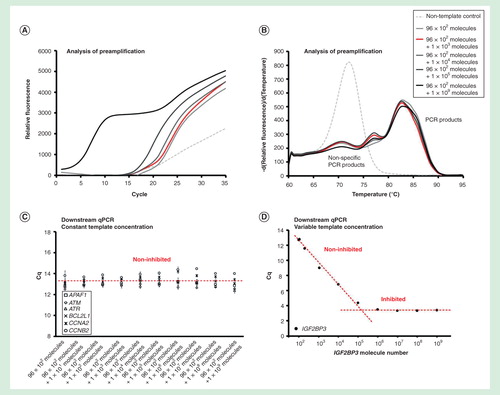
The preamplification was within dynamic range when 90 targets were initially present at <104 molecules of each per reaction, while the other six target templates remained at a constant concentration of 100 molecules per reaction . The preamplification of all assays was inhibited when >104 molecules of each for the 90 targets were added. However, when the target concentration of only one assay was increased, the preamplification of other assays was not affected . The single assay in this experiment was within dynamic range up to about 105 target molecules per reaction. In conclusion, the preamplification dynamic range of an assay was dependent on the amount of its target molecules and on the total number of target molecules for all the preamplification assays.
Figure 3. Dynamic range of preamplification – the effect of one target. The preamplification dynamic range of one assay at variable initial target concentration measured in the background of 95 assays with constant target concentrations. Analysis of preamplification: (A) preamplification response curves and corresponding (B) melting curves at six selected conditions. (C) Average Cq ± SD (n = 3) of six randomly selected assays from the preamplification used at a constant initial concentration of 100 molecules each per reaction. The linear fit is to guide the eye only. (D) Average Cq ± SD (n = 3) of the single assay included in the preamplification with an initial template concentration of 102 to 109 molecules. The linear fit is to guide the eye only.
Dependence on assay numbers
To assess the effect of different assay numbers in the preamplification reaction, we amplified 6, 12, 24, 48 and 96 pooled assays and evaluated the amount of specific and nonspecific PCR products . The total amount of primers increased with increasing assay number, but the primer concentration of each primer was maintained at 40 nM. Analysis of preamplification in shows that the total yield increased with increasing assay numbers. The nontemplate controls, with water replacing target molecules, displayed that also the amount of nonspecific PCR product increased with assay number. The most dramatic effect, ∼1000 fold (∼10 cycles) increase in the amount of nonspecific PCR product formed, was observed when increasing the number of pooled assays from 24 to 48. The amplification curves for the template-containing samples exhibited similar Cq-values as the nontemplate controls when multiplexing 48 or 96 assays, suggesting that specific and nonspecific PCR products were formed at comparable rates. Similar results were obtained with shorter (0.5 min) and longer (8 min) annealing times (Supplementary Figures 3 & 4).
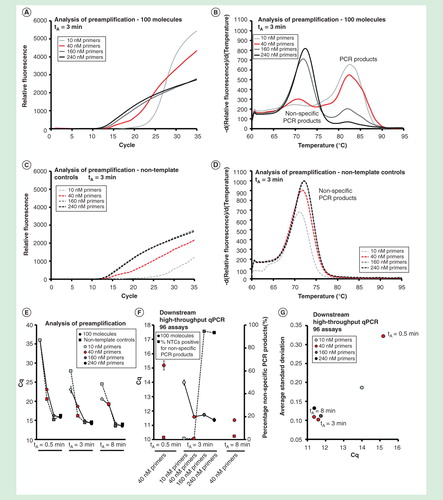
Figure 4. Assay number dependence. The preamplification yield of specific and nonspecific PCR products formed when using 6, 12, 24, 48 and 96 pooled assays. Analysis of preamplification: preamplification response curves and corresponding melting curves for (A, B) positive samples and (C, D) negative controls. Positive samples contained 100 initial molecules of each target. (E) Cq-values (average ± SD) for positive (n = 3) and negative samples (n = 3) using different number of assays in preamplification. (F) High-throughput qPCR data of individual assays. Average Cq ± SD (n = 3) is shown. Data from all preamplified genes were used. (G) Average Cq ± SD (n = 3) of 10 assays included in the preamplification with 12, 24, 48 and 96 pooled assays.
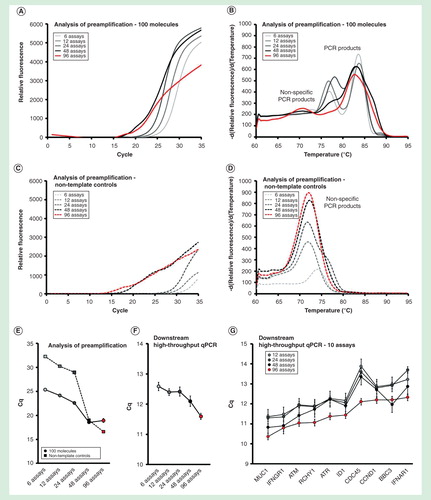
The yields of individual assays in downstream qPCR analysis increased with increasing assays in the primer-pool up to the maximum number of 96 assays tested . In line with these data, the preamplification reproducibility also improved with increasing assay number . In conclusion, individual assays performed best in the preamplification when high numbers of assays were multiplexed.
Dependence on primer concentration & annealing time
Next, we tested the effect of variable primer concentrations (10, 40, 160, 240 nM, final concentration of each primer) and different annealing times (0.5, 3 and 8 min) simultaneously, due to their close inter-relationship in preamplification Supplementary Figure 5). Analysis of preamplification showed that the yields of specific and nonspecific PCR products increased with increasing primer concentration and annealing time . The melting curves of the preamplification products obtained with 3 min annealing revealed a shift from specific to nonspecific PCR product formation when primer concentrations were increased from 40 to 160 nM .
The yields of individual assays in downstream qPCR analysis were also dependent on primer concentration and annealing time . Long annealing times (3 and 8 min) were superior than short (0.5 min), and primer concentrations in the range of 40 to 240 nM outperformed 10 nM. However, at a primer concentration of 40 nM, only a small percentage of the negative controls formed nonspecific PCR products, while at primer concentrations ≥160 nM almost all negative controls did. The preamplification reproducibility was highest at primer concentrations ≥40 nM and annealing times ≥3 min . In conclusion, optimal preamplification was obtained using 40 nM of each primer and 3 min or longer annealing time.
Figure 5. The effect of primer concentration and annealing time. The preamplification yield of specific and nonspecific PCR products formed using different primer concentrations (10, 40, 160 and 240 nM, final individual primer concentrations) and annealing times (0.5, 3 and 8 min). Analysis of preamplification: preamplification response curves and corresponding melting curves for (A, B) positive samples and (C, D) negative controls. Positive samples contained 100 initial molecules of each target. (E) Average Cq ± SD for positive (n = 3) and negative samples (n = 3) using different number of assays in preamplification. (F) High-throughput qPCR data of individual assays. Average Cq ± SD (n = 3) is shown. The right y-axis indicates the percentage of negative controls positive for nonspecific PCR product formation, calculated from the 91 assays performing accurately in the preamplification (ntotal = 273, 3 negative qPCR controls per assay). (G) Average SD of Cq versus average Cq-value for all individual assays.
Dependence on annealing temperature
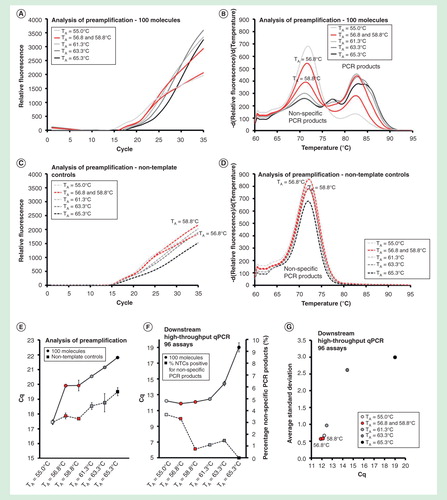
All primers in this study were designed to anneal to their target sequence at 60°C. We evaluated preamplification performance at annealing times ranging from 55.0°C to 65.3°C . Analysis of preamplification revealed that higher annealing temperature decreased the yields of reactions containing template and nontemplate controls . A gradual shift from nonspecific toward specific PCR product formation was observed with increasing annealing temperature . However, even at the highest tested annealing temperature (65.3°C), the relative amount of nonspecific PCR products compared with specific PCR products was maintained.
For downstream qPCR analysis of individual assays, optimal yield was observed at an annealing temperature below 61.3°C, while nonspecific PCR product formation decreased below 2% when the annealing temperature was 58.8°C or higher . Highest reproducibility was obtained using low annealing temperatures . In conclusion, highest yield, specificity and reproducibility in preamplification were obtained at annealing temperatures between 58.8°C and 61.3°C, using assays designed to anneal at 60°C.
Figure 6. The effect of primer annealing temperature. Preamplification yields of specific and nonspecific PCR products formed as function of the annealing temperature used. Annealing temperatures ranged between 55.0 and 65.3°C. Analysis of preamplification: preamplification curves and corresponding melting curves for (A, B) positive samples and (C, D) negative controls. Positive samples contained 100 initial molecules of each target. (E) Average Cq ± SD for positive (n = 3) and negative samples (n = 3) using different annealing temperatures. (F) High-throughput qPCR data of individual assays. Average Cq ± SD (n = 3) is shown. The right y-axis indicates the percentage of negative controls positive for nonspecific PCR product formation, calculated from the 91 assays performing accurately in the preamplification (ntotal = 273, 3 negative qPCR controls per assay). (G) Average SD of Cq versus average Cq-value for all individual assays.
Effect of additives on the formation of nonspecific PCR products
Analysis of preamplification revealed large amounts of nonspecific PCR products being formed under most conditions tested . Therefore, we evaluated the effects of 18 different additives in 35 reaction conditions . We found that 1 and 2 µg/µl bovine serum albumin supplied with 2.5 and 5.0% glycerol, respectively, 5% glycerol, 0.5 M formamide and 0.5 M l-carnitine reduced the formation of nonspecific PCR products by 10 cycles (∼1000-fold) compared with preamplification without additives . As an example, shows preamplification and melting curves generated in the presence of 1 µg/µl bovine serum albumin supplemented with 2.5% glycerol relative to water controls.
Table 1. Summary of analyzed parameters for targeted preamplification.
Figure 7. The effect of additives on preamplification specificity and efficiency. The yield and specificity of preamplification were evaluated at 35 conditions using 18 different additives. Analysis of preamplification: (A, B) preamplification response curves and corresponding melting curves for reactions in the presence of 1-µg/µl bovine serum albumin with 2.5% glycerol or water. (C) Average Cq ± SD for positive (n = 3) and negative samples (n = 3) applying different conditions for preamplification. ΔCq refers to the difference in Cq-values between positive and negative samples for each condition. Conditions are sorted according to ΔCq-value. (F) High-throughput qPCR data of individual assays for nine selected conditions. Average Cq ± SD (n = 3) is shown. The right y-axis indicates the percentage of negative controls positive for nonspecific PCR product formation, calculated from the 91 assays performing accurately in the preamplification (ntotal = 273, 3 negative qPCR controls per assay).
7-deaza-dGTP: 7-deaza-2′-deoxyguanosine 5′-triphosphate lithium salt; BSA: Bovine serum albumin; DMSO: Dimethyl sulfoxide; DTT: Dithiothreitol; LPA: GenElute-LPA; NTC: Non-template control; Poly(I:C): Polyinosinic–polycytidylic acid potassium salt; TMA Cl: Tetramethylammonium chloride.
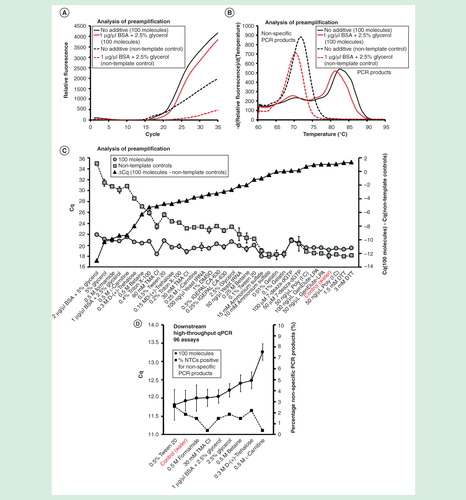
Table 2. Summary of analyzed PCR additives applied for targeted cDNA preamplification.
To further assess the function of additives, we performed 20 cycles of targeted preamplification with nine selected additives, followed by downstream qPCR analysis of the 96 individual assays . Here, preamplification without additives was comparable with preamplification with additives in terms of yield and specificity. Some conditions, especially 0.5 M l-carnitine, not only generated lower amount of nonspecific preamplification products but also decreased yields of specific products. In conclusion, the use of 1 µg/µl bovine serum albumin supplemented with 2.5% glycerol and 0.5 M formamide reduced the amount of nonspecific products formed during preamplification, while maintaining high yield and specificity of each specific qPCR.
Single-cell gene expression profiling using targeted preamplification
Single-cell gene expression profiling usually requires targeted preamplification when more than ten genes are analyzed in downstream qPCR analysis Citation[24]. To demonstrate the use of targeted preamplification in single-cell analysis, we profiled 30 individual MCF-7 cells. Single MCF-7 cells were collected with fluorescence-activated cell sorting, lysed and all RNA were reverse transcribed. Twenty percent of each cDNA sample was used for analysis of preamplification and another 20% was used for 20 cycles of targeted preamplification followed by downstream qPCR analysis . Targeted preamplification for all single-cell analysis was performed with 1 µg/µl bovine serum albumin supplemented with 2.5% glycerol using the primer-pool of all 96 assays. indicate that the amounts of specific PCR products generated from all individual cells were low, but detectable.
Figure 8. Single-cell analysis. Gene expression profiling of 30 individual MCF-7 cells using targeted preamplification. Analysis of preamplification: (A) preamplification curves and corresponding (B) melting curves for reactions in the presence of 1 µg/µl bovine serum albumin and 2.5% glycerol. (C) Dot plots displaying the expression pattern of 10 selected genes.
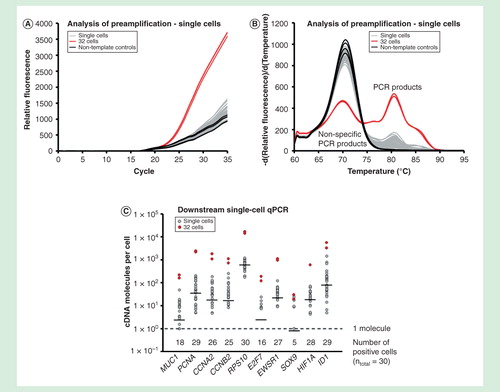
Downstream qPCR analysis allowed us to estimate the number of cDNA molecules per individual MCF-7 cell using the generated DNA standards . As expected, transcripts showed lognormal features among the individual cells Citation[5]. The transcript variability ranged about two orders of magnitude for most genes. For RPS10 with highest geometric mean expression (590 cDNA molecules), the cell with lowest expression contained 180 cDNA molecules, while the cell with highest expression contained 1200 cDNA molecules. The number of cDNA molecules for the lowest expressed gene, SOX9, with geometric mean expression of 0.80 cDNA molecules ranged between 0 and 24.
Discussion
Today, many clinical applications strive toward the use of noninvasive sampling strategies and small biopsies, including fine needle aspirates and even single cells, to detect and quantify biomarkers. Analysis of liquid biopsies, most commonly blood, is an attractive approach to diagnose and monitor patients over time, since sample collection is standardized and associated with low trauma. However, analysis of biomarkers in liquid biopsies is usually indirect, since target molecules associated with the disease do not originate from the sampled liquid itself. For example, circulating tumor cells and circulating cell-free tumor DNA are derived from the primary tumor or metastases and are therefore only present at low concentrations Citation[25,26]. In addition to enumeration, circulating tumor cells also benefit from being analyzed at the molecular level Citation[27]. Analysis of circulating tumor cells and circulating cell-free tumor DNA holds great promises to add value in clinical decisions, but requires highly sensitive, robust and specific technologies Citation[25–27]. The preferred strategy to quantify multiple DNA or cDNA targets in biological samples of limited size is to first preamplify the material, which theoretically allows for the analysis of any target sequence by downstream qPCR or next-generation sequencing. Optimized preamplification protocols typically show high sensitivity, specificity, efficiency, reproducibility and dynamic range. Targeted preamplification is usually conducted as a multiplex PCR, restricting the amplification to the sequences of interest only Citation[9–13]. Multiplex PCR is a highly complex reaction where the simultaneous amplification of many targets may interfere. Here, we have studied several properties of targeted preamplification and their effects on downstream qPCR analysis.
Robust preamplification requires that the reaction is within its dynamic range. On the one hand, we need to generate sufficient numbers of molecules for reliable detection and accurate quantification. On the other hand, we should not cycle the reaction beyond its exponential phase. Highly abundant RNAs, such as 18S, are commonly targeted in gene expression profiling, but their inclusion in preamplification is usually not recommended. However, here we demonstrate that the presence of one target in high concentration does not necessarily affect the quantification of other targets if the primer concentration becomes the limiting factor. For single-cell experiments analyzed on the high-throughput BioMark platform preamplification is usually conducted for 20 cycles Citation[11]. Yet, for samples with higher initial template concentrations fewer cycles should be applied to avoid exiting the exponential phase. Parameters, comprising the dNTP concentration, reaction volume and template concentration, determine the number of preamplification cycles that can be performed and still keep the reaction within its dynamic range. Our experimental data showed that up to ∼106 initial target molecules in total could be accurately preamplified for 20 cycles. In practice, when setting up preamplification for samples of unknown target concentrations, one may initially analyze a few selected, ubiquitously expressed transcripts, such as GAPDH or ACTB, by regular qPCR and based on these data design the preamplification protocol. As presented here, it is also possible to validate the preamplification protocol using a nonspecific reporter such as SYBR Green I and test for appearance of the preamplification response curve and specific product formation by melting curve analysis.
Analysis of highly multiplexed preamplification revealed that large quantities of nonspecific PCR products were formed. This was due to the high total primer concentration and the presence of numerous different primers. Counter-intuitively, the overall performance of individual assays in downstream qPCR analysis improves with increasing number of assays included in the preamplification. This may be explained by the fact that nonspecific PCR products formed during preamplification will only interfere with the downstream singleplex PCR if the particular nonspecific PCR product is complementary to the two primers used in the singleplex PCR. Hence, the larger the number of primers used in the preamplification the larger is the number of possible primer-to-primer interactions that may occur, increasing the amount of aberrant PCR products. However, the probability that the downstream singleplex qPCR is contaminated by carryover of a nonspecific PCR product that is complementary to the primers of that particular qPCR assay decreases as the total number of primers increases.
Primer concentration, temperature and duration of the annealing step are dependent factors in preamplification. To reduce nonspecific PCR product formation in multiplex PCR, the primer concentrations are reduced tenfold for the preamplification compared to normal singleplex PCR. To maintain high preamplification efficiency applying low primer concentration, the annealing time is extended, usually to 3 min or longer. The rationale for this is that primers at lower concentrations need more time to locate to their specific target sequences. All primers applied in this study were designed to have a melting temperature around 60°C. As expected, the preamplification performed best using a similar annealing temperature.
In an attempt to reduce nonspecific PCR product formation, we evaluated the effects of several PCR additives that may improve enzymatic reactions involving nucleic acids . Several of the additives reduced the formation of nonspecific PCR products in preamplification, but did not improve the performance of the individual assays. Most likely, this is because our assays were extensively optimized for high efficiency, specificity and sensitivity. For less optimized assays, or in the context of next-generation sequencing where extensive formation of nonspecific PCR products may steal sequencing capacity and reduce the amount of informative reads, additives such as bovine serum albumin in combination with glycerol or formamide may improve performance.
On the basis of our findings presented here, we provide the following recommendations for accurate targeted preamplification:
The number of preamplification cycles should be sufficient to produce at least five (accurate sensitivity), but preferably 35 (accurate precision), molecules per aliquot used in downstream qPCR.
A few highly abundant targets will not affect the preamplification performance of other assays.
It is advantageous to use a large assay pool in preamplification.
A final individual primer concentration of about 40 nM.
Primer annealing at 60°C for 3 min or longer.
Analyses of limited sample sizes, including rare tissues, liquid biopsies, fine-needle aspirates and single cells are becoming important in numerous research and clinical assessments.
Quantification of small numbers of DNA and RNA molecules usually requires preamplification for accurate analysis by downstream qPCR or next-generation sequencing.
The most common strategy for targeted preamplification is based on multiplex PCR using pools of specific primer pairs, but the properties of the reaction are poorly understood.
The overall performance of target preamplification can be studied in real-time, using SYBR Green I detection chemistry followed by melting curve analysis.
The applied number of preamplification cycles should be sufficient to produce at least five (accurate sensitivity), but preferably 35 (accurate precision), molecules per aliquot used in downstream qPCR.
The amount of initial template molecules, number of assays used, primer concentration, annealing time and annealing temperature are key parameters that influence the sensitivity, specificity, efficiency and reproducibility of targeted preamplification.
Addition of additives, including bovine serum albumin in combination with glycerol or formamide, may improve preamplification by reducing the formation of nonspecific PCR products.
Single-cell gene expression profiling is feasible using qPCR, applying carefully optimized targeted preamplification.
On the basis of experimental data, we are able to provide guidelines how to perform accurate targeted preamplification for downstream applications.
IERO_A_1057124_SM3659.docx
Download MS Word (28.1 KB)IERO_A_1057124_SM3538.docx
Download MS Word (2.4 MB)Acknowledgements
The authors are grateful to S Dolatabadi for primer design and to S Busch for scientific discussion of data.
Financial & competing interests disclosure
A Ståhlberg is supported by the Assar Gabrielssons Research Foundation, LUA/ALF Västra Götaland, Johan Jansson Foundation for Cancer Research, Swedish Cancer Society, Swedish Society for Medical Research, Swedish Research Council, Swedish Society for Medicine, BioCARE National Strategic Research Program at University of Gothenburg, VINNOVA, Wilhelm and Martina Lundgren Foundation for Scientific Research and Åke Winbergs Foundation. A Ståhlberg is a shareholder of the TATAA Biocenter. M Kubista is supported by grants ERDF (LK21305 and BIOCEV CZ.1.05/1.1.00/02.0109), Ministry of Youth, Education and Sports of the Czech Republic (AV0Z50520701). M Kubista is a shareholder and employee of the TATAA Biocenter and MultiD Analyses. G Landberg is supported by the Swedish Research Council, BioCARE National Strategic Research Program at University of Gothenburg, VINNOVA and Swedish Cancer Society. D Svec is supported by the Academy of Science, Czech Republic. D Svec is a shareholder of the TATAA Biocenter. The authors have no other relevant affiliations or financial involvement with any organization or entity with a financial interest in or financial conflict with the subject matter or materials discussed in the manuscript apart from those disclosed.
Notes
References
- Dalerba P, Kalisky T, Sahoo D, et al. Single-cell dissection of transcriptional heterogeneity in human colon tumors. Nat Biotechnol 2011;29(12):1120-7
- Guo G, Huss M, Tong GQ, et al. Resolution of cell fate decisions revealed by single-cell gene expression analysis from zygote to blastocyst. Dev Cell 2010;18(4):675-85
- Norrman K, Strombeck A, Semb H, Stahlberg A. Distinct gene expression signatures in human embryonic stem cells differentiated towards definitive endoderm at single-cell level. Methods 2012;59(1):59-70
- Patel AP, Tirosh I, Trombetta JJ, et al. Single-cell RNA-seq highlights intratumoral heterogeneity in primary glioblastoma. Science 2014;344(6190):1396-401
- Bengtsson M, Stahlberg A, Rorsman P, Kubista M. Gene expression profiling in single cells from the pancreatic islets of Langerhans reveals lognormal distribution of mRNA levels. Genome Res 2005;15(10):1388-92
- Raj A, van Oudenaarden A. Nature, nurture, or chance: stochastic gene expression and its consequences. Cell 2008;135(2):216-26
- Brady G, Barbara M, Iscove NN. Representative in Vitro cDNA Amplification From Individual Hemopoietic Cells and Colonies. Methods Mol Cell Biol 1990;2:17-25
- Eberwine J, Yeh H, Miyashiro K, et al. Analysis of gene expression in single live neurons. Proc Natl Acad Sci USA 1992;89(7):3010-14
- Lao K, Xu NL, Sun YA, et al. Real time PCR profiling of 330 human micro-RNAs. Biotechnol J 2007;2(1):33-5
- Lao K, Xu NL, Yeung V, et al. Multiplexing RT-PCR for the detection of multiple miRNA species in small samples. Biochem Biophys Res Commun 2006;343(1):85-9
- Livak KJ, Wills QF, Tipping AJ, et al. Methods for qPCR gene expression profiling applied to 1440 lymphoblastoid single cells. Methods 2012;59(1):71-9
- Rusnakova V, Honsa P, Dzamba D, et al. Heterogeneity of astrocytes: from development to injury - single cell gene expression. PLoS One 2013;8(8):e69734
- Tang F, Hajkova P, Barton SC, et al. MicroRNA expression profiling of single whole embryonic stem cells. Nucleic Acids Res 2006;34(2):e9
- Stahlberg A, Kubista M. The workflow of single-cell expression profiling using quantitative real-time PCR. Expert Rev Mol Diagn 2014;14(3):323-31
- Kojima Y, Acar A, Eaton EN, et al. Autocrine TGF-beta and stromal cell-derived factor-1 (SDF-1) signaling drives the evolution of tumor-promoting mammary stromal myofibroblasts. Proc Natl Acad Sci USA 2010;107(46):20009-14
- Stahlberg A, Bengtsson M, Hemberg M, Semb H. Quantitative transcription factor analysis of undifferentiated single human embryonic stem cells. Clin Chem 2009;55(12):2162-70
- Stahlberg A, Thomsen C, Ruff D, Aman P. Quantitative PCR analysis of DNA, RNAs, and proteins in the same single cell. Clin Chem 2012;58(12):1682-91
- Ye J, Coulouris G, Zaretskaya I, et al. Primer-BLAST: a tool to design target-specific primers for polymerase chain reaction. BMC Bioinformatics 2012;13:134
- Kubista M, Andrade JM, Bengtsson M, et al. The real-time polymerase chain reaction. Mol Aspects Med 2006;27(2-3):95-125
- Stahlberg A, Andersson D, Aurelius J, et al. Defining cell populations with single-cell gene expression profiling: correlations and identification of astrocyte subpopulations. Nucleic Acids Res 2011;39(4):e24
- Bustin SA, Benes V, Garson JA, et al. The MIQE guidelines: minimum information for publication of quantitative real-time PCR experiments. Clin Chem 2009;55(4):611-22
- Stahlberg A, Rusnakova V, Forootan A, et al. RT-qPCR work-flow for single-cell data analysis. Methods 2013;59(1):80-8
- SciencePrimer.com. Available from: http://scienceprimer.com/copy-number-calculator-for-realtime-pcr
- Stahlberg A, Kubista M, Aman P. Single-cell gene-expression profiling and its potential diagnostic applications. Expert Rev Mol Diagn 2011;11(7):735-40
- Bettegowda C, Sausen M, Leary RJ, et al. Detection of circulating tumor DNA in early- and late-stage human malignancies. Sci Transl Med 2014;6(224):224ra224
- Pantel K, Alix-Panabieres C. Real-time liquid biopsy in cancer patients: fact or fiction? Cancer Res 2013;73(21):6384-8
- Alix-Panabieres C, Pantel K. Challenges in circulating tumour cell research. Nat Rev Cancer 2014;14(9):623-31
- Motz M, Paabo S, Kilger C. Improved cycle sequencing of GC-rich templates by a combination of nucleotide analogs. Biotechniques 2000;29(2):268-70
- Musso M, Bocciardi R, Parodi S, et al. Betaine, dimethyl sulfoxide, and 7-deaza-dGTP, a powerful mixture for amplification of GC-rich DNA sequences. J Mol Diagnost 2006;8(5):544-50
- Olive DM, Simsek M, Al-Mufti S. Polymerase chain reaction assay for detection of human cytomegalovirus. J Clin Microbiol 1989;27(6):1238-42
- Henke W, Herdel K, Jung K, et al. Betaine improves the PCR amplification of GC-rich DNA sequences. Nucleic Acids Res 1997;25(19):3957-8
- Kang J, Lee MS, Gorenstein DG. The enhancement of PCR amplification of a random sequence DNA library by DMSO and betaine: application to in vitro combinatorial selection of aptamers. J Biochem Biophys Methods 2005;64(2):147-51
- Giambernardi TA, Rodeck U, Klebe RJ. Bovine serum albumin reverses inhibition of RT-PCR by melanin. Biotechniques 1998;25(4):564-6
- Nagai M, Yoshida A, Sato N. Additive effects of bovine serum albumin, dithiothreitol, and glycerol on PCR. Biochem Mol Biol Int 1998;44(1):157-63
- Svec D, Andersson D, Pekny M, et al. Direct cell lysis for single-cell gene expression profiling. Front Oncol 2013;3:274
- Spiess AN, Mueller N, Ivell R. Trehalose is a potent PCR enhancer: lowering of DNA melting temperature and thermal stabilization of taq polymerase by the disaccharide trehalose. Clin Chem 2004;50(7):1256-9
- Zhang Z, Kermekchiev MB, Barnes WM. Direct DNA amplification from crude clinical samples using a PCR enhancer cocktail and novel mutants of Taq. J Mol Diagnost 2010;12(2):152-61
- Bookstein R, Lai CC, To H, Lee WH. PCR-based detection of a polymorphic BamHI site in intron 1 of the human retinoblastoma (RB) gene. Nucleic Acids Res 1990;18(6):1666
- Sarkar G, Kapelner S, Sommer SS. Formamide can dramatically improve the specificity of PCR. Nucleic Acids Res 1990;18(24):7465
- Ohler LD, Rose EA. Optimization of long-distance PCR using a transposon-based model system. PCR Methods Appl 1992;2(1):51-9
- Sachdeva R, Simm M. Application of linear polyacrylamide coprecipitation of denatured templates for PCR amplification of ultra-rapidly reannealing DNA. Biotechniques 2011;50(4):217-19
- Cheng S, Fockler C, Barnes WM, Higuchi R. Effective amplification of long targets from cloned inserts and human genomic DNA. Proc Natl Acad Sci USA 1994;91(12):5695-9
- Fortier ME, Kent S, Ashdown H, et al. The viral mimic, polyinosinic:polycytidylic acid, induces fever in rats via an interleukin-1-dependent mechanism. Am J Physiol 2004;287(4):R759-66
- Chevet E, Lemaitre G, Katinka MD. Low concentrations of tetramethylammonium chloride increase yield and specificity of PCR. Nucleic Acids Res 1995;23(16):3343-4
- Kovarova M, Draber P. New specificity and yield enhancer of polymerase chain reactions. Nucleic Acids Res 2000;28(13):E70
- Melchior WBJr, Von Hippel PH. Alteration of the relative stability of dA-dT and dG-dC base pairs in DNA. Proc Natl Acad Sci USA 1973;70(2):298-302
- George S, Sokolenko S, Aucoin MG. Rapid and cost-effective baculovirus sample preparation method as a viable alternative to conventional preparation for quantitative real-time PCR. J Virolog Methods 2012;182;1-2:27-36
- Peper G, Fankhauser A, Merlin T, et al. Direct real-time quantitative PCR for measurement of host-cell residual DNA in therapeutic proteins. J Pharmaceut Biomed Anal 2014;100:123-30
- Wang QT, Xiao W, Mindrinos M, Davis RW. Yeast tRNA as carrier in the isolation of microscale RNA for global amplification and expression profiling. BioTechniques 2002;33(4): 788, 790, 792 passim