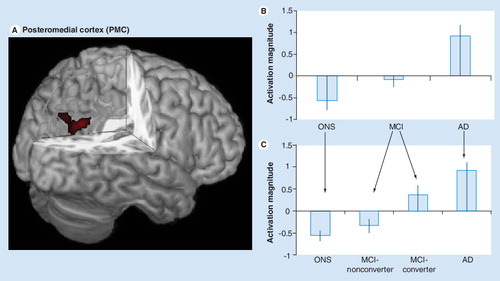
Figure 1. (A) The functional region of interest in the posteromedial cortex (PMC) used in our studies is shown in red and overlaid on a 3D canonical T1-weighted brain template image with posterior cortex cutout. (B) Activation magnitude parameter estimate (with standard error bars) in the PMC region (A). In this region, parameter estimates for activation magnitude demonstrated a lesser-to-greater activation from control (ONS), to MCI to AD subjects. (C) Activation magnitude parameter estimate (with standard error bars) in the PMC region (A), demonstrating a continuum from control (ONS), to MCI-nonconverter, to MCI-converter to AD. There were statistically significant (p < 0.05) differences between all groups with the exception of the control and MCI-nonconverter group, and the AD and MCI-converter group. An overall pattern of negative activation magnitude in the control and MCI-nonconverter groups and positive activation magnitude in the AD and MCI-converter groups is evident.
AD: Alzheimer’s disease; MCI: Mild cognitive impairment; ONS: Older normal subject.
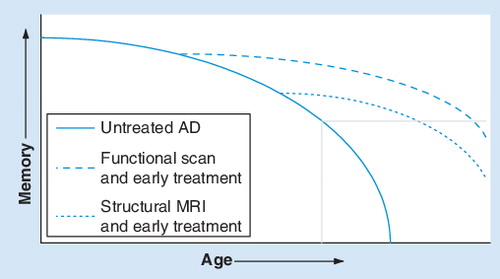
The unbroken line represents the untreated natural progression, the dashed line represents earlier treatment based on structural MRI and the dotted line represents earlier treatment based on functional MRI. The gray box in the bottom right corner represents the onset of AD.
Modified with permission from one provided by Dr Gary Small.
AD: Alzheimer’s disease.
Alzheimer’s disease (AD), a progressive neurodegenerative disorder associated with disruption of neuronal function and gradual deterioration in cognition, function and behavior, is the most common cause of dementia in the elderly, affecting approximately 2–4 million individuals in the USA and more than 30 million worldwide Citation[1,2]. The progression of AD is gradual, with the average patient living 8–10 years after onset of symptoms. With the growth of the older population in developed nations, the prevalence of AD will undoubtedly rise over the next 50 years. The annual cost of the disease in the US alone, including medical, long-term and home care, as well as loss in productivity, is currently estimated at US$100 billion Citation[3]. In addition to the substantial financial burden, the psychological and emotional burden on patients and their families is even greater. Currently, definitive diagnosis of AD requires a postmortem examination of the brain for characteristic plaques and tangles, which effectively form the ‘gold standard’. In the absence of this information, clinical diagnosis of probable AD is based primarily on memory impairment early in the degenerative progression that later expands to multiple cognitive domains Citation[1,4,5].
With the recent availability of several effective pharmaceutical agents for treatment of AD symptoms, along with several new agents undergoing clinical trials, we are entering a new age in the treatment of AD Citation[6]. Current consensus statements have emphasized the need for early recognition; thus, there is an urgent need to develop sensitive markers that may serve as adjuncts to current clinical and neuro-psychological tests to facilitate detection and/or monitoring of early brain changes suggestive of AD. Such markers may also facilitate early-intervention studies to prevent or slow disease progression Citation[1,2]. Conventional structural neuro-imaging, including MRI, has long played a supportive role in the diagnosis of memory disorders and is recommended for the routine evaluation of AD. However, functional imaging modalities that demonstrate physiologic changes in the brain, including PET and functional MRI (fMRI), also have the potential to enable identification of more subtle pathologic changes earlier during the disease course and, therefore, may have equal or greater potential in comparison with structural imaging modalities Citation[1]. Prognostic neuroimaging studies will be beneficial in the search for markers that help to predict future status Citation[7]. The new paradigm in diagnostic screening tools will therefore include testing for genetic, neuropsychological, imaging and vascular risk factors.
This is reflected in a proposal for new diagnostic criteria for probable AD Citation[8], a modification that would require the core criteria of memory impairment plus one or more supportive features. These features include:
| • | The presence of medial temporal lobe (MTL) atrophy | ||||
| • | An abnormal cerebrospinal fluid bio-marker | ||||
| • | A specific pattern on functional neuro-imaging with PET showing reduced glucose metabolism or increased uptake of well-validated amyloid binding ligands | ||||
| • | Familial genetic mutations (presenilin 1 and 2, amyloid precursor protein) | ||||
Measurement of the structural integrity and rate of atrophy in the MTL and its subregions, including the hippocampus Citation[9–11] and entorhinal cortex Citation[12,13], has proven useful as a clinical aid. However, measurement of atrophy in the MTL is currently not standardized (and therefore is susceptible to methodological differences) and MTL atrophy is not unique to AD Citation[14]. Thus, while MTL atrophy may be a useful supportive feature for current diagnosis, it is important to note that structural changes in AD are preceded by cellular changes, including synaptic dysfunction Citation[1]. As such, functional neuroimaging has the potential to elucidate brain changes earlier in the degenerative progress when memory loss is nascent, yet before structural damage has occurred. This is an important consideration for MTL regions because once atrophy has been detected, patients may not be able to achieve the maximum benefit from an intervention.
Functional MRI research has been conducted in AD, mild cognitive impairment (MCI) or otherwise at-risk patients. Studies typically measure increased signal or ‘activation’ from the whole brain, but activation and/or ‘deactivation’ (a reduction in signal) in specific regions may have the most promise for diagnostic purposes. A substantial number of fMRI studies have focused on the MTLs due to the reasons mentioned above. Another region demonstrating early functional abnormalities is located in the posterior midline cortices of the posterior cingulate, precuneus and retrosplenial areas, collectively termed the posteromedial cortex (PMC). Initial PET studies looking at glucose metabolism have reported hypometabolic regions including frontal, temporal, parietal and posterior cingulate cortex in AD and MCI patients compared with control subjects. These regions overlap with those found to be tonically active during rest and are termed the ‘default mode network’ Citation[15–17]. Of these regions, there is evidence Citation[18–21] that strong metabolic differences occurring in the PMC may have diagnostic and predictive value in AD and MCI patients. An intriguing overlap exists between the patterns of hypometabolism observed in resting PET studies and the pattern of increased uptake of amyloid binding ligands Citation[22], which may be worthy of consideration with respect to patient monitoring. This overlap also matches regions found using fMRI that show impaired task-related deactivation Citation[7,23,24] and resting network differences Citation[25,26]. The advantages of fMRI are well known and include its noninvasive nature, greater capacity for longitudinal follow-up owing to the lack of ionizing radiation, and relative ease of use and availability as a clinical technique Citation[1]. Here we discuss the use of fMRI in the diagnosis of AD and AD risk.
MTL activation: powers, pitfalls & possibilities
A preponderance of the literature on memory and brain function focuses on the role of the MTLs. This is due, in large part, to seminal reports of memory loss after hippocampal lesions in humans Citation[27] and animals Citation[28]. Additional evidence from functional neuroimaging studies strongly implicates the structures of the MTL (including the hippocampus, amygdala and parahippocampal gyrus) in mnemonic processes. Neurophysiological and high resolution fMRI studies further suggest that within the MTL, subfields of the hippocampus and parahippocampal gyrus (including the cornu ammonis fields, dentate gyrus, subiculum, entorhinal and perirhinal cortices) may support dissociable aspects of memory (e.g., encoding, retrieval, recollection and familiarity). However, analysis of the function of these substructures with fMRI is limited to imaging centers with advanced technological and computational capability. For the sake of simplicity, we will presently consider the MTL as a generic memory structure.
A number of fMRI studies have linked activation in MTL regions to successful memory formation, maintenance and retrieval across a variety of tasks and stimuli Citation[29,30]. Because memory deficits (both subjective and objective) are used in the neuropsychological assessment of AD and MCI, the MTL is a logical starting place to probe for a potential functional marker of disease. However, the aforementioned structural atrophy in the MTL with progression to AD creates a conundrum of sorts for fMRI studies: alterations in signal between groups may be a result of tissue loss rather than activation strength. Ruling out this possibility requires detailed tracing of anatomical structures within the MTL and extraction of the signal from those regions of interest. This time-consuming process may not be possible in large sample size studies or clinical trials. Finally, for those fMRI studies that do not employ anatomical tracing, there is a risk that the normalization techniques commonly used for group analyses will incorrectly classify tissue as MTL, especially the anterior regions, as the disease further progresses Citation[31].
Nevertheless, a common finding in studies of healthy subjects compared with AD or MCI patients is decreased MTL activation in the patients Citation[25,32–39]. The interpretation is typically that reduced activation in this region corresponds to the memory deficits exhibited by these patients. However, this interpretation is complicated by a number of studies that have found increased MTL activation in MCI patients relative to healthy subjects Citation[37,40–43] as well as healthy older adults at genetic risk for AD versus those not at risk Citation[44,45]. The interpretation of this increased activation, or ‘hyperactivation’, is that early in the progression of AD, there is a period of compensatory brain change, enabling patients to maintain function. This hyperactivation period is then followed by a decrease in activation.
An important caveat of these findings is that the cognitive range of patients and other demographic variables, as well as the specific tasks and analyses used, tend to be unique to each study. For example, family history may interact with APOE status to influence activation Citation[45]. Additionally, measuring the extent of activation as opposed to the magnitude of activation may yield different findings. This problem is compounded by the fact that statistical thresholds in neuroimaging are not standardized and often lowered to investigate the MTL. Regardless of these pitfalls, findings of generalized decrease of MTL function with more severe disease states suggest there is value in fMRI measurements. However, evidence for early phase hyperactivation suggests that the use of MTL activation as a marker of disease progression would be problematic, due to the difficulty in distinguishing MCI patients who are in a ‘declining’ phase from normal patients, as both may show similar levels of activation (inverted U-shape problem).
PMC deactivation: metabolic marker, cognition coordinator
Evidence from PET studies of AD, MCI and normal older adults provides the strongest support for investigation of the PMC (comprised of the precuneus, posterior cingulate, and retrosplenial cortex and spanning Brodmann areas 7, 23, 26, 29, 30 and 31) as a functional marker of disease. The connection between the PMC, the default mode network of the brain, and AD suggests that a fundamental change may occur in patients regarding the transitions between momentary cognitive states. The default mode has been suggested to reflect intrinsic cognitive operations as well as unfocused monitoring of the external environment Citation[46,47]. Increased glucose metabolism occurs in a network of regions consistently identified in resting PET scans Citation[48]. Furthermore, patients in a persistent vegetative state show reduced metabolism in the PMC that returns to nearly normal after the patient recovers consciousness Citation[49]. Finally, in a PET study measuring cerebral blood flow under increasing doses of propofol, a general anesthetic, PMC measures decreased as the anesthetic dose increased. Thus, the PMC is a key node of the default mode network with important connections to the resting physiological state of the brain and the state of consciousness.
A prominent view of the role of this network is that it facilitates the allocation of cognitive resources once a task or environmental focus is introduced by deactivating the tonically active regions. Thus, the greater the deactivation in a region such as the PMC during an active task, the greater the cognitive benefit Citation[50,51]. Alterations in AD and MCI patients in default network regions, including the PMC have been reported using model-free fMRI analyses (independent components analysis and resting connectivity) Citation[26,37,52–54] and by modeling task-dependent deactivation in the brain Citation[7,23,24]. In model-free analyses, ongoing fluctuations in fMRI signal in the PMC are compared, whereas in task-dependent analyses the PMC is deactivated during the task of interest relative to baseline fixation and/or a simpler task.
The consistent observation across these studies is similar to that of the MTL findings: the more severe the disease status, the poorer the response. In our findings across a sample of controls, MCI and AD patients Citation[24], activation level in the PMC, but not the MTL, correlated with performance on the California Verbal Learning Test (CVLT), a standardized neuropsychological memory measure Citation[55]. In terms of PMC activation level, we found robust deactivation in controls, less robust deactivation in MCI and activation in AD patients . In a subsequent analysis of this data, we categorized the MCI patients as ‘nonconverter’ or ‘converter’ to AD, based on longitudinal follow-up visits. PMC activation level from the baseline fMRI scan indicated that nonconverters were more similar to controls, while converters were more similar to AD patients Citation[7]. Another study found ‘hyperdeactivation’ of the PMC in the mildest MCI group Citation[37], relative to controls, conflicting with the overall linear pattern we found. Differences in data analysis and patient samples may account for this discrepancy. Celone et al. used a model to explicitly test for nonlinear group differences. Their overall MCI sample may be less impaired compared with our sample, as it is based on subjective rather than objective assessments of memory impairment. Indeed, the CVLT-delay scores of MCI subjects in our study were substantially worse (mean ± standard deviation = 5.2 ± 2.6) than even the more impaired MCI group (8.3 ± 4.7) in their study. However, further support for the relation between deficient PMC function and increased disease risk comes from a PET study that found hypometabolism in the PMC in cognitively normal young adult subjects at genetic risk (APOE4 homozygotes) for AD Citation[21].
Similar to the findings of PMC hypometabolism in PET, perfusion arterial spin labeling (ASL) MRI has also recently demonstrated differential hypoperfusion in MCI Citation[56,57]. Because the output of ASL perfusion is similar to the absolute values of cerebral blood flow obtained in PET studies, this technique is also likely to provide promising biomarkers and further insight into the earliest neural changes associated with AD. Together, these findings from PET and MRI studies raise the intriguing prospect that the PMC is a zone of confluence for metabolic and functional disturbances, and pathological effects found in AD and MCI. If indeed the PMC displays consistent and reliable effects based on well-studied physiological changes, this region may ultimately prove to be the more suitable fMRI marker for diagnostic purposes.
Future perspective
The ultimate goal of using new technology for diagnosis of dementia is not to replace other techniques, but to add to the consistency and reliability of established indicators across a spectrum of tests. In the case of AD and MCI, neuropsychological and structural imaging evaluation, and occasionally PET metabolic markers (typically to rule out other dementia variants) are the most common tests employed today in screening and follow-up of patients with, or at risk for, AD. We believe that in the future, diagnostic testing and treatment monitoring will also take advantage of quantitative structural, pathologic and physiologic imaging, including PET imaging with amyloid- and tau-binding radioligands, and MRI with BOLD-fMRI, diffusion tensor imaging, and ASL-perfusion, as well as genetic markers such as presenilin, APP, APOE4 and SORL1.
Functional MRI techniques typically rely on the use of tasks and cognitive subtraction principles. Factors such as the stimuli, presentation timing and performance during these tasks can greatly influence imaging results and subsequent interpretation. Therefore, a standardized and simple task with normative data, which could be implemented at MRI facilities worldwide, would be of great service to the field, enabling multicenter studies, large clinical trials and powerful meta-analyses. In the absence of such a task, probing resting or default networks may have an immediate advantage over task-based fMRI. Patients do not need any instructions (beyond ‘eyes open’ or ‘eyes closed’), no stimuli need to be presented and the typical duration is only 5 min (plus 5 min for a high resolution structural scan). These advantages over task-based fMRI greatly increase the likelihood of patient compliance and multicenter studies. Furthermore, examination of spontaneous activity via fluctuations in fMRI may provide more fundamental insights into intrinsically correlated brain networks and may be more tightly linked to electrophysiological measurements of coherence and neuronal synchrony Citation[58,59].
A practical implementation we envision is a task and/or resting fMRI exam which would yield a ‘score’ for the PMC and other brain regions. The patient’s score can then be referenced to a normative range (spanning from healthy older adults through to fully progressed AD), placing them along a continuum, similar to other medical assessments (e.g., growth charts used for infants and blood chemistry ranges). This score, in addition to structural, genetic and neuropsychological information, will be used to more accurately formulate a personal risk profile to assess diagnostic status, treatment potential and need for patient monitoring ( illustrates a schematic of the role of functional imaging). Currently, secondary prevention in conversion from MCI to AD is a more realistic target, as primary prevention in cognitively normal at-risk patients is more problematic owing to potential hyperactivation in patients with genetic AD risk and the mildest MCI. Longitudinal studies will help to isolate the specific patterns associated with increased risk.
Although we have highlighted the investigation of specific brain regions, it is most likely that investigation of complete brain networks will most thoroughly explain changes associated with AD. The strength of connectivity between the PMC and the MTL may prove to be another useful metric Citation[52,53] for clinical purposes. As we have previously hypothesized Citation[7,24], under-lying changes in behavior may be a result of functional and/or structural disconnection of PMC/MTL circuitry. It is possible that disruption of MTL regions results in both the metabolic and functional differences observed in the PMC. Assessing the disruption of such a functional circuit, with the fullest array of tools possible, will yield remarkable new insights into AD. As we stand at the threshold of a new era of functional circuit imaging in AD, we predict significant contributions will be made to both diagnosis and treatment of this debilitating disease.
Acknowledgements
The authors would like to thank Caroline Hellegers for work contributing to results presented in this paper. We also wish to recognize the profoundly important contributions of all the volunteers/participants in our own, and other scientific research projects investigating Alzheimer’s disease.
Financial & competing interests disclosure
P Murali Doraiswamy has received research grant support and/or honoraria for consulting or speaking from several pharmaceutical or diagnostic companies and owns equity in Sonexa Therapeutics. Duke University and P Murali Doraiswamy hold a use patent for an unrelated treatment indication in children; that patent is unlicensed and he derives no income from it. Jeffrey Petrella has received research support from Eisai/Pfizer and AVID Radiopharmaceuticals for pilot studies. Steven Prince and Shoshana Woo have no conflicts to disclose.
The authors have no other relevant affiliations or financial involvement with any organization or entity with a financial interest in or financial conflict with the subject matter or materials discussed in the manuscript apart from those disclosed.
No writing assistance was utilized in the production of this manuscript.
References
- Petrella JR, Coleman RE, Doraiswamy PM. Neuroimaging and early diagnosis of Alzheimer disease: a look to the future. Radiology226, 315–336 (2003).
- Doraiswamy PM. Interventions for mild cognitive impairment and Alzheimer disease: new strategies, new hope. Am. J. Geriatr. Psychiatr.11, 120–122 (2003).
- Small GW, Rabins PV, Barry PP et al. Diagnosis and treatment of Alzheimer disease and related disorders. Consensus statement of the American Association for Geriatric Psychiatry, the Alzheimer’s Association, and the American Geriatrics Society. JAMA278, 1363–1371 (1997).
- McKhann G, Drachman D, Folstein M, Katzman R, Price D, Stadlan EM. Clinical diagnosis of Alzheimer’s disease: report of the NINCDS-ADRDA work group under the auspices of Department of Health and Human Services Task Force on Alzheimer’s disease. Neurology34, 939–944 (1984).
- Petersen RC. Aging, mild cognitive impairment, and Alzheimer’s disease. Neurol. Clin.18, 789–806 (2000).
- Doraiswamy PM, Xiong GL. Pharmacological strategies for the prevention of Alzheimer’s disease. Expert Opin. Pharmacother.7, 1–10 (2006).
- Petrella JR, Prince SE, Wang L, Hellegers C, Doraiswamy PM. Prognostic value of posteromedial cortex deactivation in mild cognitive impairment. PLoS ONE2, E1104 (2007).
- Dubois B, Feldman HH, Jacova C et al. Research criteria for the diagnosis of Alzheimer’s disease: revising the NINCDS-ADRDA criteria. Lancet Neurol.6, 734–746 (2007).
- Jack CR Jr, Petersen RC, O’Brien PC, Tangalos EG. MR-based hippocampal volumetry in the diagnosis of Alzheimer’s disease. Neurology42, 183–188 (1992).
- Jack CR Jr, Petersen RC, Xu Y et al. Rates of hippocampal atrophy correlate with change in clinical status in aging and AD. Neurology55, 484–489 (2000).
- de Leon MJ, Convit A, George AE et al.In vivo structural studies of the hippocampus in normal aging and in incipient Alzheimer’s disease. Ann. NY Acad. Sci.777, 1–13 (1996).
- De Toledo-Morrell L, Goncharova I, Dickerson B, Wilson RS, Bennett DA. From healthy aging to early Alzheimer’s disease: in vivo detection of entorhinal cortex atrophy. Ann. NY Acad. Sci.911, 240–253 (2000).
- Du AT, Schuff N, Zhu XP et al. Atrophy rates of entorhinal cortex in AD and normal aging. Neurology60, 481–486 (2003).
- Ramani A, Jensen JH, Helpern JA. Quantitative MR imaging in Alzheimer disease. Radiology241, 26–44 (2006).
- Gusnard DA, Raichle ME. Searching for a baseline: functional imaging and the resting human brain. Nat. Rev. Neurosci.2, 685–694 (2001).
- Raichle ME, Gusnard DA. Appraising the brain’s energy budget. Proc. Natl Acad. Sci. USA99, 10237–10239 (2002).
- Raichle ME, MacLeod AM, Snyder AZ, Powers WJ, Gusnard DA, Shulman GL. A default mode of brain function. Proc. Natl Acad. Sci. USA98, 676–682 (2001).
- Minoshima S, Frey KA, Koeppe RA, Foster NL, Kuhl DE. A diagnostic approach in Alzheimer’s disease using three-dimensional stereotactic surface projections of fluorine-18-FDG PET. J. Nucl. Med.36, 1238–1248 (1995).
- Minoshima S, Giordani B, Berent S, Frey KA, Foster NL, Kuhl DE. Metabolic reduction in the posterior cingulate cortex in very early Alzheimer’s disease. Ann. Neurol.42, 85–94 (1997).
- Alexander GE, Chen K, Pietrini P, Rapoport SI, Reiman EM. Longitudinal PET evaluation of cerebral metabolic decline in dementia: a potential outcome measure in alzheimer’s disease treatment studies. Am. J. Psychiatr.159, 738–745 (2002).
- Reiman EM, Chen K, Alexander GE et al. Correlations between apolipoprotein E epsilon4 gene dose and brain-imaging measurements of regional hypometabolism. Proc. Natl Acad. Sci. USA102, 8299–8302 (2005).
- Buckner RL, Snyder AZ, Shannon BJ et al. Molecular, structural, and functional characterization of Alzheimer’s disease: evidence for a relationship between default activity, amyloid, and memory. J. Neurosci.25, 7709–7717 (2005).
- Lustig C, Snyder AZ, Bhakta M et al. Functional deactivations: change with age and dementia of the Alzheimer type. Proc. Natl Acad. Sci. USA100, 14504–14509 (2003).
- Petrella JR, Wang L, Krishnan S et al. Cortical deactivation in mild cognitive impairment: high-field-strength functional MR imaging. Radiology245, 224–235 (2007).
- Greicius MD, Srivastava G, Reiss AL, Menon V. Default-mode network activity distinguishes Alzheimer’s disease from healthy aging: evidence from functional MRI. Proc. Natl Acad. Sci. USA101, 4637–4642 (2004).
- Rombouts SA, Barkhof F, Goekoop R, Stam CJ, Scheltens P. Altered resting state networks in mild cognitive impairment and mild Alzheimer’s disease: an fMRI study. Hum. Brain Mapp.26, 231–239 (2005).
- Scoville WB, Milner B. Loss of recent memory after bilateral hippocampal lesions. J. Neurochem.20, 11–21 (1957).
- Zola-Morgan S, Squire LR, Mishkin M. The neuroanatomy of amnesia: amygdala-hippocampus versus temporal stem. Science218, 1337–1339 (1982).
- Prince SE, Daselaar SM, Cabeza R. Neural correlates of relational memory: successful encoding and retrieval of semantic and perceptual associations. J. Neurosci.25, 1203–1210 (2005).
- Ranganath C, D’Esposito M. Medial temporal lobe activity associated with active maintenance of novel information. Neuron31, 865–873 (2001).
- Krishnan S, Slavin MJ, Tran TT, Doraiswamy PM, Petrella JR. Accuracy of spatial normalization of the hippocampus: implications for fMRI research in memory disorders. Neuroimage31, 560–571 (2006).
- Rombouts SA, Barkhof F, Veltman DJ et al. Functional MR imaging in Alzheimer’s disease during memory encoding. AJNR Am. J. Neuroradiol.21, 1869–1875 (2000).
- Johnson SC, Schmitz TW, Moritz CH et al. Activation of brain regions vulnerable to Alzheimer’s disease: the effect of mild cognitive impairment. Neurobiol. Aging27, 1604–1612 (2006).
- Petrella JR, Krishnan S, Slavin MJ, Tran TT, Murty L, Doraiswamy PM. Mild cognitive impairment: evaluation with 4-T functional MR imaging. Radiology240, 177–186 (2006).
- Johnson SC, Baxter LC, Susskind-Wilder L, Connor DJ, Sabbagh MN, Caselli RJ. Hippocampal adaptation to face repetition in healthy elderly and mild cognitive impairment. Neuropsychologia42, 980–989 (2004).
- Sperling RA, Bates JF, Chua EF et al. fMRI studies of associative encoding in young and elderly controls and mild Alzheimer’s disease. J. Neurol. Neurosurg. Psychiatr.74, 44–50 (2003).
- Celone KA, Calhoun VD, Dickerson BC et al. Alterations in memory networks in mild cognitive impairment and Alzheimer’s disease: an independent component analysis. J. Neurosci.26, 10222–10231 (2006).
- Machulda MM, Ward HA, Borowski B et al. Comparison of memory fMRI response among normal, MCI, and Alzheimer’s patients. Neurology61, 500–506 (2003).
- Pariente J, Cole S, Henson R et al. Alzheimer’s patients engage an alternative network during a memory task. Ann. Neurol.58, 870–879 (2005).
- Kircher T, Weis S, Freymann K et al. Hippocampal activation in MCI patients is necessary for successful memory encoding. J. Neurol. Neurosurg. Psychiatr.78(8), 812–818 (2007).
- Dickerson BC, Salat DH, Bates JF et al. Medial temporal lobe function and structure in mild cognitive impairment. Ann. Neurol.56, 27–35 (2004).
- Dickerson BC, Salat DH, Greve DN et al. Increased hippocampal activation in mild cognitive impairment compared to normal aging and AD. Neurology65, 404–411 (2005).
- Hämäläinen A, Pihlajamäki M, Tanila H et al. Increased fMRI responses during encoding in mild cognitive impairment. Neurobiol. Aging28(12), 1889–1903 (2006).
- Bookheimer SY, Strojwas MH, Cohen MS et al. Patterns of brain activation in people at risk for Alzheimer’s disease. N. Engl. J. Med.343, 450–456 (2000).
- Johnson SC, Schmitz TW, Trivedi MA et al. The influence of Alzheimer disease family history and apolipoprotein E epsilon4 on mesial temporal lobe activation. J. Neurosci.26, 6069–6076 (2006).
- Mason MF, Norton MI, Van Horn JD, Wegner DM, Grafton ST, Macrae CN. Wandering minds: the default network and stimulus-independent thought. Science315, 393–395 (2007).
- Gusnard DA, Raichle ME, Raichle ME. Searching for a baseline: functional imaging and the resting human brain. Nat. Rev. Neurosci.2, 685–694 (2001).
- Mazoyer B, Zago L, Mellet E et al. Cortical networks for working memory and executive functions sustain the conscious resting state in man. Brain Res. Bull.54, 287–298 (2001).
- Laureys S, Lemaire C, Maquet P, Phillips C, Franck G. Cerebral metabolism during vegetative state and after recovery to consciousness. J. Neurol. Neurosurg. Psychiatr.67, 121 (1999).
- Daselaar SM, Prince SE, Cabeza R. When less means more: deactivations during encoding that predict subsequent memory. Neuroimage23, 921–927 (2004).
- McKiernan KA, Kaufman JN, Kucera-Thompson J, Binder JR. A parametric manipulation of factors affecting task-induced deactivation in functional neuroimaging. J. Cogn. Neurosci.15, 394–408 (2003).
- Sorg C, Riedl V, Muhlau M et al. Selective changes of resting-state networks in individuals at risk for Alzheimer’s disease. Proc. Natl Acad. Sci. USA104, 18760–18765 (2007).
- Wang L, Zang Y, He Y et al. Changes in hippocampal connectivity in the early stages of Alzheimer’s disease: evidence from resting state fMRI. Neuroimage31, 496–504 (2006).
- Greicius MD, Krasnow B, Reiss AL, Menon V. Functional connectivity in the resting brain: a network analysis of the default mode hypothesis. Proc. Natl Acad. Sci. USA100, 253–258 (2003).
- Delis D, Kramer J, Kaplan E, Ober B. The California Verbal Learning Test–Research Edition. Psychological Corp., NY, USA (1987).
- Xu G, Antuono PG, Jones J et al. Perfusion fMRI detects deficits in regional CBF during memory-encoding tasks in MCI subjects. Neurology69, 1650–1656 (2007).
- Du AT, Jahng GH, Hayasaka S et al. Hypoperfusion in frontotemporal dementia and Alzheimer disease by arterial spin labeling MRI. Neurology67, 1215–1220 (2006).
- Fox MD, Raichle ME. Spontaneous fluctuations in brain activity observed with functional magnetic resonance imaging. Nat. Rev. Neurosci.8, 700–711 (2007).
- Fox MD, Snyder AZ, Vincent JL, Corbetta M, Van Essen DC, Raichle ME. The human brain is intrinsically organized into dynamic, anticorrelated functional networks. Proc. Natl Acad. Sci. USA102, 9673–9678 (2005).