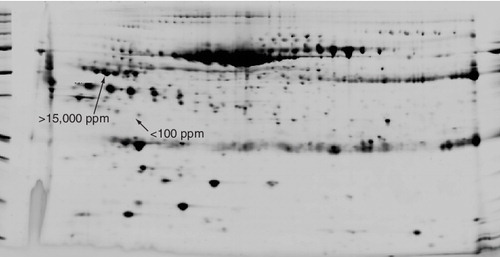
The dynamic range and reproducibility of quantitative 2D gel electrophoresis of human blood serum. More than 1500 protein spots are resolved and quantitated within the 2D gel pattern of human blood serum. Typical quantities, ranging from <100 to >15,000 ppm, are indicated to demonstrate the dynamic range (black arrows).
Disease-specific discrimination was accomplished using both canonical discriminant analysis (top) and linear discriminant analysis (bottom), showing discrimination between patients with AD, PD and ALS (A) and patients with AD, AD-like and normal controls (B).
AD: Alzheimer’s disease; ALS: Amyotrophic lateral sclerosis; PD: Parkinson’s disease. Data from Citation[14,15].
![Figure 2. Differential diagnostics through multivariate biostatistics of blood serum concentrations of groups of proteins using quantitative 2D gel electrophoresis.Disease-specific discrimination was accomplished using both canonical discriminant analysis (top) and linear discriminant analysis (bottom), showing discrimination between patients with AD, PD and ALS (A) and patients with AD, AD-like and normal controls (B).AD: Alzheimer’s disease; ALS: Amyotrophic lateral sclerosis; PD: Parkinson’s disease. Data from Citation[14,15].](/cms/asset/0ad55026-dda3-4249-aa54-f4086edc4bf1/ieru_a_11217009_f0002_b.jpg)
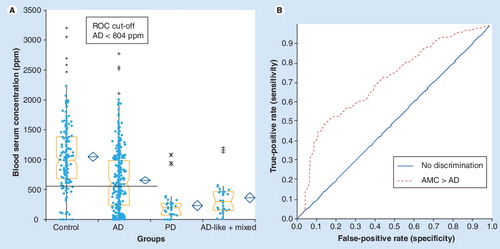
(A) Box and whiskers quantitative level and (B) capability of differentiation between AD and AMC.
AD: Alzheimer’s disease; AMC: Age-matched controls; PD: Parkinson’s disease; ROC: Receiver operator characteristics.
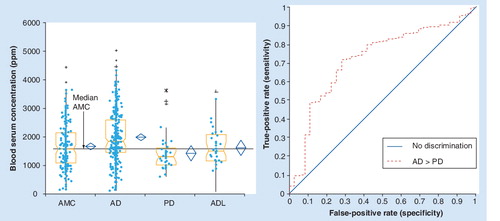
(A) Box and whiskers quantitative level and (B) capability of differentiation between AD and PD.
AD: Alzheimer’s disease; ADL: AD-like and mixed; AMC: Age-matched controls; PD: Parkinson’s disease.
Unbiased proteomic discovery
In 1927, the great Danish physicist Niels Bohr proposed that some natural phenomena can only be completely understood by combining two or more experimental approaches that cannot be simultaneously implemented. His student, Max Delbrück, applied this ‘principal of complementarity’ to biology, indicating that a full understanding of the role of biological molecules, such as proteins, requires the study of how they behave with other proteins, but at the level of the whole living organism.
Unbiased clinical proteomics operates from this uniquely comprehensive perspective, beginning with the patient. An unbiased monitoring of patient proteomes for disease-related changes provides results that have broad and deep implications that liberate a new paradigm to unlock the power of personalized medicine. Upfront we are seeking changes in proteins that can be monitored in a live patient (e.g., in blood serum) as biomarkers for diagnosis, differential diagnosis, patient monitoring, for selection of treatment options, and for new drug target discovery.
My first exposure to an unbiased approach to proteomics started early in 1972, when I was being recruited as a ‘post-doc’ into the ‘Nuclear Protein Group’ in the laboratory of the late Dr Harris Busch, MD, PhD, Professor and Chairman of Pharmacology at Baylor College of Medicine (BCM). Dr Busch took me up to an empty shell that was the seventh floor of the Jewish Institute for Medical Research at BCM and said “This is where we will put the Nuclear Protein Laboratory, where we will find proteins that are the keys to cancer.”
In the ensuing years, under Dr Busch’s relentless leadership and focus, the group, also including Mark OJ Olson, Larry R Orrick, Lynn C Yeoman, Charles Taylor, Raghu Ballal, S-I Matsui, Larry Roth-blum, PK Chan, Mariana Yaneva, Egon Durban, Ierach Daskal and others, applied unbiased proteomics, using 2D gel electrophoresis, to what would now be referred to as the cell nucleolar and cell nuclear proteomes Citation[1–3]. I was blessed to be a part of this effort and to recieve the benefit of their expertise for my project, which became the discovery, identification and sequencing of the first, previously unknown, cancer-related nuclear protein, using the proteomic technology of 2D gel electrophoresis: protein A24, the first known ubiquitin conjugate, monoubiquitinated histone H2A Citation[4–8].
The discovery and biochemical characterization of protein A24 in 1973–1978 took place well before the human genome project, personal computers and the internet. In those days, protein characterization was slow, the sensitivity of detection was low, and concentrations of identified proteins in 2D gels were semiquantitative and nonlinear. All of this has changed now. The plethora of publications from models and clinical studies, and the extensive genomic, proteomic and publication databases, as well as advanced internet search tools, have greatly accelerated the identification of proteins, and have provided unprecedented access to the clinical and mechanistic implications of the proteomic changes identified in patients. The need to put all this information together has given birth to the new disciplines of bio-informatics, systems biology and pathway analysis. Matching proteomic results with available information from clinical and preclinical studies appears an overwhelmingly complex task. However, with the unbiased proteomics of blood, all of this is now achievable.
With appropriate quality controls in place, consistent and statistically significant differences in the concentration of certain groups of proteins in the blood of patients and age-matched normal and disease controls, can reflect meaningful indicators of disease processes. These indications are useful for patient diagnosis, differential diagnosis and monitoring, rising to the level of the principal of complementarity and the level of the whole organism, the human being and disease.
Why 2D gels?
2D gel electrophoresis has been used in research laboratories for biomarker discovery since the 1970s Citation[1–12]. In the past, this method was considered highly specialized, labor-intensive and nonreproducible.
Now, however, the reproducibility of 2D gel technology has been markedly enhanced and its applicability expanded by advanced raw materials, equipment and software, and by biochemical processing, digital image analysis, biostatistical protocols and quality control. We are now applying these improved technologies from discovery through clinical validation, so that data can ultimately be suitable for regulatory submission Citation[101].
For unbiased proteomics, 2D gel electrophoresis is the best approach. There are few comparable alternatives to 2D gel electrophoresis for tracking changes in protein expression patterns related to disease. 2D gel electrophoresis provides separation of unique intact protein species to detect changes in protein expression and to discriminate protein isoforms that arise due to variations in amino acid sequence and/or postsynthetic protein modifications, such as phosphorylation, ubiquitination, conjugation with ubiquitin-like proteins, acetylation, glycosylation and proteolytic processing. These are important variables in regulatory processes. Different isoforms, splice variants, post-translational modifications and precursor processing variations can indicate alternative disease processes are at work in the patient.
The protein biomarkers must be sufficiently characterized to avoid the pitfalls of protein isoform differences. It is critical to know which protein molecular entity is the actual biomarker. This is a major caveat that underscores the advantages of the level of intact protein fractionation that 2D gel electrophoresis can provide.
Our experience at Power3 indicates that quantitative 2D gel electrophoresis can provide the required quality of information. Repetitive analysis of protein spots over the dynamic range of the assay using standard blood serum samples clearly indicates that the analytical process is reproducible and robust & . In 2006–2007, we published results of our initial application of the new paradigm, in which we interpreted an unbiased proteomic comparison by quantitative 2D gel electrophoresis of blood serum from patients with sporadic Lou Gehrig’s disease (sporadic amyotrophic lateral sclerosis [sALS]), familial ALS (fALS), Parkinson’s disease (PD), Alzheimer’s disease (AD) and AD-like dementias Citation[13–15]. I will use some of Power3 Medical’s results to illustrate the concept that unbiased proteomic results from the blood serum of patients and control subjects relate to the results of preclinical and clinical studies. I will also try to uncover disease mechanisms as identified in patients, being measured and monitored by the proteomic results.
Using well-accepted multivariate biostatistical analysis methods with blood serum concentrations of groups of specific protein biomarkers, which we had identified as particularly useful, we consistently distinguished between patients with AD, ALS, PD and neurodegenerative diseases with similar symptoms to AD (AD-like). Clinical diagnostic quality sensitivities and specificities are obtained & Citation[13–15].
Shifting the paradigm: permission to connect the dots
Given this aggregate experience, when biomarker proteins are fully characterized, can one assert that in a patients blood, these quantitative protein differences reflect the disease processes that these proteins are known to be involved in? Our own experience at Power3 indicates that we can. The following examples underscore the usefulness of the quantitative and qualitative information that 2D gel electrophoresis is designed to provide.
Biomarker N7: isoform-specific differences between Alzheimer’s & Parkinson’s diseases
It is particularly important to validate results of multivariate biostatistics with individual biomarker statistics in order to ensure that the multivariate results arise from statistically significant individual differences. Using well-accepted single-variable biostatistics, we also found consistent differences in blood serum concentrations of individual biomarkers, reflecting the utility of the biomarkers in multivariate analysis when they are combined , .
As illustrated in and , biomarker protein N7 is elevated in blood serum concentrations in AD above age-matched normal controls, whereas it is not changed in AD-like and mixed dementias, and is decreased in the blood serum concentration of PD patients.
On the other hand, the same PD patients’ samples show no difference from age-matched controls in the blood serum concentration of another isoform of this same protein, an isoform that is also revealed by 2D gel electrophoresis.
Sporadic & familial ALS: different effects on biomarker phosphorylation isoforms N1 & N2
Two blood serum proteins, biomarkers N1 and N2, are separated by 2D gel electrophoresis in the isoelectric focusing first dimension, but not in the SDS second dimension Citation[13,14]. Biomarkers N1 and N2 have the same amino acid sequence. The N1 protein is tyrosine phosphorylated whereas N2 is not Citation[13]. Based upon what is known about the mechanisms these proteins are involved in Citation[16–26], elevation of N1 phospho-protein concentration in blood serum indicates increased auto-immune inflammation, whereas elevation of N2 protein blood serum concentration indicates increased innate inflammation Citation[13–15]. In sALS, the N1 phosphoprotein is elevated in blood serum concentration over age-matched normal controls, whereas the N2 protein is decreased Citation[13,14]. In fALS, the N1 protein is also elevated in blood serum (to a lesser extent than in sALS) and an equal elevation of N2 in fALS is also noted Citation[13,14]. These differences make perfect sense because ALS patient serum samples contain antimotor neuron antibodies Citation[27–29] and fALS is caused by mutant mitochondrial proteins (e.g., superoxide dismutase) that induce intraneuronal cell mitochondrial leakage, leading to intracellular oxidative stress, apoptosis and inflammation Citation[30–32]. Similar considerations regadring these two proteins along with the quantitative pattern of other biomarkers help distinguish between AD versus PD versus AD-like and PD-like diseases Citation[14,15,33–36].
Summary remarks
Unbiased proteomics of blood serum can tell us what disease pathways and mechanisms of neuronal degeneration are active in the patients. For single protein biomarkers, we have illustrated statistically significant differences in blood-serum concentrations between patients with AD, ALS, PD, AD-like diseases and age-matched normal controls, as well as differences between familial and sALS. The theme is neurodegeneration and the variations are the different mechanisms through which it is acheived: oxidative stress, apoptosis, autoimmune, acquired and innate inflammation, and others. The blood reflects all this and more. Furthermore, employing multiple protein biomarker combinations, and with additional blood serum proteins brought into the analysis, we have also demonstrated that the disease-specific differences have joint capabilities for sensitive and specific differential diagnosis, implying that disease-specific mechanistic differences measured by blood serum proteomics will ultimately lead to differential treatment and personalized medicine (Box 1).
Box 1. Benefits of blood serum proteomics.
The examples illustrate how blood serum proteomics:
| • | Provides a relational perspective from the patients to functional, preclinical and clinical studies of genomic and proteomic biomarkers. | ||||
| • | Enables differential diagnostic and disease-specific mechanism discrimination between: – Similar diseases (e.g., Alzheimer’s disease vs Lou Gehrig’s disease vs Parkinson’s disease; Alzheimer’s disease vs Alzheimer’s disease-like vs Parkinson’s disease, vs age-matched normal) – Sporadic and familial disease subcategories (e.g., sporadic Lou Gehrig’s disease vs familial Lou Gehrig’s disease) – Disease mechanisms (e.g., oxidative stress, apoptosis, and autoimmune and innate inflammatory mechanisms of neuronal degeneration) | ||||
| • | Provides the type of information that can be employed in the monitoring of patients for: – Potential drug response – Disease severity and progression – Potential new drug targets | ||||
| • | Will ultimately lead to personalized medicine. | ||||
Acknowledgements
I wish to thank the team at Power3 Medical Products, including Steven B Rash, Essam Sheta, Jennifer Bryson, Silvia Quintero, Linh Rivera, Jaffer Khalil, Suhare Khalil, Irina Strelets, Anna Szymanska and Antoinette Gattuso, whose dedicated efforts and skills made it possible to write this article. This editorial is dedicated to the memory of Dr Harris Busch.
Financial & competing interests disclosure
The author is an officer and director of Power3 Medical Products, Inc as disclosed in the Company’s filings with the US Securities and Exchange Commission. He is also an inventor of several patents pending assigned to the company. The author has no other relevant affiliations or financial involvement with any organization or entity with a financial interest in or financial conflict with the subject matter or materials discussed in the manuscript. This includes employment, consultancies, honoraria, stock ownership or options, expert testimony, grants or patents received or pending, or royalties.
No writing assistance was utilized in the production of this manuscript.
References
- Orrick LR, Olson MOJ, Busch H. Comparison of the nucleolar proteins of normal rat liver and Novikoff hepatoma ascites cells by two-dimensional polyacrylamide gel electrophoresis Proc. Natl Acad. Sci. USA70(5), 1316–1320 (1973).
- Yeoman LC, Taylor CW, Busch H. Two-dimensional polyacrylamide gel electrophoresis of chromatin proteins of normal rat liver and Novikoff hepatoma ascites cellos. Biochem. Biophys. Res. Commun.51(4), 956–966 (1975).
- Ballal NR, Goldknopf IL, Goldberg DA, Busch H. The dynamic state of liver nucleolar proteins as reflected by their changes during administration of thioacetamide. Life Sci.14, 1835–1845 (1974).
- Goldknopf IL, Taylor CW, Baum RM et al. Isolation and characterization of Protein A24, a “histone-like” non-histone chromosomal protein. J. Biol. Chem.250, 7182–7187 (1974).
- Goldknopf IL, Busch H. Remarkable similarities of peptide fingerprints of Histone 2A and nonhistone chromosomal protein A24. Biochem. Biophys. Res. Commun.65, 951–960 (1975).
- Olson MOJ, Goldknopf IL, Guetzow KA et al. The NH2- and COOH-terminal amino acid sequence of nuclear protein A24. J. Biol. Chem.251, 5901–5903 (1976).
- Goldknopf IL, Busch H. Isopeptide linkage between nonhistone and Histone 2A polypeptides of chromosomal conjugate protein A24. Proc. Natl Acad. Sci. USA74, 864–868 (1977).
- Goldknopf IL, French MF, Musso R, Busch H. Presence of protein A24 in rat liver nucleosomes. Proc. Natl Acad. Sci. USA74, 5492–5495 (1977).
- Margolis J, Kenrick KG. 2-dimensional resolution of plasma proteins by a combination of polyacrylamide disc and gradient gel electrophoresis. Nature221, 1056–1057 (1969).
- Anderson L, Anderson NG. High-resolution two-dimensional electrophoresis of human plasma proteins. Proc. Natl Acad. Sci. USA74(12), 5421–5425 (1977).
- Klose J. Protein mapping by combined isoelectric focusing and electrophoresis of mouse tissues. A novel approach to testing for point mutations in mammals. Humangenetik26, 231–243 (1975)
- O’Farrell PH. High resolution two-dimensional electrophoresis of proteins J. Biol. Chem.250(10), 4007–4021 (1975).
- Goldknopf IL, Sheta EA, Bryson J et al. Complement C3 and related protein biomarkers in amyotrophic lateral sclerosis and Parkinson’s disease. Biochem. Biophys. Res. Commun.342, 1034–1039 (2006).
- Sheta EA, Appel SH, Goldknopf IL. 2D gel blood serum biomarkers reveal differential clinical proteomics of the neurodegenerative diseases. Expert Rev. Proteomics3, 45–62 (2006).
- Goldknopf IL. Molecular diagnostics and proteomics on the outskirts of personalized medicine. Expert Rev. Mol. Diagn.7, 339–343 (2007).
- Ekdahl CT, Claasen J-H, Bonde S et al. Inflammation is detrimental for neurogenesis in adult brain. Proc. Natl Acad. Sci. USA100(23), 13632–13637 (2003).
- McGeer PL, McGeer EG. Inflammation and the degenerative diseases of aging. Ann. NY Acad. Sci.1035, 104–116 (2004).
- Licastro F, Candore G, Domenico L et al. Innate immunity and inflammation in ageing: a key for understanding age related diseases. Immun. Ageing2(8) 1–14 (2005).
- Town T, Nikolic V, Tan J. The microglial ‘activation’ continuum: from innate to adaptive responses. J. Neuroinflam.2(24), 1–10 (2005).
- Giunta S. Is inflammaging an auto [innate] immunity subclinical syndrome? Immun. Ageing3(12), 1–2 (2006).
- Forsberg PO, Martin SC, Nilsson B et al. In vitro phosphorylation of human complement factor C3 by protein kinase A and protein kinase C. Effects on the classical and alternative pathways. J. Biol. Chem.265(5), 2941–2946 (1990).
- Ekdahl KN, Nilsson B. Phosphorylation of complement component C3 and C3 fragments by a human platelet protein kinase. Inhibition of factor I mediated cleavage of C3b. J. Immunol.154(12), 6502–6510 (1995).
- Nilsson Eckdahl K, Nilsson B. Phosphorylation of complement component C3 after synthesis in U937 cells by a putative protein kinase, casein kinase 2, which is regulated by CD11b: evidence that membrane-bound proteases preferentially cleave phosphorylated C3. Biochem J.328(2), 625–633 (1997).
- Finehout EJ, Franck Z, Lee KH. Complement protein isoforms in CSF as possible biomarkers for neurodegenerative disease. Dis. Markers21(2), 93–101 (2005).
- Ballock DA, Woulfe J, Sur M et al. Hippocampal damage in mouse and human forms of systemic autoimmune disease. Hippocampus14(5), 649–661 (2004).
- Sidor MM, Sakic B, Malinowski PM et al. Elevated immunoglobulin levels in the cerebrospinal fluid from lupus-prone mice. J. Neuroimmunology165(1–2), 104–113 (2005).
- Annunziata P, Volpi N. High levels of C3c in the cerebrospinal fluid from amyotrophic lateral sclerosis patients. Acta Neurol. Scand.72, 61–64 (1985).
- Kawamata T, Akiyama H, Yamada T, McGeer PL. Immunologic reactions in amyotrophic lateral sclerosis brain and spinal cord tissue. Am. J. Pathol.140691–707 (1992).
- Alexianu ME, Kosovska M. Appel SH. Immune reactivity in a mouse model of familial ALS correlates with disease progression. Neurology57, 1282–1289 (2001).
- Orrell RW, Habgood JJ, Gardiner I et al. Clinical and functional investigation of 10 missense mutations and a novel frame shift insertion mutation of the gene for copper–zinc superoxide dismutase in UK families with amyotrophic lateral sclerosis. Neurology48, 746–751 (1997).
- Shaw CE, Enayat ZR, Chioza BA et al. Mutations in all five exons of SOD-1 may cause ALS. Ann. Neurol.43, 390–394 (1998).
- Siddique T, Figlewicz DA, Pericak-Vance MA et al. Linkage of a gene causing familial amyotrophic lateral sclerosis to chromosome 21 and evidence of genetic-locus heterogeneity. N. Engl. J. Med.324, 1381–1384 (1991).
- Yao Y, Chinnici C, Tang H et al. Brain inflammation and oxidative stress in a transgenic mouse model of Alzheimer’s-like brain amyloidosis. J. Neuroinflammation1(21), 1–9 (2004).
- He Y, Lee WD, Appel SH. Role of FCγ receptors in nigral cell injury induced by Parkinson’s disease immunoglobulin injection into mouse substantia nigra. Exp. Neurol.176, 322–327 (2002).
- Orr CF, Rowe DB, Mizuno Y et al. Possible role for humoral immunity in the pathogenesis of Parkinson’s disease. Brain128, 2665–2674 (2005).
- Huber VC, Mondal T, Factor SA et al. Serum antibodies from Parkinson’s disease patients react with neuronal membrane proteins from a mouse dopaminergic cell line and effect dopamine expression. J. Neuroinflammation3(1), 1–9 (2006).
Website
- Guidance for industry and FDA staff: pharmacogenomic tests and genetic tests for heritable markers www.fda.gov/cdrh/oivd/guidance/1549.pdf