Abstract
Single protein biomarkers measured with antibody-based affinity assays are the basis of molecular diagnostics in clinical practice today. There is great hope in discovering new protein biomarkers and combinations of protein biomarkers for advancing medicine through monitoring health, diagnosing disease, guiding treatment, and developing new therapeutics. The goal of high-content proteomics is to unlock protein biomarker discovery by measuring many (thousands) or all (∼23,000) proteins in the human proteome in an unbiased, data-driven approach. High-content proteomics has proven technically difficult due to the diversity of proteins, the complexity of relevant biological samples, such as blood and tissue, and large concentration ranges (in the order of 1012 in blood). Mass spectrometry and affinity methods based on antibodies have dominated approaches to high-content proteomics. For technical reasons, neither has achieved adequate simultaneous performance and high-content. Here we review antibody-based protein measurement, multiplexed antibody-based protein measurement, and limitations of antibodies for high-content proteomics due to their inherent cross-reactivity. Finally, we review a new affinity-based proteomic technology developed from the ground up to solve the problem of high content with high sensitivity and specificity. Based on a new generation of slow off-rate modified aptamers (SOMAmers), this technology is unlocking biomarker discovery.
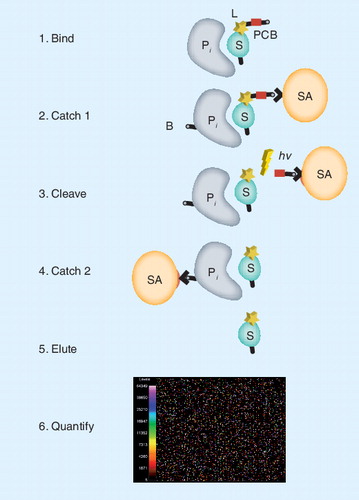
(Step 1) The specific protein to be measured (P i) binds tightly to its cognate SOMAmer binding molecule (S), which includes a PCB and fluorescent label (L) at the 5´ end. (Step 2) Bound protein–SOMAmer complexes are captured onto streptavidin coated beads (SA) by PCB on the SOMAmer. Unbound proteins are washed away. Bound proteins are tagged with biotin (B). (Step 3) The PCB is cleaved by UV light (hn) and the protein-SOMAmer complexes are released into solution. (Step 4) The protein–SOMAmer complexes are captured onto SA and the SOMAmers are eluted into solution (Step 5) and recovered for quantification in Step 6, hybridization to a custom DNA microarray. Each probe spot contains DNA with sequence complementary to a specific SOMAmer, and the fluorescent intensity of each probe spot is proportional to the amount of SOMAmer recovered, which is proportional to the amount of protein present in the original sample.
PCB: Photo-cleavable biotin; SOMAmer: Slow off-rate modified aptamer.
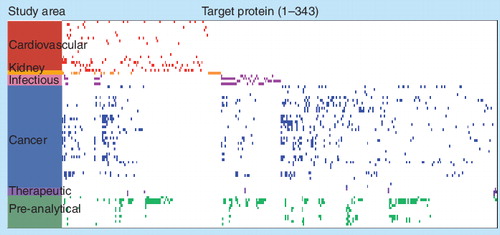
Each row represents one of 77 statistical comparisons of clinical serum or plasma samples (disease and matched controls) that address specific clinical questions in the study area indicated. Each column represents a unique protein measured with the SOMAscan proteomics discovery platform. A colored rectangle represents a potential biomarker for the respective comparison that met the following criteria in the statistical comparison: Kalmagorov–Smirnov (KS) test distance >0.3, KS test p-value < 0.01, KS distance rank in top 25 (highest), and p-value rank in top 25 (lowest). Ties in ranking were allowed, so more than 25 preliminary biomarkers are possible for each comparison. The map shows 334 of approximately 850 possible protein targets measured. The other approximately 500 proteins were not identified as potential biomarkers in the 77 experiments.
SOMAscan: Slow off-rate modified aptamers scan.
Human biology is complex and surprising. When the details of a single biochemical pathway are studied, nuances emerge. The integration of biochemical pathways within a single human cell type is beyond us Citation[1], and the integration of those cell types into the biochemical human remains even further away. Then there is the brain, biology’s ‘dark matter’. Clearly, we have a long way to go.
However, people are sick today and so we must diagnose and treat disease. Molecular diagnostics is a field of great promise, in part because one can measure molecules and correlate the appearance or concentrations of molecules with health and disease even when one does not (fully) understand the biochemical significance of the correlation. The goal of modern molecular diagnostics is to provide actionable information to physicians, patients, and families. Our view, shared by most people in the diagnostics community, is that the fundamental missing pieces in diagnostic science are good biomarkers.
Molecular diagnostics can utilize many approaches. One approach might be to image a tissue in vivo by scanning with a detectable (labeled) monoclonal antibody, while another might be to scan pathology slices with monoclonal antibodies or specific nucleic acid probes. Another approach might be to quantify mRNAs in tissue Citation[2–7] or miRNAs in blood using quantitative PCR or common hybridization platforms Citation[4,7–11]. Frequently, we measure specific protein molecules in blood (e.g., human chorionic gonadotropin, prostate-specific antigen [PSA], cancer antigen 125) because basic research found correlations with pregnancy or disease. Antibody-based measurements have been developed successfully for single analytes (see later); however, as we have published previously and discuss below, antibodies do not work well at high array content Citation[12]. This applies to both planar arrays (referred to as ‘arrays’ throughout this article, unless otherwise specified) or so-called ‘suspension arrays’, both of which are discussed later. The identification of new protein biomarkers is best served by unbiased discovery with high-content proteomics, and is thus limited, together with antibody-based approaches, to the extent that the content remains limited. Unfortunately, single analytes rarely provide actionable information. Biomarkers are almost certainly going to be measured in panels because most medical conditions will not provide a single biomarker that is completely sensitive and specific for a disease (the way human chorionic gonadotropin provides a nearly perfect biomarker for pregnancy). Thus, biomarker discovery must have an empirical component to identify appropriate panels, and that component is the subject of much research (proteomic arrays) and the subject of this article.
For most molecular biologists, the molecules one would measure as correlates with disease would be proteins. While others have jumped to nucleic acid measurements because technology platforms allowed this transition, mRNA levels correlate poorly with protein levels Citation[13–18]. Much has been written about noncoding RNAs and the likelihood that they are involved directly in complex regulation of human gene expression Citation[18–22]; we must await the final word on the functions of the many RNAs found in cells. In bacteria, many important noncoding RNAs have been discovered by Ron Breaker and his colleagues Citation[23,24]. There exists already a rich and emerging literature for RNA measurements in humans, both in blood and in tissue Citation[8,9,25–28]; if correlations are robust, molecular diagnostics will be agnostic as to the nature of the surrogate molecules we measure. To be clear, mRNA correlates with disease are just as useful as protein correlates for diagnosing and treating a patient.
However, we prefer protein biomarkers because they are immediately instructive about biology. Humans encode approximately 23,000 protein genes Citation[29] and, with splice variants and post-translational modifications, the total number of different proteins is approximately 100,000. The question for proteomics has been “How do we know what to measure?” One answer would be to wait for solutions to that problem from the basic research community, while another might be to open up proteomics with a platform akin to hybridization arrays for nucleic acids Citation[30–32] or NexGen sequencing Citation[30,33]. Arrays have changed the way biology research is done, as seen when one reads what Thomas Goetz wrote Citation[34] about Google founder Sergey Brin; “…Brin is proposing to bypass centuries of scientific epistemology in favor of a more Googley kind of science. He wants to collect data first, then hypothesize and then find patterns that lead to answers.” For the many years that many of the authors served on various study sections, the most common objection to a grant was that the proposed work was not hypothesis driven. We imagine that Sergey Brin loses little sleep over his knowledge that he could not have procured an NIH grant!
Brin’s point is well taken, but it is not necessarily a new idea. As David Glass recently put it, modern science (especially biomedical science) has lived under an intellectual tyranny of the hypothesis and a ‘critical rationalist’ framework, which “has been accused of being: inconsistent on philosophical grounds; unworkable for modern ‘large science,’ such as systems biology; inconsistent with the actual goals of experimental science, which is verification and not falsification; and harmful to the process of discovery as a practical matter” Citation[35]. Glass suggests that most modern scientists pay lip service to the hypothesis in order to get money and publish papers, but practice a scientific method based on the question (as opposed to the hypothesis) as a framework for experimentation and building models. Real science is more open-ended and hypothesis-free than we might admit.
Big science, from super-colliders to the human genome project and beyond, always shows a shift to a large-scale, data-driven framework that is often free of hypotheses Citation[35–37]. Funding agencies, such as the NIH and the National Science Foundation, justify this kind of science as hypothesis generating. One might imagine that the transition from hypothesis-driven experimentation to omics is a transition away from thought Citation[38]. We, like Arthur Lander and Sergey Brin, find intense data (and models from those data) invaluable when thinking about biology.
In this article, we review an aspect of this paradigm shift in biomarker discovery – from hypothesis-based (small plex) protein measurements to high-quality unbiased (discovery plex) protein measurements, for the purpose of developing molecular diagnostics. In addition to describing a platform that works well, we will also describe some of the applications already in sight. At the end of this article, we will mention improvements to the proteomic platforms that would be of value.
This article focuses on reagent-dependent proteomics. Reagent-free proteomics has been possible since Pat O’Farrel’s work on 2D gels in the 1970s Citation[39]. Since then, the proteomics field has invested heavily in mass spectrometry (MS) as the reagent-free proteomics technology of choice. MS has yet to reach adequate sensitivity measuring proteins in complex matrices such as blood, and thus might identify useful biomarkers only occasionally Citation[40,41]. MS technology has been extensively reviewed elsewhere Citation[41,42].
Historical protein measurements
Measuring proteins in solution has been a feature of biochemistry since proteins were first characterized. After World War II, two techniques took advantage of the specificity of antibodies to measure proteins through antigen–antibody-specific interaction. The first was a tube immunodiffusion technique, developed by Jacques Oudin at the Institute Pasteur in Paris Citation[43]. Antibody was embedded in a soft gel and the gel was overlaid with sources of antigen in a liquid phase. When diffusion of the two components yielded a sufficiently high concentration of both, a precipitate formed. This was visible and stable and allowed photographic archiving of results. Ouchterlony, 2 years later, developed his plate double diffusion technique Citation[44,45]. In this technique, a series of holes are cut into a gel plate. Usually, antibodies are placed in center wells and sources of antigens in holes surrounding the antibody well. As the antigen and antibody diffuse toward each other, a precipitate forms when a sufficiently high concentration of each has accumulated at an interface. This technique also allows for small numbers of different antibodies to be probed on the same plate, and different epitopes can often be distinguished. This technique allowed for semi-quantification and was the major method for determining specific proteins in body fluids until the early 1960s.
Insulin was measured through the radio-immune assay (RIA) of Yallow and Berson, which took advantage of the fact that guinea pig antibodies to beef insulin were sufficiently cross-reactive with human insulin to allow competitive binding Citation[46]. The resulting RIA method became the standard for measuring specific proteins during the 1960s and beyond.
Subsequently, antigens and antibodies were linked to enzyme molecules that could cause a color change of a small substrate after binding and washing Citation[47–49]; two techniques, known as the enzyme immunoassay and ELISA, evolved. The work of vanWeeman and Schuurs measured chorionic gonadotrophin in human urine using an antigen coupled by glutaraldehyde to horseradish peroxidase Citation[50]. The ELISA format was developed by Eva Engvall, a student in the laboratory of Peter Perlmann at Stockholm University. They combined RIA, enzyme labeling of antibodies, and coating of plastic with proteins to do their analysis Citation[51]. Since then, ELISA, especially with the development of the sandwich assay to get the specificity of two independent epitopes on the same protein (or two identical epitopes on a multivalent protein), has been the standard assay format for the detection of proteins with high sensitivity.
Antibody multiplexing strategies
Two broad approaches have used multiplex antibody-based measurements to increase the content of proteomic measurements. Both approaches have been pushed hard to multiplex antibody-based measurements. One approach is the planar array analogous to DNA microarray. Another approach is solution-based multiplexed suspension arrays, such as Luminex and Illumina technologies, which use suspended particles that are coded for identification in place of solid planar supports. In the following sections we discuss specific common approaches that have been used.
Single antibody arrays
Single antibody non-sandwich arrays are an obvious avenue to multiplexed proteomics. Pat Brown’s laboratory at Stanford (CA, USA) was an early advocate of printed antibody arrays and two-color comparative fluorescence assays Citation[52], following their success with DNA microarrays Citation[31,32]. In the ensuing 10 years, there has been a large effort to develop single antibody array technology. Recent examples include a similar two-color approach with larger spotted arrays (810 antibodies) Citation[53] and lovely work from Carl Borrebaeck’s laboratory in Sweden, who have published excellent reviews of the technology Citation[54,55]. In a recent paper, Proteomics and diagnostics: let’s get specific, again, we reviewed the central issue of specificity for scaling proteomic technologies to deliver on the promise of high analyte density, sensitivity, and specificity Citation[12]. Arrays of hundreds of printed single antibodies (antibody-capture arrays) are currently commercially available, but are limited to the sensitivity and specificity of a single antibody and suffer from cross-reactivity Citation[12,54,55]. It is not possible, even with the very best monoclonals antibodies, to reliably measure intended analytes with single-non-sandwich reagents.
Sandwich antibody arrays
In sandwich ELISAs, the standard way to measure proteins has been to use a capture antibody, if possible a monoclonal antibody, to capture proteins, and then to use a secondary antibody, usually a polyclonal, to a second epitope on the captured protein. Often a third antibody (labeled with an enzyme) is used to detect the bound secondary antibody; through the use of a small-molecule substrate that provides a colorimetric or chemiluminescent signal. There are many variations of this technique, but the essential components are a capture antibody and a detection antibody (or antibody–enzyme conjugate or pair). The detection antibody, is in fact, used for both detection and specificity.
It has become apparent that the ELISA sandwich format is very difficult to adapt to a multiplexed assay in which one wants to measure hundreds to thousands of proteins simultaneously. First, the requirement that the capture antibodies be adsorbed to a solid surface has eliminated most solid surfaces as possible supports. Some surfaces tend to denature antibodies, and those that do not tend to have high background binding for serum proteins Citation[56]. Even when a suitable surface is found, the requirement for two antibodies to two different epitopes on each protein has led to two large barriers for multiplexing more than 20–40 proteins at a time. One barrier is practical and one is theoretical. The practical barrier is the time and money required to get two monoclonal antibodies to each analyte for measurement. The way around such an expense is the slightly easier search for compatible existing monoclonal–polyclonal pairs. But here the theoretical barrier is seen. Polyclonal antibodies will invariably cross-react with other proteins bound to capture antibodies, even if they are monoclonal capture antibodies. In fact, much time and expense has gone into trying to mix and match antibodies for multiplexed ELISA sandwich assays, and approximately 40 appears to be the limit that one can achieve without the specificity breaking down Citation[57].
In sandwich-format arrays, the problem of cross-reactivity is amplified and limits the size and performance of the arrays Citation[12,58]. An example of the challenge posed by antibody arrays comes from Agilent Technologies (CA, USA), who worked hard to develop antibody arrays following their successful inkjet DNA array technology. The published data reports the development, performance and results from an antibody sandwich array of 75 proteins Citation[58]. The authors state, “As the number of antibodies increases, the potential for antibody or antigen cross-reactivity also rises. We addressed this by doing extensive quality control experiments for each new antigen and antibody pair that was added to the arrays … In general we found that the feature background signals increased as the number of antibodies in the detection mixture increased, but we found the feature background signals to be manageable with careful selection of antibody reagents.” The Agilent experience mirrors exactly the experience of Molecular Staging, as described (for smaller arrays of sandwich assays) a few years earlier Citation[57].
Fredriksson et al. developed a variation of the antibody sandwich assay that uses proximity ligation and quantitative PCR for readout Citation[59]. The assay achieved low femtomolar and a five-log linear range for six analytes in a multiplexed liquid-phase format, which cleverly alleviates some problems associated with solid-phase ELISAs. The authors discuss the challenges of expanding to larger multiplex arrays, including the availability of appropriate antibodies, antibody cross-reactivity, and compatible array formats. That is, the intrinsic difficulties in gaining suitable specificity for proteomic measurements remain – the large range of protein concentrations in biological matrices, 12 logs, is at the heart of the problem Citation[60]. We conclude that an exponential amount of work is required to overcome the exponential problem of noise.
Sandwich suspension arrays
The sandwich assay has been adapted to suspended particles (beads) that are coded for the purpose of multiplexing. Examples include Illumina and Luminex technologies. Suspension array formats have overcome the problems inherent with solid planar supports discussed earlier, but they still face the fundamental problem of cross-reactivity faced by all multiplexed antibody sandwich formats. We use these bead-based technologies in our laboratories, and we have experience with commercial suspension array proteomic analysis. Targeted suspension arrays with relatively modest content have been constructed to discover or refine biomarkers in clinical studies. For example, Domenici et al. present a thorough plasma protein biomarker discovery study of depression and schizophrenia where they measured 79 proteins in plasma (using more than one sub-array) through a commercial Luminex assay service and discovered a handful of potential biomarkers Citation[61]. In another example, Kim et al. refined a clinical biomarker study of breast cancer by developing a focused Luminex panel to measure 35 proteins identified initially in a very large study with 2D gels, MS, single ELISAs, and literature searches Citation[62]. The authors multiplexed 23 of the 35 assays and the remaining 12 assays were run singly due to cross-reactivity. Both studies are examples of targeted biomarker discovery.
In a recent development of suspension-based sandwich assays, Rissen et al. of Quanterix Corp. (MA, USA) reported digital ELISA technology, a single-molecule ELISA format that can measure serum proteins (PSA and TNF-α) at sub-femtomolar concentrations using bead array technology Citation[63]. The reported format is for single analytes using an array with approximately 50,000 microwells (∼50 fl volume). Presumably, the technology could be multiplexed with one array per analyte. In the case of PSA, the authors measured the equivalent of 1 fM serum concentration using 25 µl of serum.
ELISA was invented over 50 years ago, and yet we still need a way to measure hundreds to thousands of proteins with detection agents that can be used simultaneously in small volumes of blood.
Unbiased protein measurements
Slow off-rate modified aptamers
For more than 10 years, we have worked to build a human proteomics platform that has the performance of individual ELISA assays (high specificity, low limits of detection and high measurement precision), and also has high complexity so that protein biomarkers could be discovered through the Brin paradigm.
In 1990 two key papers described aptamers Citation[64,65]. Aptamers, identified through the process of Systematic Evolution of Ligands by Exponential Enrichment (SELEX), are the equivalent of monoclonal antibodies, except that they are made of nucleic acids (RNA, DNA or modified nucleic acids). Aptamers bind native confirmations in contrast to antibodies, which often bind linear epitopes. Aptamers are an alternative class of reagents to use for highly multiplexed protein measurements Citation[12,64,66–73]. Approximately 10 years ago, the entire literature for aptamers may have included the identification of (classic) aptamers for 100 proteins. A goal was set at SomaLogic (CO, USA): aptamers (good enough to measure proteins in complex matrices) would be generated against a large number of human proteins, and an assay platform would be developed that would allow ELISA-like performance without sandwiches Citation[12,66,74]. The goal at SomaLogic, while correct with regards to the problem of deep multiplexing, was difficult to reach.
The problems intrinsic to the use of a single binding reagent to quantify a human protein in, for example, plasma or serum, have been described Citation[12,41]. The core of the problem is that dependence only on one reagent in the face of 12 logs of abundance differences between proteins in blood Citation[60] asks more of equilibrium binding than is possible Citation[12,66]. Thus, we had to develop a platform that used novel (and better) aptamers, that had low equilibrium binding constants (e.g., dissociation equilibrium constants [Kds] below 1 nM) but that also allowed a nonequilibrium parameter to provide another element of specificity Citation[70,71,75].
The papers of John Hopfield were important in the evolution of what we call slow off-rate modified aptamers (SOMAmers), second-generation aptamers up to the task of multiplexed protein measurements Citation[76,77]. Hopfield understood that equilibrium could not be sufficient to prevent errors during protein synthesis and thus recognized (correctly) that kinetic proof-reading might solve the accuracy problem. He proposed that if one separated equilibrium binding into two distinct steps (with GTP hydrolysis the event that kept the two steps separate, unlinked), one could use the accuracy of a particular binding reaction twice.
Photoaptamers might have provided a cross-linking step that was the equivalent of Hopfield’s post-GTP hydrolysis kinetic proofreading. For a variety of reasons that include collisions between reactive photo-activated aptamers and random proteins in a complex matrix, photoaptamers have not provided sufficiently low backgrounds to give ELISA-like performance. After much experimentation, we discovered that we could use equilibrium binding as the first specificity determinant, followed by kinetic selection for stable complexes between aptamers and their cognate target proteins as the required second specificity determinant.
To build this platform, we were obliged to invent a new class of aptamers, called SOMAmers. The idea was to generate novel aptamers that had the low Kds of classic aptamers, and that, in addition, had very slow dissociation rates with their cognate analytes but fast dissociation rates for most other proteins in plasma or serum. Dissociation rates for most aptamers with plasma proteins are fast, with half-lives of a few seconds – we reasoned that we simply had to select slow dissociation rates in the SELEX process itself. Simultaneously, we realized that novel nucleotide adducts, with new functionalities at the 5-positions on pyrimidines Citation[78,79], would provide chemistry missing in classic aptamers and might yield SOMAmers that held on to their cognate partners through extra binding interactions Citation[66]. The on-rates are slower than diffusion-limited rates, but the off-rates are also slow (half-lives of 30 min to several hours) Citation[66,79].
We have determined the structure of a SOMAmer with its protein target at approximately 2.5 Å resolution [Janjic et al., Unpublished Data; 74] and more structures are in progress. As expected, the contact between the protein and SOMAmer is extensive and contains elements never seen before in either classic aptamer–protein structures Citation[80,81] or structures between natural RNAs and their binding partners Citation[82]. The SOMAmer was identified from a single-stranded DNA library, where 5-benzyl-dUMP was substituted for every ‘T’ Citation[79]. We found interactions between benzyl groups and amino acids, benzyl groups stacking on other nucleotides, and a remarkable compact hydrophobic ‘turn’ with benzyl groups at its core. Small modifications to standard nucleotide chemistry open a new world of possible structures; while SOMAmers are aptamers obtained through a modified SELEX process, their properties are completely unique. Modification of the pyrimidines of oligonucleotide libraries and understanding the high-resolution structures is a continuous process in the effort to create better and better SOMAmers.
SOMAscan assay
The core idea behind the present assay was to achieve selective binding of many aptamers to their cognate analytes in solution, to discard the free aptamers, and then to release the bound aptamers from their cognate proteins, so that the aptamers themselves could be quantified. Kinetic release of non-specifically bound aptamers (e.g., to proteins with patches of positively charged amino acids) is followed by capture of the cognate proteins with their bound aptamers, which are then released and measured. The assay yields proteomic quantification from a DNA measurement because the aptamers are themselves DNA molecules . The assay is described exhaustively in an article by Gold et al.Citation[66].
In this version of the assay, binding reactions occur in solution. Other versions could include printed aptamers. Solution binding obviates issues of avidity and rebinding, which are certain to enhance non-specific binding of aptamers to proteins that contain patches of positive amino acids (the ‘growth factor problem’ mentioned in Citation[74]).
The assay is not based on the same principle as tagging antibodies with DNA Citation[59,83]; the aptamers are both the binding agent and the quantifiable DNA species. Each approach has the advantage of using a sensitive DNA quantification method.
The assay is fast, accurate, fits easily into laboratory workflow, and can be executed with common instruments. In only half a day, a person can easily assay 1000 proteins in 96 samples, and set up the hybridization measurements of the resulting aptamers that will run overnight. The data from the SOMAscan assay are quantitative and precise: approximately half the analytes can be measured at concentrations below 1 pM. The performance of the assay has been detailed extensively Citation[66], including the specificity of SOMAmers for their target proteins. In other studies, we have found a high correlation of protein measurements in plasma, serum, and buffer made with the SOMAscan assay, and both single ELISAs and commercial bead-based multiplex antibody assays >[Gold L et al., Unpublished Data]. Specificity controls are important for affinity-based proteomics and ongoing efforts in the community aim to develop standard formats for the representation of protein affinity reagents Citation[84].
Lastly, although the data published thus far utilizes hybridization of labeled SOMAmers to their complements as the detection methodology, all DNA measurement technologies work very well Citation[85].
Diagnostic applications: biomarker discovery thus far
We have published two examples of Brin-like epistemology that we discovered with the SomaLogic platform, and each is informative. In the first paper, the SOMAscan proteomics platform was used to identify biomarkers for chronic kidney disease (CKD) Citation[66]. A rather small clinical trial was performed, comparing people with early-stage CKD with people with more advanced disease. The results were surprising. The standard measurement to ascertain kidney failure is the glomerular filtration rate (real or estimated; GFR or eGFR, respectively). Filtration through the kidney has been thought to be largely a passive diffusion event, with small molecules passing into the bladder and larger molecules not. Similarly, kidney dialysis for people with failed kidneys is performed so as to remove those small molecules that build up in the blood when the GFR is reduced. Various estimates of the molecular weight required for filtration have been made over the years, with normal filtration occurring for molecules at or below 30,000 Da Citation[86,87].
In our study many (but not most) low-molecular-weight proteins accumulated in the blood when the GFR was reduced. Among the proteins whose concentrations increased the most with decreasing GFR were at least four previously known markers of CKD. Surprisingly, the concentration of most small proteins did not increase much or at all. This suggests that passive diffusion through the glomeruli is not the major means by which these proteins leave the blood. This is an example of data from the SOMAscan proteomics platform that relied on an unbiased set of measurements.
The second example of Brin-like epistemology is a study of lung cancer Citation[67]. We compared the sera of heavy smokers not known to have non-small-cell lung cancer (NSCLC; or known to have benign nodules) with the sera of heavy smokers known to have either early-stage or late-stage NSCLC. Many biomarkers were identified, with some familiar proteins on the list and some surprises. Careful analysis of the data suggested that of the 40–60 biomarkers that indicated NSCLC, many were correlated with each other and were likely to be involved in only a small number of pathways Citation[67]. The accuracy (expressed as the AUC calculation from the receiver operating characteristic [ROC]) curve for a typical classifier using approximately 12 biomarkers) is approximately 90%, and was confirmed on a set of blinded samples held back for that purpose Citation[67,101]. The data for the entire experiment were collected for all 1400 patients (with 870 protein measurements per sample) in less than 2 weeks. Because early-stage NSCLC is treatable by surgery with positive outcomes Citation[88,89], the unbiased search for biomarkers may lead to a screening test for people at high risk of having NSCLC.
We have made promising biomarker discoveries in other diseases with significant unmet medical need , including pancreatic cancer, mesothelioma, ovarian cancer, depression, and Parkinson’s disease (in this case using cerebrospinal fluid rather than blood).
Expert commentary
Antibody-based affinity assays have a prestigious history in protein measurement and single-protein biomarkers measured by ELISA form the basis of molecular diagnostics in clinical practice today. Much hope is placed in the discovery of new multiprotein biomarker panels to advance the practice of evidence-based medicine, and substantial evidence supports this hope. The key to unlocking protein biomarker discovery is high-content proteomics to accurately measure substantial portions of the human proteome – thousands to all approximately 23,000 proteins. MS and antibody-based affinity assays have dominated approaches to high-content proteomics. Tremendous progress has been made in both fields, but both are thus far limited by specific technical limitations. We reviewed the limitations of antibody-based assays, which require a sandwich-format like ELISA to achieve high sensitivity and specificity in single analyte measurements. The ability to multiplex sandwich assays is fundamentally limited by the inherent cross-reactivity of all types of antibodies, which cannot be overcome. Therefore, multiplex antibody sandwich assays will remain relatively modest in size. Content can be increased with additional multiplexed assays, with added sample requirements, assay complexity and efficiency. We reviewed a new high-content proteomics platform based on SOMAmers, which currently measures approximately 1000 proteins in a 15-µl drop of blood, and we reviewed some examples of its application to identify biomarkers in human diseases with critical unmet medical need. We hold great hope for high-content proteomic technology and its promise to unlock biomarker discovery and advance evidence-based medicine.
Five-year view
SOMAscan provides protein measurements equivalent to ELISAs for most analytes. The best SOMAmers allow limits of detection in the assay at approximately 50 fM, and approximately half the analytes show measured LODs below 1 pM. Of the 3400 proteins thought to be intentionally secreted as part of the human secretome Citation[90], many are found in concentrations within the reach of our assay, but some will be undetectable in healthy or sick people. Most of the proteins thought to be secreted into blood have never been measured, in part because no binding reagent has been made, or in the case of antibodies, no pair of antibodies has been used to make a sensitive sandwich ELISA for that analyte. Clearly one will want to expand the present list of approximately 1000 SOMAmers to at least the full human secretome and soon thereafter to the entire proteome.
Another important element will be to measure in blood the most abundant tissue-specific analytes as a measure of cell death in that tissue. Biomarkers for cancer and other pathologies will often be accompanied by elevated levels of proteins from dead cells in the affected tissue.
Another important element that comes from the work is to link systems biology to proteomics, which has thus far been impossible. If mRNA levels were tightly correlated with protein levels, one would be able to use genome-wide mRNA profiles to understand biology. The published data for mRNA and protein levels suggest low correlations Citation[14–18].
One will always wonder about other improvements to the technology. The key parameters for any diagnostic always include precision, speed, sensitivity, specificity and cost. Today the developed world spends approximately 3–4% of its healthcare budget on diagnostics (that budget varies from $2000/person/year to $6000/person/year in different countries). This would suggest an annual in-market cost for a complete wellness proteomic array (with full informatics at its side) of between $60 and $240. Molecular diagnostics must reach toward personalized medicine by providing critical information to patients and physicians at a cost that lowers the healthcare economic burden.
Key issues
• High-content proteomics holds the promise to unlock unbiased protein biomarker discovery to develop a new generation of tools for evidence-based medicine and therapeutic development.
• Proteins that comprise the circulating blood proteome form the basis of current molecular diagnostics practice (typically single protein biomarkers measured by ELISA). The plasma proteome is considered the most promising for discovering new biomarkers and biomarker patterns.
• High-content proteomics is technically challenging because the circulating proteome is a complex mixture of diverse proteins (an estimated 3400 proteins) that spans approximately 12 logs of concentration.
• High-content proteomics has not yet been achieved by mass spectrometry or multiplex antibody-based assays due to specific technical challenges.
• Antibodies, by nature, have inherent cross-reactivity that limits their ability to be multiplexed at high content for high-content proteomics.
• Both planar antibody-based arrays and bead-based suspension arrays are limited in content by cross-reactivity.
• A new class of aptamer based protein affinity reagents – slow off-rate modified aptamers (SOMAmers) – specifically overcomes the limitations posed by antibody cross-reactivity, especially in sandwich assay format, for high-content proteomics.
• We have achieved an important milestone in high-content proteomics with a highly multiplexed SOMAmer-based assay (SOMAscan), that currently measures approximately 1000 human proteins in a drop of blood (∼15 µl) with low limits of detection (1 pM median), 7 logs of overall dynamic range (∼100 fM–1 µM), and 5% median coefficient of variation.
• The power of the SOMAscan platform for biomarker discovery has been shown in clinical studies of diseases with unmet clinical need, including a study of lung cancer.
Acknowledgements
We thank all our colleagues who contribute to developing high-content proteomics and aptamer-based science and technology. We especially thank our colleagues at SomaLogic for their dedication and contributions to developing SOMAmer technology and the SOMAscan proteomics platform for biomarker discovery.
Financial & competing interests disclosure
This work was funded by SomaLogic, a biotechnology company. Edward N Brody, Larry Gold, Jeffrey J Walker, and Dom Zichi are employees of SomaLogic and Richard M Lawn is a consultant for SomaLogic. The authors have no other relevant affiliations or financial involvement with any organization or entity with a financial interest in or financial conflict with the subject matter or materials discussed in the manuscript apart from those disclosed.
No writing assistance was utilized in the production of this manuscript.
References
- Hood L, Heath JR, Phelps ME, Lin B. Systems biology and new technologies enable predictive and preventative medicine. Science306(5696), 640–643 (2004).
- Bueno-de-Mesquita JM, van Harten WH, Retel VP et al. Use of 70-gene signature to predict prognosis of patients with node-negative breast cancer: a prospective community-based feasibility study (RASTER). Lancet Oncol.8(12), 1079–1087 (2007).
- Cardoso F, Van’t Veer L, Rutgers E et al. Clinical application of the 70-gene profile: the MINDACT trial. J. Clin. Oncol.26(5), 729–735 (2008).
- Knauer M, Mook S, Rutgers EJ et al. The predictive value of the 70-gene signature for adjuvant chemotherapy in early breast cancer. Breast Cancer Res. Treat.120(3), 655–661 (2010).
- Mamounas EP, Tang G, Fisher B et al. Association between the 21-gene recurrence score assay and risk of locoregional recurrence in node-negative, estrogen receptor-positive breast cancer: results from NSABP B-14 and NSABP B-20. J. Clin. Oncol.28(10), 1677–1683 (2010).
- Lo SS, Mumby PB, Norton J et al. Prospective multicenter study of the impact of the 21-gene recurrence score assay on medical oncologist and patient adjuvant breast cancer treatment selection. J. Clin. Oncol.28(10), 1671–1676 (2010).
- Albain KS, Barlow WE, Shak S et al. Prognostic and predictive value of the 21-gene recurrence score assay in postmenopausal women with node-positive, oestrogen-receptor-positive breast cancer on chemotherapy: a retrospective analysis of a randomised trial. Lancet Oncol.11(1), 55–65 (2010).
- Gilad S, Meiri E, Yogev Y et al. Serum microRNAs are promising novel biomarkers. PloS ONE3(9) e3148 (2008).
- Rosenfeld N, Aharonov R, Meiri E et al. MicroRNAs accurately identify cancer tissue origin. Nat. Biotechnol.26(4), 462–469 (2008).
- Wang J, Chen J, Chang P et al. MicroRNAs in plasma of pancreatic ductal adenocarcinoma patients as novel blood-based biomarkers of disease. Cancer Prev. Res.2(9), 807–813 (2009).
- Paik S, Shak S, Tang G et al. A multigene assay to predict recurrence of tamoxifen-treated, node-negative breast cancer. N. Engl. J. Med.351(27), 2817–2826 (2004).
- Zichi D, Eaton B, Singer B, Gold L. Proteomics and diagnostics: let’s get specific, again. Curr. Opin. Chem. Biol.12(1), 78–85 (2008).
- de Sousa Abreu R, Penalva LO, Marcotte EM, Vogel C. Absolute protein expression profiling estimates the relative contributions of transcriptional and translational regulation. Mol. Biosyst.5(12), 1512–1526 (2009).
- Ingolia NT, Ghaemmaghami S, Newman JR, Weissman JS. Genome-wide analysis in vivo of translation with nucleotide resolution using ribosome profiling. Science324(5924), 218–223 (2009).
- Pascal LE, True LD, Campbell DS et al. Correlation of mRNA and protein levels: cell type-specific gene expression of cluster designation antigens in the prostate. BMC Genomics9, 246 (2008).
- Guo Y, Xiao P, Lei S et al. How is mRNA expression predictive for protein expression? A correlation study on human circulating monocytes. Acta Biochim. Biophys. Sin.40(5), 426–436 (2008).
- Lu P, Vogel C, Wang R, Yao X, Marcotte EM. Absolute protein expression profiling estimates the relative contributions of transcriptional and translational regulation. Nat. Biotechnol.25(1), 117–124 (2007).
- Baek D, Villén J, Shin C et al. The impact of microRNAs on protein output. Nature455(7209), 64–71 (2008).
- Liu N, Olson EN. MicroRNA regulatory networks in cardiovascular development. Dev. Cell18(4), 510–525 (2010).
- Williams AH, Valdez G, Moresi V et al. MicroRNA-206 delays ALS progression and promotes regeneration of neuromuscular synapses in mice. Science326(5959), 1549–1554 (2009).
- Mattick JS. RNA as the substrate for epigenome–environment interactions: RNA guidance of epigenetic processes and the expansion of RNA editing in animals underpins development, phenotypic plasticity, learning, and cognition. BioEssays32(7), 548–552 (2010).
- Selbach M, Schwanhäusser B, Thierfelder N et al. Widespread changes in protein synthesis induced by microRNAs. Nature455(7209), 58–63 (2008).
- Roth A, Breaker RR. The structural and functional diversity of metabolite-binding riboswitches. Ann. Rev. Biochem.78, 305–334 (2009).
- Weinberg Z, Perreault J, Meyer MM, Breaker RR. Exceptional structured noncoding RNAs revealed by bacterial metagenome analysis. Nature462(7273), 656–659 (2009).
- Subramanian J, Simon R. Gene expression-based prognostic signatures in lung cancer: ready for clinical use? J. Natl Cancer Inst.102(7), 464–474 (2010).
- Pass HI, Goparaju C, Ivanov S et al. hsa-miR-29c* is linked to the prognosis of malignant pleural mesothelioma. Cancer Res.70(5), 1916–1924 (2010).
- Ferracin M, Veronese A, Negrini M. Micromarkers: miRNAs in cancer diagnosis and prognosis. Expert Rev. Mol. Diagn.10(3), 297–308 (2010).
- Rosenwald S, Gilad S, Benjamin S et al. Validation of a microRNA-based qRT-PCR test for accurate identification of tumor tissue origin. Mod. Pathol.23(6), 814–823 (2010).
- International Human Genome Sequencing Consortium. Finishing the euchromatic sequence of the human genome. Nature431(7011), 931–945 (2005).
- Morozova O, Hirst M, Marra MA. Applications of new sequencing technologies for transcriptome analysis. Annu. Rev. Genomics Hum. Genet.10, 135–151 (2009).
- Lashkari DA, DeRisi JL, McCusker JH et al. Yeast microarrays for genome wide parallel genetic and gene expression analysis. Proc. Natl Acad. Sci. USA94(24), 13057–13062 (1997).
- Schena M, Shalon D, Davis RW, Brown PO. Quantitative monitoring of gene expression patterns with a complementary DNA microarray. Science270(5235), 467–470 (1995).
- Mardis ER. Next-generation DNA sequencing methods. Annu. Rev. Genomics Hum. Genet.9, 387–402 (2008).
- Goetz T. Sergey Brin’s search for a Parkinson’s cure. Wired22, 107–113 (2010).
- Glass DJ. A critique of the hypothesis, and a defense of the question, as a framework for experimentation. Clin. Chem.56(7), 1080–1085 (2010).
- Nabel GJ. The coordinates of truth. Science326, 53–54 (2009).
- Kell DB, Oliver SG. Here is the evidence, now what is the hypothesis? The complementary roles of inductive and hypothesis-driven science in the post-genomic era. BioEssays26(1), 99–105 (2004).
- Lander AD. The edges of understanding. BMC Biol.8, 40 (2010).
- O’Farrell PH. High resolution two-dimensional electrophoresis of proteins. J. Biol. Chem.250(10), 4007–4021 (1975).
- Addona TA, Abbatiello SE, Schilling B et al. Multi-site assessment of the precision and reproducibility of multiple reaction monitoring – based measurements of proteins in plasma. Nat. Biotechnol.27(7), 633–641 (2009).
- Rifai N, Gillette MA, Carr SA. Protein biomarker discovery and validation: the long and uncertain path to clinical utility. Nat. Biotechnol.24(8), 971–983 (2006).
- Parker CE, Pearson TW, Anderson NL, Borchers CH. Mass-spectrometry-based clinical proteomics – a review and prospective. Analyst135(8), 1830–1838 (2010).
- Oudin J. Methode d’analyze immunochimique par precipitation specifique en milieu gelifie. CR Acad. Sci. Paris222, 115–116 (1946).
- Ouchterlony O. Antigen-antibody reactions in gels. Acta Path. Microbiol. Scand.26(4), 507–515 (1949).
- Ouchterlony O. In vitro method for testing the toxinproducing capacity of diphtheria bacteria. Acta Pathol. Microbiol. Scand.26(4), 516–524 (1949).
- Yalow RS, Berson SA. Immunoassay of endogenous plasma insulin in man. J. Clin. Invest.39, 1157–1175 (1960).
- Wide L, Porath J. Radioimmunoassay of proteins with the use of Sephadex-coupled antibodies. Biochem. Biophys. Acta30, 247–260 (1966).
- Nakane P, Pierce G. Enzyme-labeled antibodies for the light and electron microscopic localization of tissue antigens. J. Cell. Biol. (33), 307–318 (1967).
- Avrameas S, Uriel J. Methode de marquage d’antigenes et d’anticorps avec des enzymes et son application en immunodiffusion. CR Acad. Sci. Paris262, 2543–2545 (1966).
- VanWeeman B, Schuurs A. Immunoassay using antigen-enzyme conjugates. FEBS Lett.15(3), 232–236 (1971).
- Engvall E, Perlmann P. Enzyme-linked immunosorbent assay (ELISA). Quantitative assay of immunoglobulin G. Immunochemistry8, 871–874 (1971).
- Haab BB, Dunham MJ, Brown PO. Protein microarrays for highly parallel detection and quantitation of specific proteins and antibodies in complex solutions. Genome Biol.2(2), research0004 (2001).
- Schröder C, Jacob A, Tonack S et al. Dual-color proteomic profiling of complex samples with a microarray of 810 cancer-related antibodies. Mol. Cell. Proteomics9(6), 1271–1280 (2010).
- Borrebaeck CA, Wingren C. Design of high-density antibody microarrays for disease proteomics: key technological issues. J. Proteomics72(6), 928–935 (2009).
- Borrebaeck CA, Wingren C. High-throughput proteomics using antibody microarrays: an update. Expert Rev. Mol. Diagn.7(5), 673–686 (2007).
- Seurynck-Servoss SL, White AM, Baird CL, Rodland KD, Zangar RC. Evaluation of surface chemistries for antibody microarrays. Anal. Biochem.371(1), 105–115 (2007).
- Schweitzer B, Roberts S, Grimwade B et al. Multiplexed protein profiling on microarrays by rolling-circle amplification. Nat. Biotechnol.20(4), 359–365 (2002).
- Sun H, Chua M, Yang D et al. Antibody arrays identify potential diagnostic markers of hepatocellular carcinoma. Biomarker Insights3, 1–18 (2008).
- Fredriksson S, Dixon W, Ji H et al. Multiplexed protein detection by proximity ligation for cancer biomarker validation. Nat. Methods4(4), 327–329 (2007).
- Anderson NL. The human plasma proteome: history, character, and diagnostic prospects. Mol. Cell. Proteomics1(11), 845–867 (2002).
- Domenici E, Willé DR, Tozzi F et al. Plasma protein biomarkers for depression and schizophrenia by multi analyte profiling of case–control collections. PloS ONE5(2) e9166 (2010).
- Kim BK, Lee JW, Park PJ et al. The multiplex bead array approach to identifying serum biomarkers associated with breast cancer. Breast Cancer Res.11(2), R22 (2009).
- Rissin DM, Kan CW, Campbell TG et al. Single-molecule enzyme-linked immunosorbent assay detects serum proteins at subfemtomolar concentrations. Nat. Biotechnol.28(6), 595–599 (2010).
- Tuerk C, Gold L. Systematic evolution of ligands by exponential enrichment: RNA ligands to bacteriophage T4 DNA polymerase. Science249(4968), 505–510 (1990).
- Ellington A, Szostak J. In vitro selection of RNA molecules that bind specific ligands. Nature346(6287), 818–822 (1990).
- Gold L, Ayers D, Bertino J et al. Aptamer-based multiplexed proteomic technology for biomarker discovery. PloS ONE (2010) (In press)
- Ostroff R, Bigbee W, Franklin W et al. Unlocking biomarker discovery: large scale application of aptamer proteomic technology for early detection of lung cancer. PloS ONE (2010) (In press).
- Zichi D, Koga T, Greef C, Ostroff R, Petach H. Photoaptamer technology: development of multiplexed microarray protein assays. Clin. Chem.48(10) 1865–1868 (2002).
- Smith D, Collins BD, Heil J, Koch TH. Sensitivity and specificity of photoaptamer probes. Mol. Cell. Proteomics2(1), 11–18 (2003).
- Petach H. Dimensionality is the issue: use of photoaptamers in protein microarrays. Curr. Opin. Biotechnol.13(4), 309–314 (2002).
- Bock C, Coleman M, Collins B et al. Photoaptamer arrays applied to multiplexed proteomic analysis. Proteomics4(3), 609–618 (2004).
- Keeney TR, Bock C, Gold L et al. Automation of the SomaLogic proteomics assay: a platform for biomarker discovery. JALA14(6), 360–366 (2009).
- Ostroff R, Foreman T, Keeney TR et al. The stability of the circulating human proteome to variations in sample collection and handling procedures measured with an aptamer-based proteomics array. J. Proteomics73(3), 649–666 (2010).
- Gold L, Janjic N, Jarvis T et al. Aptamers and the RNA world, past and present. In: RNA World IV. Atkins JF, Gesteland RF, Cech T (Eds). Cold Spring Harbor Laboratory Press, NY, USA, 1–10 (2010).
- Smith D. Sensitivity and specificity of photoaptamer probes. Mol. Cell. Proteomics2(1), 11–18 (2002).
- Hopfield JJ, Yamane T, Yue V, Coutts SM. Direct experimental evidence for kinetic proofreading in amino acylation of tRNAIle. Proc. Natl Acad. Sci. USA73(4), 1164–1168 (1976).
- Hopfield JJ. Kinetic proofreading: a new mechanism for reducing errors in biosynthetic processes requiring high specificity. Proc. Natl Acad. Sci. USA71(10), 4135–4139 (1974).
- Vaught JD, Dewey T, Eaton BE. T7 RNA polymerase transcription with 5-position modified UTP derivatives. J. Am. Chem. Soc.126(36), 11231–11237 (2004).
- Vaught JD, Bock C, Carter J et al. Expanding the chemistry of DNA for in vitro selection. J. Am. Chem. Soc.132(12), 4141–4151 (2010).
- Huang D, Vu D, Cassiday La et al. Crystal structure of NF-κB (p50)2 complexed to a high-affinity RNA aptamer. Proc. Natl Acad. Sci. USA100(16), 9268–9273 (2003).
- Long SB, Long MB, White RR, Sullenger BA. Crystal structure of an RNA aptamer bound to thrombin. RNA14(12), 2504–2512 (2008).
- Vicens Q, Cech TR. Atomic level architecture of group I introns revealed. Trend. Biochem. Sci.31(1), 41–51 (2006).
- Fredriksson S, Horecka J, Brustugun OT et al. Multiplexed proximity ligation assays to profile putative plasma biomarkers relevant to pancreatic and ovarian cancer. Clin. Chem.54(3), 582–589 (2008).
- Gloriam DE, Orchard S, Bertinetti D et al. A community standard format for the representation of protein affinity reagents. Mol. Cell. Proteomics9(1), 1–10 (2010).
- Kraemer S, Vaught JD, Bock C et al. From aptamer-based biomarker discovery to diagnostic and clinical applications: an aptamer-based, streamlined multiplex proteomic assay. Nature PrecedingsDOI: hdl:10101/npre2010.4642.1 (2010).
- Venturoli D, Rippe B. Ficoll and dextran vs. globular proteins as probes for testing glomerular permselectivity: effects of molecular size, shape, charge, and deformability. Am. J. Physiol. Renal Physiol.288(4), F605–F613 (2005).
- Vanbelleghem H, Vanholder R, Levin NW et al. The kidney disease: improving global outcomes website: comparison of guidelines as a tool for harmonization. Kidney Int.71(10), 1054–1061 (2007).
- Kassis ES, Vaporciyan AA, Swisher SG et al. Application of the revised lung cancer staging system (IASLC Staging Project) to a cancer center population. J. Thorac. Cardiovasc. Surg.138(2), 412–418 (2009).
- Okada M, Nishio W, Sakamoto T et al. Effect of tumor size on prognosis in patients with non-small cell lung cancer: the role of segmentectomy as a type of lesser resection. J. Thorac. Cardiovasc. Surg.129(1), 87–93 (2005).
- Lin H, Lee E, Hestir K et al. Discovery of a cytokine and its receptor by functional screening of the extracellular proteome. Science320(5877), 807–811 (2008).
Patent
- Gold L, Stanton M, Brody EN et al. Lung cancer biomarkers and uses thereof.US2010/0070191 (2010).