Abstract
Background
Little is known about the time course of changes in the microarchitecture of the tibial epiphysis with rheumatoid arthritis (RA), although such information would be valuable in predicting risk of fracture. Therefore, we used in vivo microcomputed tomography (μ-CT) to assess patterns of microarchitectural alterations in the tibial epiphysis using collagen-induced RA in an animal model.
Methods
Bovine type II collagen was injected intradermally into the tails of rats for induction of RA. The tibial joints were scanned by in vivo μ-CT at 0, 4, and 8 weeks following injection. Microarchitectural parameters were measured to evaluate alteration patterns of bone microarchitecture at the tibial epiphysis.
Results
The microarchitectural alterations in an RA group were significantly different from those in a control group from 0 to 4 weeks and from 4 to 8 weeks following injection (P < 0.05). The distribution of trabecular bone thickness and trabecular bone separation from 0 weeks to 8 weeks differed significantly (P < 0.05).
Conclusion
These results indicate that the patterns of microarchitectural alterations at the tibial epiphysis are strongly affected by collagen-induced progression of RA and entail a severe risk of fracture at the tibial epiphysis. This study represents a valuable first approach to tracking periodic and continuous changes in the microarchitectural characteristics of the tibial epiphysis with collagen-induced RA.
Introduction
Rheumatoid arthritis (RA) is a chronic systemic inflammatory autoimmune disease and secondarily a disorder of the joints. Exacerbation of the arthritis may lead to joint damage and increased risk of fractures.Citation1 The prevalence of RA in the adult population is about 1%, which is lower than the prevalence of osteoarthritis. However, RA is observed mainly in adults aged 25–55 years. RA symptoms have also been reported in 20-month-old infants and in 10% of persons aged more than 65 years.Citation2,Citation3 Thus, a person of any age can be affected by RA, in contrast with osteoarthritis.Citation4 In the US, approximately four million people suffer from RA, and seven trillion US dollars are spent annually to manage the disabilities and loss of function related to RA.Citation4 As a result, there is considerable interest in RA research and the needs of patients with RA.
Many researchers have studied RA in animal models. Collagen-induced arthritis (CIA) is widely used in many studies of RA to induce an experimental model of RA, because the pathogenesis of CIA is, in many ways, similar to that of human RA.Citation6,Citation8 However, most of the studies reported to date have analyzed only RA-induced bone mass or bone mineral density alterations,Citation5,Citation12,Citation14–Citation16 and there is a lack of information about the pattern of alterations in the bone microarchitecture. Some reports have indicated that rheumatic symptoms contribute significantly to increased bone fragility and risk of stress fracture,Citation20–Citation23 and predictions of bone fracture risk could be greatly improved by analyzing the bone microarchitecture.Citation18,Citation19 Therefore, detailed characterization of changes in bone microarchitecture is needed to improve the prediction of bone fracture risk associated with RA. Recently, Wang et alCitation13 and Jimenez-Boj et alCitation17 analyzed microarchitectural alterations related to RA at the tibial epiphysis. However, their studies had the limitation that the periodic and continuous patterns of microarchitectural alterations were not tracked individually. Thus, individual differences in microarchitectural characteristics at the time of onset and changes thereof during disease progression were not considered, and there were no periodic observations of continuous changes.Citation13,Citation17
In the current study, we quantified periodic and continuous collagen-induced RA-related alterations in the microarchitecture of the tibial epiphysis using in vivo microcomputed tomography (μ-CT), with the overall aim of improving the accuracy of bone fracture risk prediction in patients with RA.
Materials and methods
Animal model
The animal experiments in this study complied with the Animal Protection and Usage guidelines and regulations of Yonsei University (YWC-091113-1). Fourteen 8-week-old, white, male Sprague Dawley rats (average weight 250 ± 7 g) were used. The rats were housed at Yonsei University Laboratory Animal Research Center for 2 weeks to allow them to acclimatize (temperature 23°C ± 3°C, humidity 50% ± 10%). A 12-hour day/12-hour night cycle was used. The rats were assigned to a group in which experimental RA was induced (RA1, RA2, RA3, RA4, RA5, RA6, RA7) or a control group (C1, C2, C3, C4, C5, C6, C7). To induce RA in the rats, an emulsified solution of 300 μg bovine type II collagen (CII, Sigma-Aldrich, St Louis, MO) and an equal amount of incomplete Freund’s adjuvant (Sigma-Aldrich) were injected intradermally. In total, 0.1 mL of emulsion was injected at multiple locations at the base of the tail with a 26-gauge needle. Seven days after primary immunization, the same volume of emulsion was injected as a booster containing 100 μg of CII in incomplete Freund’s adjuvant. For the control group, the same amount of saline was injected at multiple locations at the base of the tail with a 26-gauge needle.Citation6,Citation7,Citation9,Citation26
In vivo microcomputed tomography
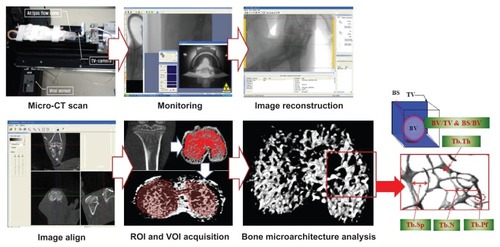
Images of the knee joints of the rats in the control and RA groups were periodically and continuously obtained using the SkyScan 1076 device for in vivo μ-CT (SkyScan, Kontich, Belgium) to analyze the microarchitectural characteristics at the tibial epiphysis. Each knee joint was scanned at an isotrophic voxel resolution of 35 × 35 × 35 μm at the beginning of the experiment (ie, before primary immunization) and at 4 and 8 weeks after primary immunization to assess the patterns of microarchitectural changes. The scanning parameters were as follows: tube voltage, 100 kV; tube current, 100 μA; filter, 1.0 mm; and gantry rotation angle, 0.7°. Flat-field correction and beam-hardening factor correction were carried out to rectify the beam-hardening effect.Citation10 In addition, the rats were anesthetized with ketamine hydrochloride (1 mL/kg, Huons, Korea) and xylazine hydrochloride (0.33 mL/kg, Bayer, Seoul, Korea) to obtain the desired μ-CT images. Physical monitoring systems were also used to observe stress levels in the animals during the scans, and a shutter was used to prevent exposure of the rats to radiation ().Citation11
Figure 1 Assessments of alterations in trabecular bone microarchitecture using microcomputer tomography scanning, monitoring, image reconstruction, image alignment, ROI and VOI acquisition, and three-dimensional analyses.
Microarchitectural characteristics
The microarchitectural parameters were calculated using CTAn version 1.8.1.2 software (SkyScan, Kontich, Belgium). After reconstruction of the two-dimensional images from μ-CT, trabecular bone from the epiphysis 600 μm above the growth plate was chosen as the volume of interest (). The microarchitectural parameters studied in the control and RA groups were: bone volume to tissue volume ratio (BV/TV, %); bone surface to bone volume ratio (BS/BV, mm−1); trabecular bone pattern factor (Tb.Pf, mm−1); trabecular bone number (Tb.N, mm−1); trabecular bone thickness (Tb.Th, mm); and trabecular bone separation (Tb.Sp, mm). BV/TV indicates the percentage of bone volume in the total tissue volume and is an indicator of changes in total bone volume. BS/BV is the ratio of the selected bone surface to the bone volume and reflects bone turnover. The trabecular bone pattern factor is an indicator of the connectivity in trabecular bone; the higher this value, the lower the connectivity and vice versa. The trabecular bone number is the amount of trabecular bone per unit length, and trabecular bone thickness is an index of trabecular bone thickness; the higher the value of the trabecular bone number or trabecular bone thickness, the higher the level of bone formation. Trabecular bone separation indicates the average distance between trabecular bone structures, which means that the narrower the gap, the higher the bone density. In addition, analyses of the distribution of trabecular bone thickness and separation were performed to identify in detail the progressive heterogeneity of the trabecular bone microarchitecture in RA over time through collagen-induced RA.
Validation of collagen-induced RA
To assess the onset and progression of RA using radiologic methods, surface deformity and damage above the epiphysis was traced and observed in reconstructed three-dimensional images of the knee joints. Mimics version 13.0 software (Materialise, Leuven, Belgium) was used to analyze external changes in the knee joints. Histologic examinations were also performed to validate the clinical induction of RA in the rats. For this purpose, the rats were sacrificed by CO2 inhalation immediately after μ-CT was performed at 8 weeks. The tissues were fixed in 10% paraformaldehyde for 8 hours at room temperature, and the remaining fixative was removed by handwashing after decalcification using a 15% ethylene-diamine tetra-acetic acid solution. After dehydration, paraffin blocks of the tissues were produced by impregnation and embedding. Hematoxylin and eosin staining was performed on knee joint sections (4 μm in thickness).
Statistical analysis
All results are expressed as the mean ± standard deviation. Two-way analysis of variance together with Tukey’s post hoc analysis were carried out to determine the significance of periodic changes and differences between the groups (at 0, 4, and 8 weeks). The criterion for statistical significance was a P value < 0.05, and the analyses were performed using SPSS software version 17.0 (SPSS Inc, Chicago, IL).
Results
Changes in microarchitectural characteristics
shows the changes in microarchitectural characteristics over time for the control and RA groups and a comparison of the two groups at weekly intervals. In terms of the periodic changes, comparing 4 weeks with 0 weeks, BV/TV in the control group increased significantly (increase of 14.13% ± 4.40%; P < 0.05), while that in the RA group showed no significant change (decrease of 3.25% ± 6.46%; P > 0.05). BS/BV in the control group decreased significantly (decrease of 3.39 ± 1.40 mm−1; P < 0.05), while BS/BV in the RA group increased significantly (increase of 2.42 ± 2.08 mm−1; P < 0.05). The trabecular bone pattern factor in the control group decreased significantly (decrease of 2.48 ± 1.21 mm−1; P < 0.05), but showed no significant change in the RA group (increase of 1.11 ± 1.59 mm−1; P > 0.05). Trabecular bone thickness in the control group increased significantly (increase of 0.09 ± 0.05 mm; P < 0.05), but decreased significantly in the RA group (decrease of 0.04 ± 0.02 mm; P < 0.05). Comparing 8 weeks with 4 weeks, BV/TV showed no significant change in the control group (increase of 0.75% ± 4.12%; P > 0.05), but decreased markedly in the RA group (decrease of 21.78% ± 6.95%; P < 0.05). BS/BV in the control group showed no significant change (increase of 0.006 ± 1.11 mm−1; P > 0.05), but increased significantly in the RA group (increase of 6.01 ± 2.60 mm−1; P < 0.05). Trabecular bone pattern factor in the control group showed no significant change (increase of 0.15 ± 0.56 mm−1; P > 0.05), but increased significantly in the RA group (increase of 8.45 ± 1.91 mm−1; P < 0.05). The trabecular bone number value showed no significant change in the control group (increase of 0.02 ± 0.14 mm−1; P > 0.05), but decreased significantly in the RA group (decrease of 0.73 ± 0.20 mm−1; P < 0.05). Trabecular bone thickness showed no significant change in the control group (increase of 0.001 ± 0.05 mm; P > 0.05), but decreased significantly in the RA group (decrease of 0.03 ± 0.03 mm; P < 0.05). Trabecular bone separation increased significantly in the RA group (increase of 0.09 ± 0.03 mm; P < 0.05), but showed no significant change in the control group (increase of 0.001 ± 0.02 mm; P > 0.05, ).
Figure 2 Relative alterations in bone microarchitectural characteristics at the tibial epiphysis after 0, 4, and 8 weeks.
Abbreviation: RA, rheumatoid arthritis.
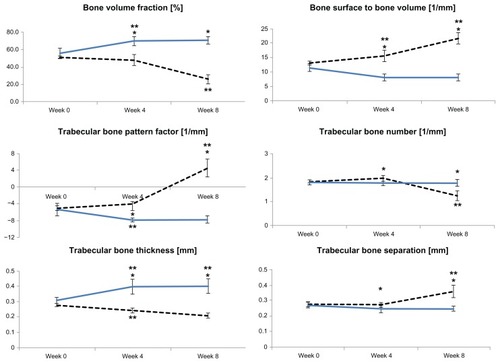
Regarding differences between the groups for each week, there was no significant difference at 0 weeks (P > 0.05). However, at 4 weeks, there was a significant difference in BV/TV (difference 22.31% ± 4.46%; control group, 70.08% ± 5.28%; RA group, 47.77% ± 6.08%), BS/BV (difference 7.39 ± 1.62 mm−1; control group, 8.07 ± 1.22 mm−1; RA group, 15.46 ± 1.95 mm−1), trabecular bone pattern factor (difference 3.90 ± 1.77 mm−1; control group, −7.87% ± 0.43%; RA group, −3.97% ± 1.64%), trabecular bone number (difference 0.20 ± 0.18 mm−1; control group, 1.76% ± 0.10%; RA group, 1.97% ± 0.11%), trabecular bone thickness (difference 0.16 ± 0.04 mm; control group, 0.40 ± 0.05 mm; RA group, 0.24 ± 0.02 mm), and trabecular bone separation (difference 0.02 ± 0.02 mm; control group, 0.24 ± 0.02 mm; RA group, 0.27 ± 0.01 mm) between the two groups (P < 0.05). At 8 weeks, there was a significant difference in BV/TV (difference 44.83% ± 7.10%; control group, 70.83% ± 4.40%; RA group, 25.99% ± 5.27%), BS/BV (difference 13.40 ± 2.30 mm−1; control group, 8.18 ± 1.16 mm−1; RA group, 21.48 ± 1.97 mm−1), trabecular bone pattern factor (difference 12.20 ± 2.62 mm−1; control group, −7.72 ± 0.86 mm−1; RA group, 4.48 ± 2.22 mm−1), trabecular bone number (difference 0.54 ± 0.28 mm−1; control group, 1.78 ± 0.14 mm−1; RA group, 1.24 ± 0.22 mm−1), trabecular bone thickness (difference 0.19 ± 0.05 mm; control group, 0.40 ± 0.05 mm; RA group, 0.21 ± 0.02 mm) and trabecular bone separation (difference 0.11 ± 0.04 mm; control group, 0.25 ± 0.02 mm; RA group, 0.36% ± 0.04%) between the two groups (P < 0.05, ).
summarizes the incidence of changes in each microarchitectural parameter in terms of individual analysis for the control and RA groups. A negative incidence was generally shown in the RA group relative to the control group. Comparing 4 weeks with 0 weeks, an increase in BV/TV, trabecular bone thickness, and trabecular bone separation, as well as a decrease in trabecular bone pattern factor, were shown for all animals (C1, C2, C3, C4, C5, C6, C7; 100%), in the control group. In contrast, BS/BV and trabecular bone number showed opposite patterns in all animals in the RA group (RA1, RA2, RA3, RA4, RA5, RA6, RA7; 100%) compared with those in the control group. Comparing 8 weeks with 4 weeks, an increase in BS/BV, trabecular bone pattern factor, and trabecular bone separation, as well as a decrease in BV/TV, trabecular bone number, and trabecular bone thickness were shown in all animals from the RA group (RA1, RA2, RA3, RA4, RA5, RA6, RA7; 100%). Trabecular bone separation showed a reverse pattern in all animals from the control group (C1, C2, C3, C4, C5, C6, C7; 100%) compared with that in the RA group.
Table 1 Incidence of changes in each microarchitectural parameter in terms of the individual analysis for control and RA groups
Changes in microarchitectural characteristics
Periodic changes in the distributions of trabecular bone thickness and trabecular bone separation in the control and RA groups and comparisons of these distributions for each week are shown for the two groups in and .
Figure 3 Trabecular bone thickness distribution at the tibial epiphysis after (A) 0 weeks, (B) 4 weeks, and (C) 8 weeks.
Notes: Vertical axis, bone percentage, %; horizontal axis, trabecular bone thickness, mm; %; black bar, control group; white bar, RA group. *Differences between groups; **difference from 0 to 4 weeks; ***difference from 4 to 8 weeks.
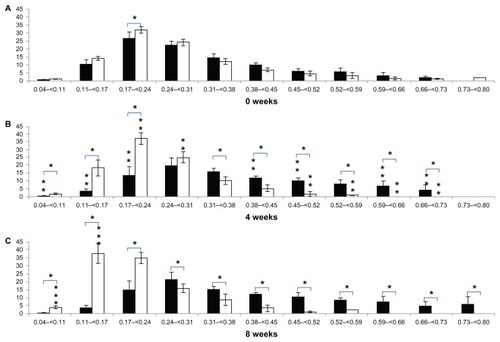
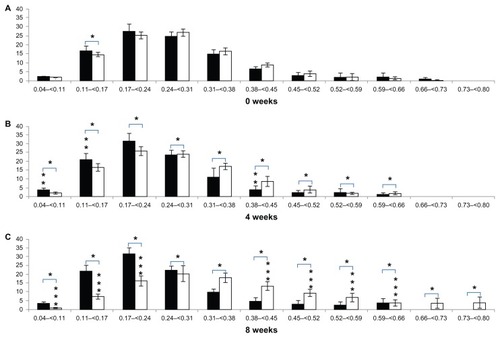
Figure 4 Alterations in trabecular bone separation distribution at the tibial epiphysis after (A) 0 weeks, (B) 4 weeks, and (C) 8 weeks.
In terms of periodic changes in the distribution of trabecular bone thickness, comparing 4 weeks with 0 weeks, the percentage with trabecular bone thickness < 0.17 mm decreased significantly in the control group (decrease of 7.25% ± 2.96%; P < 0.05). The percentage with trabecular bone thickness in the range of 0.17–0.31 mm decreased significantly (decrease of 15.04% ± 9.27%; P < 0.05), and the percentage with trabecular bone thickness > 0.31 mm increased significantly (increase of 22.28% ± 10.71%; P < 0.05). In the RA group, there was no significant change in the percentage with trabecular bone thickness < 0.17 mm (increase of 4.99% ± 6.25%; P > 0.05). The percentage with trabecular bone thickness in the range of 0.17–0.31 mm increased significantly (increase of 6.29% ± 1.69%; P < 0.05), and the percentage with trabecular bone thickness > 0.31 mm decreased significantly (decrease of 11.29% ± 5.95%; P < 0.05). Comparing 8 weeks with 4 weeks, there were no significant changes in the distribution of trabecular bone thickness in the control group (<0.17 mm; increase of 0.01% ± 1.41%, 0.17–0.31 mm; increase of 1.12% ± 10.27%, >0.31 mm; decrease of 1.13% ± 11.64%; P > 0.05). In contrast, the percentage with trabecular bone thickness < 0.17 mm increased significantly in the RA group (increase of 19.55% ± 9.26%; P < 0.05). The percentage with trabecular bone thickness in the range of 0.17–0.31 mm decreased (decrease of 13.91% ± 4.42%; P < 0.05), and there were no significant changes in the percentages with trabecular bone thickness > 0.31 mm (decrease of 5.65% ± 8.36%; P > 0.05). Regarding comparison of the two groups for each week (), at 4 weeks, the percentage with trabecular bone thickness < 0.17 mm was significantly lower (16.24% ± 5.09%; P < 0.05) in the control group (3.97% ± 1.57%) than in the RA group (20.22% ± 5.57%). The percentage with trabecular bone thickness in the range of 0.17–0.31 mm was significantly lower (28.55% ± 10.34%; P < 0.05) in the control group (33.84% ± 9.95%) than in the RA group (62.38% ± 2.87%), and the percentage with trabecular bone thickness > 0.31 mm was significantly higher (44.79% ± 9.77%; P < 0.05) in the control group (62.19% ± 11.49%) than in the RA group (17.40% ± 5.90%). At 8 weeks, the percentage with trabecular bone thickness < 0.17 mm was significantly lower (35.78% ± 6.59%; P < 0.05) in the control group (3.99% ± 1.44%) than in the RA group (39.77% ± 6.35%), the percentage with trabecular bone thickness in the range of 0.17–0.31 mm was significantly lower (13.35% ± 9.29%; P < 0.05) in the control group (34.95% ± 9.51%) than in the RA group (48.48% ± 2.86%), and the percentage with trabecular bone thickness > 0.31 mm was significantly higher (49.31% ± 10.65%; P < 0.05) in the control group (61.06% ± 10.91%) than in the RA group (11.75% ± 5.74%, ).
In terms of periodic changes in the distribution of trabecular bone separation, comparing 4 weeks with 0 weeks, the percentage with trabecular bone separation < 0.17 mm increased significantly in the control group (increase of 5.75% ± 3.08%; P < 0.05). There was no significant change in the percentage with trabecular bone separation in the range of 0.17–0.31 mm in the control group (increase of 3.22% ± 4.43%; P > 0.05). The percentage with trabecular bone separation > 0.31 mm decreased significantly (decrease of 8.97% ± 6.80%; P < 0.05). In the RA group, there was no significant change in the distribution of trabecular bone separation (<0.17 mm, increase of 2.03% ± 2.74%; 0.17–0.31 mm, decrease of 2.19% ± 7.16%; >0.31 mm, increase of 0.16% ± 8.74%; P > 0.05). Comparing 8 weeks with 4 weeks, the distribution of trabecular bone separation showed no significant changes in the control group (<0.17 mm, increase of 0.60% ± 3.89%; 0.17–0.31 mm, decrease of 1.35% ± 6.96%; >0.31 mm, increase of 0.75% ± 10.17%; P > 0.05). In the RA group, no significant changes in the percentages with trabecular bone separation < 0.17 mm (decrease of 10.23% ± 2.75%; P > 0.05) or in the range of 0.17–0.31 mm (decrease of 13.41% ± 7.18%; P > 0.05) were detected, while the percentage with trabecular bone separation > 0.31 mm increased significantly (23.64% ± 8.79%; P < 0.05).
Regarding comparisons of the two groups for each week (), there was no significant difference between the groups at 0 weeks (P > 0.05). However, at 4 weeks, the percentage with trabecular bone separation < 0.17 mm was significantly higher (6.51% ± 4.46%; P < 0.05) in the control group (24.85% ± 4.50%) than in the RA group (18.35% ± 2.49%), the percentage with trabecular bone separation that was in the range of 0.17–0.31 mm was significantly higher (5.71% ± 3.17%; P < 0.05) in the control group (55.53% ± 3.89%) than in the RA group (49.82% ± 3.19%), and the percentage with trabecular bone separation > 0.31 mm was significantly lower (12.22% ± 6.38%; P < 0.05) in the control group (19.60% ± 4.06%) than in the RA group (31.82% ± 5.45%). At 8 weeks, the percentage with trabecular bone separation < 0.17 mm was significantly higher (17.34% ± 4.12%; P < 0.05) in the control group (25.45% ± 3.69%) than in the RA group (8.12% ± 1.69%), the percentage of trabecular bone separation in the range of 0.17–0.31 mm in control group (54.18% ± 3.56%) was significantly higher (17.77% ± 7.35%; P < 0.05) than in the RA group (36.41% ± 7.22%), and the percentage with trabecular bone separation > 0.31 mm was significantly lower (35.11% ± 9.38%; P < 0.05) in the control group (20.36% ± 5.40%) than in the RA group (55.47% ± 8.78%, ).
Validation of RA induction in an animal model
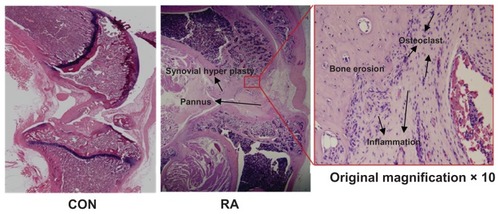
shows external changes in bone shape according to changes in the surface of the tibial epiphysis and the extent of its destruction in the knee joints of rats in the control group and the RA group, together with images of the reconstructed three-dimensional μ-CT images. The reconstructed three-dimensional μ-CT images of knee joints from the control group showed no external deformities or irregularities. In contrast, the overall bone thickness in the RA group was less than that in the control group and the shape was unclear. Furthermore, inside the epiphysis, bone loss within the trabecular bone was higher than that in the control group, and trabecular bone was rarely observed under the growth plate of the proximal tibia. There was evidence of severe bone erosion in the medial and lateral areas of the tibial bone in the three-dimensional μ-CT images, and callus bone was formed in a dispersed manner. The tibia and femoral articular surfaces were observed to be irregular due to formation of osteophytes. shows the results of histologic examination (hematoxylin and eosin staining) in the RA group. Bone erosion, synovitis, and pannus formation, which are characteristic of RA, were noted in the tibial epiphysis. Few osteoclasts were observed within the bone matrix of the erosion area in the RA group (original magnification × 10). Although inflammation in the knee joints did not appear to be severe, there was evidence of chronic inflammation, ie, fibrosis and synovial hypertrophy.
Figure 5 Representative radiologic images of the knee joints of rats in the control (upper) and RA (lower) groups at 8 weeks.
Notes: Left, anterior view; right, posterior view, showing bone erosion and osteophyte formation.
Abbreviation: RA, rheumatoid arthritis.
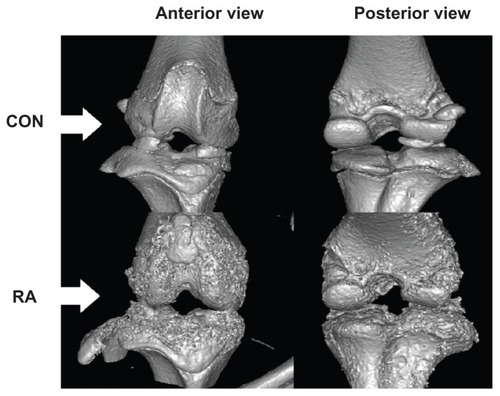
Figure 6 Representative histologic image of a knee joint with control, rheumatoid arthritis (RA) and a ×10 magnification of the section of RA (inset), showing evidence of bone erosion, inflammation, pannus formation, and synovial hypertrophy (black arrows).
Discussion and conclusion
The CIA rat model is widely used in human RA research. Despite its similarity to human RA, the severity of CIA can be modulated by changing the amount of CII injected.Citation26 CII doses ranging from 75 μg to 1000 μg per rat have been described as effective for inducing CIA, and CII doses ranging from 150 μg to 300 μg are most commonly used for inducing intermediate CIA in rats.Citation26 Symptoms of arthritis first appear 12–16 days after immunization with 150–300 μg of CII in outbred rodents, such as Sprague-Dawley strains.Citation26 The incidence of RA in Sprague-Dawley rats after immunization with 150–300 μg of CII is reported to be in the range of 51%–75%.Citation27 Administration of a booster injection 7 days after primary immunization increases the incidence of CIA and helps to ensure a more uniform time of onset in groups of rats.Citation26 Based on these observations, 300 μg of CII with a booster injection was chosen as the regimen for the present study. It should be noted that the validity of injecting CII as a booster has not been confirmed with respect to examining characteristic changes in bone microarchitecture. Previous studies of CIA involving injection of 150–300 μg of CII and a booster have aimed to assess the level of disease progression by analyzing cytokine levels, scores for induction of joint swelling, formation of anticollagen antibody, and changes in bone volume on two-dimensional images, rather than investigating (as in the present study) bone microarchitectural characteristics in three-dimensional images.Citation25,Citation28–Citation31 Therefore, further justification is needed for the choice of CII dose (range 150–300 μg) that should be used with a booster injection for optimal assessment of bone microarchitecture.
The results obtained in the present study indicate that bone microarchitecture at the tibial epiphysis in a rat with RA adopts a generally resorptive, ie, destructive, pattern over time. However, at 4 weeks, despite the overall resorptive pattern detected in the RA group, the observed activation of bone turnover, as evidenced by increases in BS/BV, trabecular bone number, and BV/TV in the RA group did not correspond to the resorptive pattern (trabecular bone number and BV/TV may be gradually decreased by collagen-induced RA over time owing to the resorptive pattern). These results may be explained by the distribution of trabecular bone thickness and separation. The percentage with relatively low trabecular bone thickness increased (P < 0.05), while that with relatively high trabecular bone thickness decreased (P < 0.05) in the RA group until 4 weeks (for the trabecular bone thickness distribution, there was no significant change in the percentage with trabecular bone thickness < 0.17 mm; the percentage with trabecular bone thickness in the range of 0.17–0.31 mm increased; and the percentage with trabecular bone thickness > 0.31 mm decreased), and no significant changes in trabecular bone separation distribution were detected (P < 0.05). In other words, the increase in relatively low trabecular bone thickness and the decrease in relatively low trabecular bone thickness may lead to a temporary absence of change in trabecular bone separation, resulting in a temporary increase in trabecular bone number with no alteration in the BV/TV ratio in the RA group up until 4 weeks. At 8 weeks, the resorptive patterns corresponded reasonably with the change in bone turnover rate as a result of collagen-induced RA over time. These findings suggest that patterns of bone microarchitecture changes brought about by RA should be periodically considered in the diagnosis and management of rheumatic symptoms over time, particularly with respect to prediction of bone fracture risk.
The results obtained in the present study may be affected by the ability of the individual animal to adapt which, in turn, is dependent on physical/environmental adaption ability and stress factors.Citation24,Citation32 Therefore, to confirm our results, it will be necessary in a future study to analyze individual adaptation capabilities by observing animal behavior and habits. For example, by quantifying real-time behavioral patterns using a motion-capturing system, in combination with regular clinical and pathologic examination of experimental animals, one might improve the accuracy of the results. Nevertheless, the present study represents a valuable first approach to tracking the periodic and continuous patterns of collagen-induced RA-associated microarchitectural changes at the tibial epiphysis, which should improve our ability to assess fracture risk induced by RA at this site over time.
Acknowledgment
This study was supported by the Research Fund for Future Strategy of Sejong University in 2011.
Disclosure
The authors report no conflicts of interest in this work.
References
- HaugebergGOrstavikREKvienTKEffects of rheumatoid arthritis on boneCurr Opin Rheumatol200315446947512819477
- SmolenJSSteinerGTherapeutic strategies for rheumatoid arthritisNat Rev Drug Discov20032647348812776222
- HortonMRRheumatoid arthritis associated interstitial lung diseaseCrit Rev Comput Tomogr2004455–642944015747578
- PincusTThe underestimated long term medical and economic consequences of rheumatoid arthritisDrugs199550Suppl 11148714794
- HoshinoKHanyuTAraiKTakahashiHEMineral density and histomorphometric assessment of bone changes in the proximal tibia early after induction of type II collagen-induced arthritis in growing and mature ratsJ Bone Miner Metab2001192768311281163
- TrenthamDETownesASKangAHAutoimmunity to type II collagen an experimental model of arthritisJ Exp Med19771463857894190
- MyersLKRosloniecEFCremerMAKangAHCollagen-induced arthritis, an animal model of autoimmunityLife Sci19976119186118789364191
- BrandDDLathamKARosloniecEFCollagen-induced arthritisNat Protoc2007251269127517546023
- GriffithsMMImmunogenetics of collagen-induced arthritis in ratsInt Rev Immunol1988411153072382
- BarrettJFKeatNArtifacts in CT: recognition and avoidanceRadiographics20042461679169115537976
- YangXMengYLuoQGongHHigh resolution in vivo micro-CT with flat panel detector based on amorphous siliconJ Xray Sci Technol201018438139221045275
- ShuGYamamotoKNagashimaMDifferences in osteoclast formation between proximal and distal tibial osteoporosis in rats with adjuvant arthritis: inhibitory effects of bisphosphonates on osteoclastsMod Rheumatol200616634334917164994
- WangSXCherianADumitriuMDisease modifying effects of N-butyryl glucosamine in a streptococcal cell wall induced arthritis model in ratsJ Rheumatol200734471272017309122
- HavdrupTHulthATelhagHThe subchondral bone in osteoarthritis and rheumatoid arthritis of the knee. A histological and microradiographical studyActa Orthop Scand1976473345350952224
- ArnettFCEdworthySMBlochDAThe American Rheumatism Association 1987 revised criteria for the classification of rheumatoid arthritisArthritis Rheum19883133153243358796
- van der HeijdeDMRadiographic imaging: the ‘gold standard’ for assessment of disease progression in rheumatoid arthritisRheumatology (Oxford)200039Suppl 191611001374
- Jimenez-BojERedlichKTürkBInteraction between synovial inflammatory tissue and bone marrow in rheumatoid arthritisJ Immunol200517542579258816081832
- DempsterDWThe contribution of trabecular architecture to cancellous bone qualityJ Bone Miner Res2000151202310646110
- ParfittAMImplications of architecture for the pathogenesis and prevention of vertebral fractureBone199213Suppl 2S41S471627414
- PeaseCTInsufficiency fractures of the distal tibiaBr J Rheumatol19943311105610597981993
- MaenpaaHMSoiniILehtoMUBeltEAInsufficiency fractures in patients with chronic inflammatory joint diseasesClin Exp Rheumatol2002201777911894837
- WeiNStress fractures of the distal fibula presenting as monarticular flares in patients with rheumatoid arthritisArthritis Rheum19943710155515567945483
- BuskilaDGladmanDDStress fractures of the legs and swelling of the ankles in a patient with lupus: a diagnostic dilemmaAnn Rheum Dis199049107837842241268
- RogersMPTrenthamDEMcCuneWJEffect of psychological stress on the induction of arthritis in ratsArthritis Rheum19802312133713427192986
- SaitoHKojimaTTakahashiMA tumor necrosis factor receptor loop peptide mimic inhibits bone destruction to the same extent as anti-tumor necrosis factor monoclonal antibody in murine collagen-induced arthritisArthritis Rheum20075641164117417393436
- RosloniecEFCremerMKangAMyersLKCollagen-induced arthritisCurr Protoc Immunol2001Chapter 15Unit 15
- CremerMAGriffithsMMTeratoKKangAHType XI and II collagen-induced arthritis in rats: characterization of inbred strains of rats for arthritis-susceptibility and immune-responsiveness to type XI and II collagenAutoimmunity19952031531617578876
- YeXJTangBMaZKangAHMyersLKCremerMAThe roles of interleukin-18 in collagen-induced arthritis in the BB ratClin Exp Immunol2004136344044715147345
- Nagler-AndersonCBoberLARobinsonMESiskindGWThorbeckeGJSuppression of type II collagen-induced arthritis by intragastric administration of soluble type II collagenProc Natl Acad Sci U S A19868319744374463463976
- IwaiHKozonoYHiroseSAmelioration of collagen-induced arthritis by blockade of inducible costimulator-B7 homologous protein costimulationJ Immunol200216984332433912370365
- CoppietersKDreierTSilenceKFormatted anti-tumor necrosis factor alpha VHH proteins derived from camelids show superior potency and targeting to inflamed joints in a murine model of collagen-induced arthritisArthritis Rheum20065461856186616736523
- LeeJHChunKJKimHSAlteration patterns of trabecular bone microarchitectural characteristics induced by osteoarthritis over timeClin interv Aging2012730331222956865