
Abstract
Objective
To evaluate the impact of lung function, measured as forced expiratory volume in 1 second (FEV1) % predicted, on health care resource utilization and costs among patients with COPD in a real-world US managed-care population.
Methods
This observational retrospective cohort study utilized administrative claim data augmented with medical record data. The study population consisted of patients with one or more medical claims for pre- and postbronchodilator spirometry during the intake period (July 1, 2012 to June 30, 2013). The index date was the date of the earliest medical claim for pre- and postbronchodilator spirometry. Spirometry results were abstracted from patients’ medical records. Patients were divided into two groups (low FEV1% predicted [,50%] and high FEV1% predicted [≥50%]) based on the 2014 Global Initiative for Chronic Obstructive Lung Disease report. Health care resource utilization and costs were based on the prevalence and number of discrete encounters during the 12-month postindex follow-up period. Costs were adjusted to 2014 US dollars.
Results
A total of 754 patients were included (n=297 low FEV1% predicted group, n=457 high FEV1% predicted group). COPD exacerbations were more prevalent in the low FEV1% predicted group compared with the high group during the 12-month pre- (52.5% vs 39.6%) and postindex periods (49.8% vs 36.8%). Mean (standard deviation) follow-up all-cause and COPD-related costs were $27,380 ($38,199) and $15,873 ($29,609) for patients in the low FEV1% predicted group, and $22,075 ($28,108) and $10,174 ($18,521) for patients in the high group. In the multivariable analyses, patients in the low FEV1% predicted group were more likely to have COPD exacerbations and tended to have higher COPD-related costs when compared with patients in the high group.
Conclusion
Real-world data demonstrate that patients with COPD who have low FEV1% predicted levels use more COPD medications, have more COPD exacerbations, and incur higher COPD-related health care costs than those with high FEV1% predicted levels.
Introduction
COPD is characterized by a restricted airway and functional impairment.Citation1 The symptoms of COPD, including dyspnea, cough, and sputum production, negatively affect a patient’s health status and may lead to disability. Airflow restriction is progressive and often not spontaneously reversible; therefore, the goal of COPD therapy is to reduce symptoms, prevent exacerbations, and improve lung function. The Global Initiative for Chronic Obstructive Lung Disease (GOLD) classifies COPD based on history of exacerbations and symptoms, as well as objective measures of airflow limitation.Citation2 Spirometry – specifically, forced expiratory volume in 1 second (FEV1) – is a widely accepted objective and validated measure of pulmonary function.Citation3–Citation5 The US Food and Drug Administration requires spirometry improvements as a primary outcome in clinical trials of bronchodilator medications for COPD. In clinical practice, however, patient symptoms and health status are commonly used for clinical assessment of COPD.Citation6
Numerous studies have demonstrated a correlation between poor lung function and increased COPD symptoms and exacerbations,Citation7–Citation17 and improvements in lung function are associated with health status gains in people with COPD.Citation6 Studies examining the relationship between FEV1 and patient-reported outcomes concluded that changes in FEV1 predict changes in health status.Citation6,Citation11 Therefore, therapies that improve FEV1 will likely improve clinical and patient-reported outcomes as well.Citation11
COPD exacerbations are often sufficiently serious to require emergency treatment or hospitalization,Citation16 and are thus associated with substantial increases in health care costs.Citation17 A retrospective study measuring the cost of COPD exacerbations, identified from administrative claim data and assessed by quarter and severity of the exacerbation, found the mean total cost of a severe exacerbation (ie, an exacerbation [with a claim for oral or parenteral corticosteroids on the same day or within 7 days following a COPD claim] involving either a hospitalization on the same day or death within 7 days of the COPD claim) was US $17,016 per patient-quarter, compared with $6,628 per patient-quarter for a nonsevere exacerbation (ie, an exacerbation involving neither a hospitalization on the same day nor death within 7 days of the COPD claim).Citation17 While previous research has largely examined the relationship between claim-determined exacerbations and costs, studies that have explored the relationship between clinically determined lung function (ie, measured by spirometry) and health care resource utilization (HCRU) and costsCitation18–Citation30 are limited to studies based on data gathered more than a decade ago,Citation21,Citation22,Citation26,Citation29 populations of fewer than 500 patients,Citation22,Citation25,Citation27,Citation28 or patients recruited from single centers.Citation26,Citation27,Citation30 Additionally, a number of those studies were performed outside the US.Citation18–Citation21,Citation23–Citation25,Citation28,Citation29 Since COPD treatment and health care utilization patterns, as well as costs, vary considerably between countries,Citation28 the results from these studies, while of interest, cannot be generalized to a US population. To fill this knowledge gap, this study evaluated the impact of FEV1 levels on HCRU, including COPD exacerbations, and direct costs among patients with COPD in a real-world US managed-care population.
Methods
Study design and patient identification
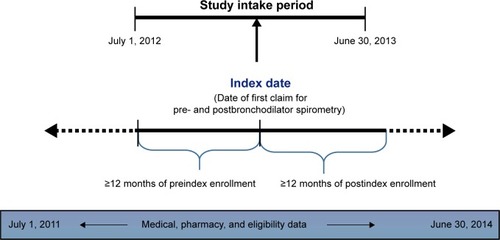
This study was an observational retrospective cohort study utilizing administrative claim data augmented with medical record data. The patient sample was identified from medical and pharmacy claims in the HealthCore Integrated Research Database, a large administrative claims database with claims from 14 geographically dispersed US health plans, with service dates during the study period between July 1, 2011 and June 30, 2014. The patient inclusion criteria based on administrative claims data were: one or more medical claims for pre- and postbronchodilator spirometry (Current Procedural Terminology code 94060) during the study intake period, which extended from July 1, 2012 through June 30, 2013 (index date = date of the earliest medical claim for pre- and postbronchodilator spirometry in the intake period); one or more medical claims for an inpatient stay or emergency department (ED) visit associated with COPD (International Classification of Diseases, ninth revision, clinical modification [ICD-9-CM] diagnosis codes 491.xx, 492.xx, and 496.xx); or two or more medical claims with distinct service dates for COPD in an office or other outpatient setting during the study period. In addition, all patients were 40 years of age or older on the index date, had at least 12 months preindex (baseline) and 12 months postindex (follow-up) continuous medical and pharmacy enrollment, were insured with only commercial or Medicare Advantage health insurance during the study period, and were patients whose medical records could be requested for medical record studies ().
Figure 1 Study design.
Medical record review
Medical record data were required to supplement information not available in the administrative claims data (eg, FEV1% predicted value). Providers who were associated with the index spirometry test who had seen the patient at least once in the 12-month period prior to the index date and had valid contact information, were identified. A patient/provider list was generated and sent to HealthCore’s medical record vendor, who requested the medical records of the patients on the list from their identified providers. A standardized data collection form was developed and used to abstract the relevant clinical data. Patients with a diagnosis of COPD, a postbronchodilator FEV1/forced vital capacity (FVC) ratio <0.7, and at least one post-bronchodilator FEV1% predicted value documented in the medical record review period, defined as between index date − 365 days and index date + 30 days, were included in the analyses.
The number of targeted completed medical record abstractions was set at 800, based on margin-of-error estimations ranging from ±4.9% to ±6.57% at a 95% confidence level. The study was approved by the New England Institutional Review Board. A Waiver of Authorization was obtained from the New England Institutional Review Board to acquire and review medical records without patient signature.
After the medical record abstractions were completed, patients’ medical record data were merged with their administrative claims data using unique patient identifiers for analysis purposes. The patient cohort was stratified into two groups, based on the postbronchodilator FEV1% predicted value according to the classification of severity of airflow limitation in COPD specified in the 2014 GOLD report.Citation2 Patients meeting the GOLD criteria for mild (GOLD I) or moderate (GOLD II) COPD severity (ie, postbronchodilator FEV1 50% predicted or higher) were categorized as high FEV1% predicted, and patients meeting the GOLD criteria for severe (GOLD III) or very severe (GOLD IV) COPD (ie, FEV1 less than 50% predicted) were categorized as low FEV1% predicted.
Study measures
Baseline variables assessed from the administrative claims included demographic characteristics (eg, age, sex, provider specialty associated with index spirometry test) and clinical characteristics during the 12-month preindex period, such as comorbidities (measured using the Quan–Charlson Comorbidity Index)Citation31 and conditions, use of oxygen therapy, and dyspnea. Criteria for COPD exacerbations were based on the 2014 GOLD report,Citation2 and were defined as inpatient COPD exacerbations (an inpatient stay with COPD [ICD-9-CM codes 491.xx, 492.xx, 496.xx] as the primary diagnosis), ED COPD exacerbations (an ED visit with COPD as the primary diagnosis [ED visits followed by hospitalizations were not included, as they were considered inpatient hospitalizations]), and ambulatory COPD exacerbations (a physician office or other outpatient visit with COPD diagnosis in any position of a medical claim and receipt of corticosteroids and antibiotics within 7 days following the physician office/other outpatient visit) during the 12-month pre- and 12-month postindex periods. The hierarchy applied to create the type of COPD exacerbation for an exacerbation episode was inpatient COPD exacerbation > ED COPD exacerbation > ambulatory COPD exacerbation. COPD medication treatment patterns were evaluated at 12 months pre- and 12 months postindex, and included any inhaled corticosteroids (ICS), long-acting muscarinic agents (LAMAs), long-acting β-agonists (LABAs), short-acting muscarinic antagonists, or short-acting inhaled β2-adrenergic agonists used as a single or combination therapy in addition to other COPD medications, including phosphodiesterase-4 inhibitors and xanthenes.
HCRU and costs were based on the prevalence and number of discrete encounters during the 12-month pre- and 12-month postindex periods. Utilization was broken down by site of care (eg, physician office visits, other outpatient visits, ED visits, and inpatient hospitalizations) and pharmacy dispensing. Costs were determined based on site of care, and were reported in aggregate as total costs paid across all resources (medical plus pharmacy) in US dollars. Costs are presented as the combined amount paid by both the health plan and the patient to providers. Patient out-of-pocket costs included all coinsurance, deductibles, copayments, or other patient outlays related to specific medical claims. All costs were adjusted to 2014 dollars, given the most recent medical care price index information provided by the Bureau of Labor Statistics at the time the analyses were performed.Citation32 COPD-related utilization and costs were captured from medical claims containing ICD-9-CM diagnosis codes for COPD (ICD-9-CM codes 491.xx, 492.xx, and 496.xx) and pharmacy claims containing generic product identifier codes for COPD-related medications. Additional clinical data abstracted from the medical records included confirmation of the COPD diagnosis, spirometry test results, asthma diagnosis, dyspnea, smoking status, and race.
Statistical analyses
Descriptive statistics included means (standard deviation [SD], median) and frequencies and percentages for continuous and categorical data, respectively. An unadjusted analysis was conducted with comparisons between high and low FEV1% predicted cohorts. Logistic regression models were developed to examine the association between postbronchodilator FEV1% predicted and occurrence of COPD exacerbations in the 12-month postindex period. The dependent variable was occurrence of at least one COPD exacerbation in the 12-month follow-up period. Due to the non-normal distribution and skewed nature of the cost data, generalized linear models with gamma distribution and log link function were applied to examine the association between postbronchodilator FEV1% predicted and all-cause health care direct costs in the 12-month postindex period, and the association between postbronchodilator FEV1% predicted and COPD-related health care direct costs in the 12-month postindex period. Analyses were performed using SAS 9.4 (SAS Institute Inc, Cary, NC, USA), with a two-sided 5% significance level for all statistical tests.
Results
Study population
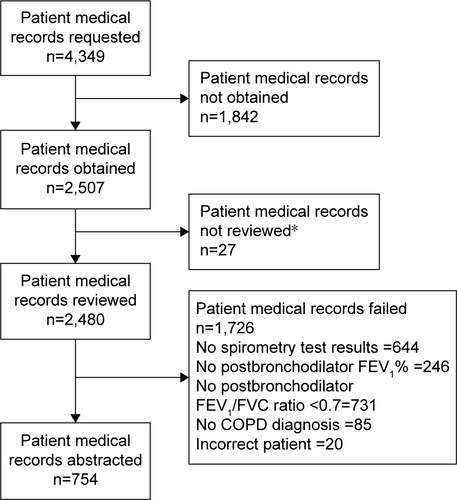
Of the 4,349 patients who were identified from the administrative claims database (Figure S1) and whose medical records were requested, 2,507 medical records were obtained and 2,480 medical records reviewed for eligibility criteria. Of these, the medical records of 754 patients contained all required clinical data, and were included in the final analysis (Figure S2); 1,726 medical records were excluded, because there were no documented spirometry results (644 records), no documented postbronchodilator FEV1% (246 records), no documented postbronchodilator FEV1/FVC ratio <0.7 (731 records), no documented diagnosis of COPD (85 records), or incorrect patient information (20 records).
Baseline patient characteristics from claims data
The mean age of patients included in the analyses was 69.4 (SD 8.81) years in the low FEV1% predicted group and 71.3 (SD 9.97) years in the high FEV1% predicted group (). Slightly more than half were women (54.4%). Pulmonologists were the predominant provider specialty associated with the index spirometry tests in both the low FEV1% predicted group (79.8%) and high FEV1% predicted group (73.3%).
Table 1 Baseline demographic and clinical characteristics from claims
The most prevalent comorbidities in both cohorts were hypertension (57.6% low group vs 63.5% high group), ischemic heart disease (27.3% low group vs 28.4% high group), and diabetes (23.6% low group vs 22.5% high group). Compared with patients in the high FEV1% predicted group, a greater percentage of patients in the low FEV1% predicted group had oxygen therapy (42.1% low group vs 19.0% high group) during the baseline period.
Baseline clinical characteristics from medical records
All 754 patients had a diagnosis of COPD confirmed in their medical records. The mean (SD) postbronchodilator FEV1% predicted values were 37.2% (8.38%) and 69.1% (14.51%) in the low and high FEV1% predicted groups, respectively. The mean (SD) postbronchodilator FEV1/FVC ratio was 45.5% (10.71%) in the low FEV1% predicted group and 58.8% (7.58%) in the high FEV1% predicted group. A majority of patients were Caucasian/white (82.8% low group vs 79.4% high group), had experienced dyspnea (77.4% low group vs 70.5% high group), and had a history of smoking (74.1% low group vs 76.8% high group). An asthma diagnosis was documented in 17.2% of patients in the low FEV1% predicted group vs 19.9% in the high group ().
Table 2 Baseline clinical characteristics from medical records
Utilization of COPD medications from claims data
Among patients in the low and high FEV1% predicted groups, utilization of COPD medications during the baseline and follow-up periods were: any ICS (67.3% vs 46% and 70.7% vs 54.9%), any LABA (66.3% vs 41.8% and 68.4% vs 51%), any LAMA (51.2% vs 35.7% and 54.5% vs 41.6%), any short-acting muscarinic antagonist/short-acting inhaled β2-adrenergic agonist (73.4% vs 56.2% and 74.4% vs 54.5%), and other COPD medications (including phosphodiesterase-4 inhibitors and xanthenes [8.1% vs 3.9% and 10.1% vs 4.4%]), respectively (data not shown in tables or figures).
COPD exacerbations from claims data
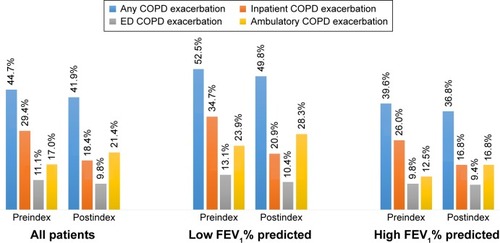
Within the low and high groups, 52.5% vs 39.6% of patients had any type of COPD exacerbation, including inpatient (34.7% vs 26%), ED (13.1% vs 9.8%), and ambulatory (23.9% vs 12.5%) exacerbations, during the 12-month preindex (baseline) period, while 49.8% vs 36.8% had any type of COPD exacerbation, including inpatient (20.9% vs 16.8%), ED (10.4% vs 9.4%), and ambulatory (28.3% vs 16.8%) exacerbations, during the 12-month postindex period ().
Figure 2 COPD exacerbations during the 12-month pre- and postindex periods.
Abbreviation: FEV1, forced expiratory volume in 1 second.
Health care resource utilization and costs from claims data
During the 12-month preindex period, the mean total all-cause health care costs for the low FEV1% predicted group were $22,174 (SD $28,953) compared with $19,264 (SD $24,870) for the high FEV1% predicted group (). The mean COPD-related health care costs in the preindex period were $10,623 (SD $14,027) for the low FEV1% predicted group compared with $7,425 (SD $13,064) for the high FEV1% predicted group. As expected, mean costs for each site of care (eg, hospitalization, ED visits, physician office visit, etc) were higher for patients who had at least one instance of a corresponding service when compared to the overall patient population, but the directions and patterns of the mean cost differences by low and high FEV1% predicted were similar for the study population as a whole (data not shown).
Table 3 Baseline all-cause and COPD-related health care resource utilization and costs
Overall, patients in the low FEV1% predicted group had similar all-cause HCRU as those in the high FEV1% predicted group during the baseline period. For COPD-related utilization, patients in the low FEV1% predicted group had a higher mean number of physician office visits (4.3 low group vs 3.1 high group), other outpatient services (7.9 low group vs 3.3 high group), and pharmacy claims (11.2 low group vs 6.1 high group) compared with those in the high FEV1% group (). Similarly to what was observed for costs, mean utilization for each site of care (eg, hospitalization, ED visit, physician office visit, etc) was higher for patients who had one or more instance of corresponding service when compared to that for the study population as a whole (data not shown).
During the 12-month postindex period, mean total all-cause costs were 24% higher for patients in the low FEV1% predicted group than those in the high FEV1% predicted group ($27,380 [SD $38,199] low group vs $22,075 [SD $28,108] high group; ). A greater between-group difference was observed for mean COPD-related costs, which were 56% higher in the low FEV1% predicted group compared with the high FEV1% predicted group ($15,873 [SD $29,609] low group vs $10,174 [SD $18,521] high group; ). All-cause and COPD-related costs were primarily driven by expenditures for inpatient hospitalizations, followed by medications and other outpatient services.
Table 4 12-month postindex all-cause and COPD-related health care resource utilization and costs
Follow-up all-cause health care utilization of hospitalization, ED visits, and physician office visits were similar between the low and high FEV1% predicted groups. Patients in the low FEV1% predicted group had a higher mean number of other outpatient services (27.3 [SD 25.96]) compared to the high FEV1% predicted group (21.3 [SD 19.22]). They also had higher mean prescription costs compared with the high FEV1% predicted group ($8,515 [SD $18,734] vs $5,504 [SD $9,031], respectively) ().
During the follow-up period, the low FEV1% predicted group had a higher percentage of COPD-related inpatient hospitalizations (34.0% vs 25.2%) and higher mean inpatient costs ($9,367 [SD $26,658]) vs ($6,493 [SD $17,864]) compared to the high group. The low FEV1% predicted group also had a higher mean number of physician office visits (5.4 [SD 3.91] vs 3.9 [SD 3.32]) and associated costs ($695 [SD $737] vs $491 [SD $488]), as well as a higher mean number of other outpatient visits (11.2 [SD 13.97] vs 4.6 [SD 7.81]) and mean costs ($2,517 [SD $9,500] vs $1,044 [SD $2,937]) compared to the high group. Pharmacy prescription utilization was higher among patients in the low FEV1% predicted group (90.9% vs 78.8%), and associated mean costs were also higher for the low FEV1% predicted group ($3,047 [SD $2,902] vs $1,883 [SD $2,029]) ().
Multivariable analysis
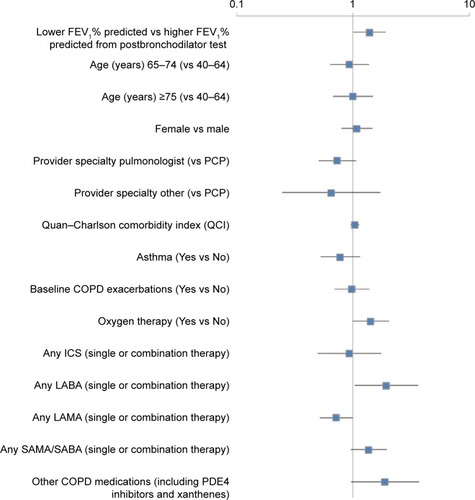
Multivariable logistic regression results indicated that any LABA use (single or combination therapy; odds ratio [OR] 1.95, 95% confidence interval [CI] 1.04–3.65; P=0.0372) and low FEV1% predicted (OR 1.39, 95% CI 1.01–1.92; P=0.0459) were predictors of COPD exacerbations (), while LAMA use (single or combination therapy) was identified as a protective factor against COPD exacerbations (OR 0.72, 95% CI 0.52–1.00; P=0.0472).
Figure 3 Factors associated with COPD exacerbations within the 12-month postindex period.
Abbreviations: FEV1, forced expiratory volume in 1 second; PCP, primary care physician; ICS, inhaled corticosteroids; LABA, long-acting β-agonist; LAMA, long-acting muscarinic agent; SAMA, short-acting muscarinic antagonist; SABA, short-acting (inhaled) β2-adrenergic agonist; PDE4 inhibitors, phosphodiesterase-4 inhibitors.
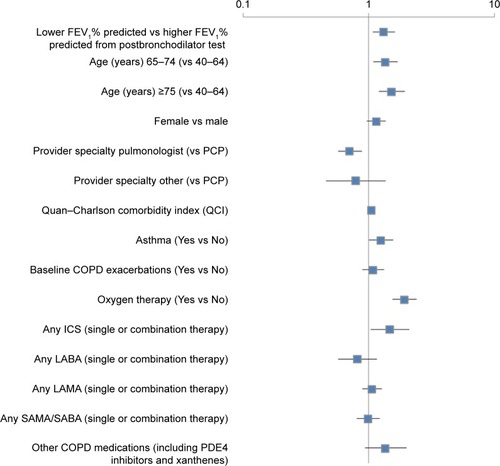
Results from the cost analyses using generalized linear models with gamma distribution and log link showed that age 65–74 years (coefficient 0.31, standard error [SE] 0.11; P=0.0066) or 75 years or older (coefficient 0.43, SE 0.12; P=0.0003), higher Quan–Charlson Comorbidity Index score (coefficient 0.05, SE 0.02; P=0.0248), asthma (coefficient 0.23, SE 0.11; P=0.0480), oxygen therapy (coefficient 0.66, SE 0.11; P<0.0001), any ICS (coefficient 0.39, SE 0.18; P=0.0291), and low FEV1% predicted (coefficient 0.28, SE 0.10; P=0.0064) were positively associated with COPD-related costs. Pulmonologist as provider specialty (coefficient −0.34, SE 0.11; P=0.0018) was significantly associated with lower COPD-related costs compared to primary care physicians (). However, low/high FEV1% predicted was not a significant predictor for all-cause health care costs (data not shown).
Figure 4 Factors associated with COPD-related health care costs within the 12-month postindex period.
Abbreviations: FEV1, forced expiratory volume in 1 second; PCP, primary care physician; ICS, inhaled corticosteroids; LABA, long-acting β-agonist; LAMA, long-acting muscarinic agent; SAMA, short-acting muscarinic antagonist; SABA, short-acting (inhaled) β2-adrenergic agonists; PDE4 inhibitors, phosphodiesterase-4 inhibitors.
Discussion
This observational study presents real-world information on the demographic, clinical, and economic profiles of patients with COPD. Our results suggest that patients with low baseline FEV1% predicted levels tend to have greater utilization of COPD medications, more COPD exacerbations, and higher COPD-related health care costs compared with patients having high baseline FEV1% predicted levels. Additionally, multivariable modeling showed that having a low baseline FEV1% predicted level was a significant predictor of COPD exacerbations and higher COPD-related health care costs.
A significant proportion (15%–20%) of COPD patients also have a clinical diagnosis of asthma.Citation33–Citation36 Patients who met all study inclusion criteria and had a diagnosis of asthma were included in the study to reflect real-world practice.
The prevalence of any COPD exacerbations was higher in the low FEV1% predicted group than in the high FEV1% predicted group for both the 12-month preindex and 12-month postindex periods. Patients in the low FEV1% predicted group had greater COPD-related costs than those in the high FEV1% predicted group during both the baseline and follow-up periods. Within the 12-month postindex period, patients in the low FEV1% predicted group had greater COPD-related utilization, including inpatient hospitalizations, physician office visits, other outpatient services, and pharmacy claims and associated costs. These findings are consistent with previous research, which demonstrated improvements in FEV1% predicted were significantly related to a decrease in COPD symptoms, as well as reduced COPD exacerbations and rescue-medication use.Citation7,Citation8,Citation11,Citation13–Citation15 In contrast to findings from previous studies using only administrative claims data,Citation37–Citation41 our results, which included both a claims-based COPD exacerbation indicator and an FEV1 status indicator from medical records, showed that in analyses that included both variables, prior claims-based exacerbations were no longer significantly associated with postindex exacerbations when FEV1 status was included in multivariable analyses.
Multivariable modeling identified LAMAs (single or combination therapy) as predictive of fewer COPD exacerbations, which is consistent with clinical studies supporting the efficacy of LAMAs in reducing COPD exacerbations.Citation42–Citation45 Conversely, the multivariable analyses identified LABAs (single or combination therapy) as predictive of COPD exacerbations, a result likely due to indication bias that ICS–LABA combinations are likely to be prescribed to more severe COPD patients or those with a history of exacerbations,Citation43,Citation46 and the vast majority (96.6%) of patients on baseline LABA therapies were taking ICS–LABA combination therapies in this study. Additionally, several studies identified LAMAs to be the superior therapy over LABAs, when compared, in decreasing the risk for moderate-to-severe COPD exacerbations.Citation42–Citation45
By using both administrative claims and medical records from a large US managed-care population, this study describes the impact of lung function on HCRU and costs in a real-world population. While it has been well established that poor lung function is correlated with increased symptoms and exacerbations,Citation7–Citation17 and that exacerbations are associated with increased costs,Citation16,Citation17 the study results expand upon previous findings of the relationship between clinically determined lung function measured by spirometry, HCRU, and costs using more recent data compared to previous studies.Citation18–Citation30 The study results confirm that lung function (FEV1) may be a useful way for providers to identify and monitor respiratory impairment in COPD patients. Payers should recognize the importance of lung function as it relates to health care utilization and costs. Therefore, health plans may want to encourage providers to conduct periodic spirometry testing for optimal management of COPD patients.
The study results need to be interpreted in light of several study limitations. As with all claims-based analyses, the study results may not be generalizable to patients with other types of health insurance or those living outside the US, because all study participants were members of a large US commercial health plan. Data were obtained from administrative claims, which are primarily intended for reimbursement rather than research purposes. The claims may have contained undetected coding errors, incomplete claims, unreliable clinical coding, or other unobservable factors that may have influenced the study outcomes.
There are also limitations associated with the use of medical record data. A high proportion of patients were excluded from the analyses because they had no spirometry results documented in their medical records during the observation period, despite having a medical claim indicating a spirometry test. Because spirometry is the most objective means of measuring COPD severity and is required for confirmation of a COPD diagnosis,Citation10 and patients had at least one medical claim for a spirometry test during the medical record review period, the lack of spirometry results may be a reflection of incomplete record-keeping or documentation issues rather than an indication that spirometry tests were not performed. Also, other issues involving use of medical records include missing medical records, the inability to locate needed information in the medical record, and vague, incomplete, or illegible medical records. In addition, data collected from medical record abstractions may contain measurement errors due to inconsistent coding of data into categories and mistakes in transcription of information from medical records to a computer database. Furthermore, facilities that provided medical records may be different from those that did not respond to requests or refused to participate.
Finally, several limitations were related to the study design. Data were collected at one point in time (ie, changes in postbronchodilator FEV1% predicted over time were not captured). In addition, FEV1 measurements may not be comparable, since they are highly variable and may be influenced by a number of technical and measurement factors and seasonal and diurnal variation, which may not be controlled for using the observational study design. Lastly, the patient cohort was stratified into two groups (high [mild or moderate] vs low [severe or very severe]) instead of four groups according to the classification of severity of airflow limitation in COPD specified in the 2014 GOLD report.Citation2 However, in this study sample, we did not expect significant clinical and cost differences between the mild and moderate groups or severe and very severe groups based on our exploration of the data.
Conclusion
Real-world data demonstrate that patients with COPD who have low FEV1% predicted levels use more COPD medications, have more COPD exacerbations, and incur higher COPD-related health care costs than patients with COPD who have high FEV1% predicted levels. Health plans should encourage spirometry testing by providers as a means of monitoring respiratory impairment of patients with COPD to improve the management of their care.
Acknowledgments
The authors gratefully acknowledge Cheryl Jones, Health-Core Inc. for editorial assistance, and Abhishek Kavati, Novartis Pharmaceuticals Corporation for his insightful suggestions for the manuscript.
Supplementary materials
Figure S1 Claim-based sample identification process.
Note: *Index date, date of first medical claim for spirometry during intake period from July 1, 2012 to June 30, 2013.
Abbreviation: ED, emergency department.
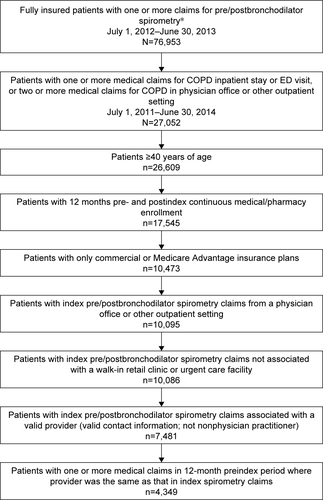
Figure S2 Medical record sample identification process.
Note: *Medical records received after medical record abstraction cutoff date.
Abbreviations: FEV1, forced expiratory volume in 1 second; FVC, forced vital capacity.
Disclosure
The authors report no conflicts of interest in this work.
References
- DewarMCurryRWJrChronic obstructive pulmonary disease: diagnostic considerationsAm Fam Physician200673466967616506711
- Global Initiative for Chronic Obstructive Lung DiseaseGlobal Strategy for the Diagnosis, Management and Prevention of COPDBethesda (MD)GOLD2014
- HoogendoornMFeenstraTLHoogenveenRTAlMMolkenMRAssociation between lung function and exacerbation frequency in patients with COPDInt J Chron Obstruct Pulmon Dis2010543544421191438
- JonesPWHealth status measurement in chronic obstructive pulmonary diseaseThorax2001561188088711641515
- SolemCTSunSXLiuSComparison of disease-severity measures within severe and very severe COPD patients: results from a nationally representative chart review and patient surveyInt J Chron Obstruct Pulmon Dis2014999199825284999
- WestwoodMBourbeauJJonesPWCerulliACapkun-NiggliGWorthyGRelationship between FEV1 change and patient-reported outcomes in randomised trials of inhaled bronchodilators for stable COPD: a systematic reviewRespir Res2011124021477298
- AnzuetoALeimerIKestenSImpact of frequency of COPD exacerbations on pulmonary function, health status and clinical outcomesInt J Chron Obstruct Pulmon Dis2009424525119657398
- GroenewegenKHPostmaDSHopWCIncreased systemic inflammation is a risk factor for COPD exacerbationsChest2008133235035718198263
- GudmundssonGGislasonTJansonCRisk factors for rehospitalisation in COPD: role of health status, anxiety and depressionEur Respir J200526341441916135721
- GudmundssonGGislasonTLindbergEMortality in COPD patients discharged from hospital: the role of treatment and co-morbidityRespir Res2006710916914029
- JonesPWDonohueJFNedelmanJPascoeSPinaultGLassenCCorrelating changes in lung function with patient outcomes in chronic obstructive pulmonary disease: a pooled analysisRespir Res20111216122206353
- ManninoDMDavisKJLung function decline and outcomes in an elderly populationThorax200661647247716517577
- McGloneSVennAWaltersEHWood-BakerRPhysical activity, spirometry and quality-of-life in chronic obstructive pulmonary diseaseCOPD200632838817175670
- NiewoehnerDERelation of chronic obstructive pulmonary disease exacerbations to FEV(1) – an intricate tangoRespiration200977222923518840996
- OmataMWakabayashiRKudohSKidaKCorrelation between bronchodilator responsiveness and quality of life in chronic obstructive pulmonary diseaseAllergol Int2007561152217259805
- SeemungalTADonaldsonGCBhowmikAJeffriesDJWedzichaJATime course and recovery of exacerbations in patients with chronic obstructive pulmonary diseaseAm J Respir Crit Care Med200016151608161310806163
- YuAPYangHWuEQSetyawanJMocarskiMBlumSIncremental third-party costs associated with COPD exacerbations: a retrospective claims analysisJ Med Econ201114331532321500975
- JanssonSAAnderssonFBorgSEricssonAJönssonELundbäckBCosts of COPD in Sweden according to disease severityChest200212261994200212475838
- JanssonSABackmanHStenlingALindbergARönmarkELundbäckBHealth economic costs of COPD in Sweden by disease severity – has it changed during a ten years period?Respir Med2013107121931193823910072
- ChungKKimKJungJPatterns and determinants of COPD-related healthcare utilization by severity of airway obstruction in KoreaBMC Pulm Med2014142724571796
- DiezJMGarridoPCCarballoMGDeterminants and predictors of the cost of COPD in primary care: a Spanish perspectiveInt J Chron Obstruct Pulmon Dis20083470171219281084
- HillemanDEDewanNMaleskerMFriedmanMPharmacoeconomic evaluation of COPDChest200011851278128511083675
- KolevaDMortterliniNBanfiPGarattiniLHealthcare costs of COPD in Italian referral centres: a prospective studyRespir Med2007101112312232017681461
- LacasseYDaigleJMMartinSKMaltaisFValidity of chronic obstructive pulmonary disease diagnoses in a large administrative databaseCan Respir J2012192e5e922536584
- Maleki-YazdiMKellySMLamSSMarinMBarbeauMWalkerVThe burden of illness in patients with moderate to severe chronic obstructive pulmonary disease in CanadaCan Respir J201219531932423061077
- MapelDWMcMillanGPFrostFJPredicting the costs of managing patients with chronic pulmonary diseaseRespir Med200599101325133316140232
- MapelDWRobertsMSpirometry, the St. George’s Respiratory Questionnaire, and other clinical measures as predictors of medical costs and COPD exacerbation events in a prospective cohortSouthwest Respir Crit Care Chron201531019
- MennPHeinrichJHuberRMDirect medical costs of COPD – an excess cost approach based on two population-based studiesRespir Med2012106454054822100535
- MiravitllesMMurioCGuerreroTGisbertRCosts of chronic bronchitis and COPD: a 1-year follow-up studyChest2003123378479112628879
- NielsenRJohannessenAOmenaasERBakkePSAskildsenJEGulsvikAExcessive costs of COPD in ever-smokers: a longitudinal community studyRespir Med2011105348549321030232
- QuanHSundararajanVHalfonPCoding algorithms for defining comorbidities in ICD-9-CM and ICD-10 administrative dataMed Care200543111130113916224307
- Bureau of Labor StatisticsDatabases, tables & calculators by subject Available from: http://data.bls.gov/timeseries/CUUR0000SAM?output_view=pct_12mthsAccessed September 10, 2015
- ManninoDMGagnonRCPettyTLLydickEObstructive lung disease and low lung function in adults in the United States: data from the National Health and Nutrition Examination Survey, 1988–1994Arch Intern Med2000160111683168910847262
- LouieSZekiAASchivoMThe asthma-chronic obstructive pulmonary disease overlap syndrome: pharmacotherapeutic considerationsExpert Rev Clin Pharmacol20136219721923473596
- McDonaldVMSimpsonJLHigginsIGibsonPGMultidimensional assessment of older people with asthma and COPD: clinical management and health statusAge Ageing2011401424921087988
- SorianoJBDavisKJColemanBVisickGManninoDPrideNBThe proportional Venn diagram of obstructive lung disease: two approximations from the United States and the United KingdomChest2003124247448112907531
- BakerCLZouKHSuJRisk assessment of readmissions following an initial COPD-related hospitalizationInt J Chron Obstruct Pulmon Dis2013855155924348031
- BlasiFCesanaGContiSThe clinical and economic impact of exacerbations of chronic obstructive pulmonary disease: a cohort of hospitalized patientsPLoS One201496e10122824971791
- FanVSRamseySDMakeBJMartinezFJPhysiologic variables and functional status independently predict COPD hospitalizations and emergency department visits in patients with severe COPDCOPD200741293917364675
- HurstJRVestboJAnzuetoASusceptibility to exacerbation in chronic obstructive pulmonary diseaseN Engl J Med2010363121128113820843247
- SuissaSDell’AnielloSErnstPLong-term natural history of chronic obstructive pulmonary disease: severe exacerbations and mortalityThorax2012671195796322684094
- AaronSDManagement and prevention of exacerbations of COPDBMJ2014349g523725245156
- AgustiACalverleyPMDecramerMStockleyRAWedzichaJAPrevention of exacerbations in chronic obstructive pulmonary disease: knowns and unknownsChronic Obstr Pulm Dis (Miami)201412166184
- DecramerMLChapmanKRDahlROnce-daily indacaterol versus tiotropium for patients with severe chronic obstructive pulmonary disease (INVIGORATE): a randomised, blinded, parallel-group studyLancet Respir Med20131752453324461613
- VogelmeierCHedererBGlaabTTiotropium versus salmeterol for the prevention of exacerbations of COPDN Engl J Med2011364121093110321428765
- DrivenesEOstremAMelbyeHPredictors of ICS/LABA prescribing in COPD patients: a study from general practiceBMC Fam Pract2014154224597538