
Abstract
Introduction
High-intensity noninvasive ventilation (NIV) has been shown to improve outcomes in stable chronic obstructive pulmonary disease patients. However, there is insufficient knowledge about whether with this more controlled ventilatory mode optimal respiratory muscle unloading is provided without an increase in patient–ventilator asynchrony (PVA).
Patients and methods
Ten chronic obstructive pulmonary disease patients on home mechanical ventilation were included. Four different ventilatory settings were investigated in each patient in random order, each for 15 min, varying the inspiratory positive airway pressure and backup breathing frequency. With surface electromyography (EMG), activities of the intercostal muscles, diaphragm, and scalene muscles were determined. Furthermore, pressure tracings were derived simultaneously in order to assess PVA.
Results
Compared to spontaneous breathing, the most pronounced decrease in EMG activity was achieved with the high-pressure settings. Adding a high breathing frequency did reduce EMG activity per breath, while the decrease in EMG activity over 1 min was comparable with the high-pressure, low-frequency setting. With high backup breathing frequencies less breaths were pressure supported (25% vs 97%). PVAs occurred more frequently with the low-frequency settings (P=0.017).
Conclusion
High-intensity NIV might provide optimal unloading of respiratory muscles, without undue increases in PVA.
Introduction
Chronic obstructive pulmonary disease (COPD) is a chronic disease with a high mortality and morbidity worldwide.Citation1 Patients with end-stage COPD frequently develop chronic hypercapnic respiratory failure (CHRF), which is associated with end of life. In that stage of disease, treatment options are limited.
Long-term application of intermittent noninvasive ventilation (NIV) in stable hypercapnic COPD patients has long been controversial.Citation2–Citation8 However, with the introduction of high-intensity NIV, ie, the use of higher inspiratory positive airway pressure (IPAP) levels in combination with a higher backup breathing frequency (BF), clear benefits of long-term NIV have been shown in stable COPD patients with CHRF.Citation9–Citation17
However, several issues with regard to high-intensity NIV remain unknown. For example, it is unknown what the contribution of the high IPAP levels and high backup BF is to not only the positive effects (respiratory muscle unloading, improvement in gas exchange) but also the theoretical disadvantages (such as increased hyperinflation, increased patient–ventilator asynchrony [PVA]). A small crossover trial showed that high-pressure NIV compared with high-intensity NIV did not result in less improvement in gas exchange, nor were there any differences in patient compliance.Citation18 However, respiratory muscle unloading and PVA were not assessed, patient numbers were small and drop-out substantially.
Surface respiratory electromyography (EMG) has been used by our group extensively.Citation19,Citation20 Recently it was shown that parasternal EMG can be used to assess PVA in patients initiated with home NIV.Citation21 Its noninvasive character makes the method extremely useful during NIV, also for repeated measurements.
Therefore, this study aimed to assess the degree of respiratory muscle unloading and PVA by means of surface EMG during different settings of NIV in stable hypercapnic COPD patients.
Methods
Subjects
Ten randomly selected COPD patients already instituted on home mechanical ventilation (HMV) were included. At the time of the study, 65 COPD patients with CHRF were ventilated noninvasively by our HMV center of the University Medical Center Groningen, with COPD being a minority of the HMV patients in the Netherlands. Characteristics of the included patients were similar compared to the other COPD patients on NIV in our center. Every 3–6 months, all patients on HMV visit our outpatient clinic for a regular control visit. During these control visits different ventilatory settings with varying pressures and breathing frequencies are regularly checked, as was done in the included patients. Because this titration is part of regular control visits, and the measurements performed are noninvasive and without any risk, ethical approval was deemed to be not necessary by the Medical Ethical Committee of the University Medical Center Groningen. Patients were asked beforehand by telephone if they agreed that an EMG measurement would be added to the regular protocol and were informed about the purpose of this measurement. Completion of testing is deemed to be agreement of consent from all participants. Patients already instituted on NIV were chosen, so excessive loading/asynchronies because of being not accustomed to the mask or machine were prevented. All patients were originally instituted on NIV because of stable COPD with CHRF (PaCO2 >6.0 kPa in stable condition, pH >7.35, no exacerbation in the previous month).
Experimental protocol and ventilatory settings
Four different settings were investigated in each patient, as we do in regular care. The only difference was that, for study purposes, these settings were investigated systematically and in random order. Settings were investigated for 15 min in random order, with 10 min spontaneous breathing in between the ventilation periods to return to baseline level.
Four different settings were investigated in each patient:
low-pressure, low-frequency NIV (LPLF: IPAP at least 10 cm H2O lower compared to the high pressure, with a maximum of 20 cm H2O; BF 10 breaths/min)
high-pressure, low-frequency NIV (HPLF: IPAP >25 and ≤34 cm H2O; BF 10 breaths/min)
low-pressure, high-frequency NIV (LPHF: IPAP at least 10 cm H2O lower compared to the high pressure, with a maximum of 20 cm H2O; BF 2 breaths/min above the patients’ own spontaneous BF)
high-pressure, high-frequency NIV (HPHF: IPAP highest tolerable level, ie, between 25 and 34 cm H2O; BF 2 breaths/min above the patients’ own spontaneous BF).
Expiratory positive airway pressure (EPAP) is regularly titrated in our center in order to overcome upper airway obstructive events with a minimum EPAP of 4 cm H2O. Because this study did not have the aim to investigate different EPAP levels too, EPAP was left at the EPAP used by the patients at home.
All patients were tested with their own home ventilator (BiPAP Synchrony®, Respironics, Philips, the Netherlands, in 3 patients and BIPAP Trilogy®, Respironics Trilogy 202®, Philips, the Netherlands, in 7 patients), in the spontaneous timed mode. Inspiration time was set at the shortest time without loss of patient comfort as we routinely do (mean inspiration time: 0.93 s [range 0.8–1.0 s]). Rise time is regularly set at the shortest level as possible, and was left at the home setting during the different settings (median 1.0) (the quickest rise time possible at the ventilator used [range 1.0–4.0]). Triggers were set at the Auto-Track algorithm of both ventilators, adjusting to changing breathing patterns and dynamic leaks. All patients were ventilated with a full face mask.
To test reproducibility of the measurement, all patients were investigated twice according to exactly the same protocol, so that in total 4×10×2=80 periods (20 periods per setting) were investigated.
Measurements
Electromyography
Electrical activity of the scalene muscles (Sc), intercostal muscles (Int), and diaphragm (Dia) were derived from transcutaneous electrodes (DEMCON - Macawi Respiratory Systems BV, Enschede, the Netherlands).Citation19,Citation20
Electrode placement
To obtain electrical activity of the Intercostal muscles, the electrodes were placed bilaterally in the second intercostal space, about 3 cm parasternal. Frontal Dia activity was obtained from one pair of electrodes placed bilaterally at the costal margin in the nipple line. Dorsal Dia activity was measured by a pair of electrodes placed bilaterally on the same height as the frontal electrodes, below the scapulae. Scalene activity was derived from bipolar electrode pairs placed on the neck on both sides. A common (ground) electrode was placed at the level of the sternum.
Data acquisition and preprocessing
The electrodes were connected through low noise cables to the Dipha®-16 (DEMCON - Macawi Respiratory Systems BV, Enschede, the Netherlands), a battery-powered amplifier transmitting data to a transceiver USB dongle connected to a personal computer.
Electrical heart activity, which interferes with Dia EMG signals, was removed according to the process described in Figure S1 of the Supplementary materials.
EMG processing
To determine the peak and bottom values of the respiratory EMG, the averaged EMG signals were resampled at 10 Hz in streaming amplitude histograms with a time window of 30 s. Every 10 s the 5th and 95th percentiles were calculated serving as the bottom (5th) and peak (95th) values of the respiratory EMG during the previous 30 s. The differences between the peak and bottom values were reported as the mean peak-to-peak values.
All data recording, processing, analysis, and reporting were conducted by the Polybench data-acquisition and processing package (Applied Biosignals GMBH, Weener, Germany).
Gas exchange and patient comfort
Transcutaneous measurement of the PCO2 (PtCO2) and oxygen saturation was performed (TOSCA®; Linde Medical Sensors AG., Basel, Switzerland). The ear lobe senor was attached at least 10 min before the measurement session started and values as displayed during the last minute of each setting were used for analyses. Patient comfort was tested by asking the patients to rate the amount of comfort with the particular setting afterwards on a Visual Analogue Scale (VAS; 0: very uncomfortable; 10: very comfortable).
Data analysis
For analysis of the EMG activity all measurements (20 in total) were analyzed together.
EMG activity
The mean EMG activity of 10 successive breaths (mean EMG activity per breath) and the sum of the EMG activity over 1 min (EMG time product; sum activity per minute) were calculated from the last minute of EMG measurement periods (spontaneous breathing and during the different settings), excluding periods with movement artefacts. Frontal and dorsal Dia activities were summed. For comparisons between settings, the EMG Activity Ratio (EMGAR) was used, which is the ratio of peak inspiratory muscle activity during NIV and peak activity detected during spontaneous breathing (both per breath as per minute). This EMGAR was used to correct for differences in amplitude of the EMG signal between patients (eg, by different electrode to muscle distance because of a different amount of subcutaneous fat).
Control of breathing and PVA
To assess control of breathing and PVA, simultaneous EMG recordings were compared with pressure recordings. The pressure waves provided by the ventilator were measured with a pressure transducer placed between the mask and the tubes.
Breaths were counted for the full periods of the particular setting (5–12 min, with the exception of the first minute of each interval) and numbers were calculated as percentage of the total number of breaths delivered by the ventilator that were counted. Periods of coughing, talking, moving, and so on were registered and during these periods breaths were not counted to prevent false judgment of artefacts as respiratory activity.
The number of pressure-supported (Figure S2) and pressure-controlled (Figure S3) breaths were counted, including the following PVAs: ineffective efforts (Figure S4); autotriggering (Figure S5); double or multiple triggering (Figure S6); and cycling asynchronies (premature [Figure S7] and delayed cycling [Figure S8]). For detailed descriptions and examples see the Supplementary materials (Figures S2–S8).
Statistics
According to the distribution of the data, mean and standard deviation (SD) or median and ranges are presented. Differences between settings were assessed with a Friedman test for multiple related samples, with pairwise comparisons with a Wilcoxon signed rank test. Reproducibility was tested with the use of Bland and Altman plots.Citation22 Statistical analysis were conducted using SPSS (22.0) and Graphpad (Prism 6; Graphpad software, La Jolla, CA, USA).
Results
Characteristics of the 10 included patients are summarized in . The ventilatory settings investigated are summarized in .
Table 1 Patient characteristics
Table 2 The different ventilatory settings investigated and the breathing frequency adopted by the patients
EMG results
Compared to spontaneous breathing, the median EMG activity of the Int and Dia per breath was decreased during all four NIV settings. However, sum EMG activity over 1 min was only reduced with the high-pressure settings and the LPLF setting and not with the LPHF setting ().
Table 3 EMG activity per breath (average over 10 breaths) and total EMG activity in 1 min during the spontaneous breathing period before the NIV setting and during the selected NIV settings
Comparing the different settings, the decrease in respiratory muscle activity per breath was most pronounced when a high inspiratory pressure was combined with a high backup BF ().
Figure 1 EMG activity ratios (EMGARs) with the different settings are shown per breath (A) and per minute (B).
Abbreviations: EMG, electromyography; LPLF, low-pressure, low-frequency setting; HPLF, high-pressure, low-frequency setting; LPHF, low-pressure, high-frequency setting; HPHF, high-pressure, high-frequency setting; NIV, noninvasive ventilation.
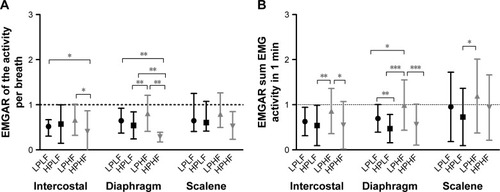
Similar trends were true for the total EMG activity calculated over 1 min. However, although the number of breaths was significantly higher with the HF settings, the total activity per minute was decreased to a similar amount with the HPHF setting compared to the HPLF setting ().
Individual EMG data
In 16 measurements, the HPHF setting was the setting with the most pronounced decrease in Dia muscle activity per breath compared to spontaneous breathing. In two measurements (of different patients), the HPLF setting was clearly more effective in reducing respiratory muscle load. Of interest, in 8 of the 16 measurements where the HPHF setting was the most effective setting in reducing respiratory muscle load per breath, the reduction in sum activty per minute was most pronounced with the HPLF setting. Also with the low frequency setting, these patients adapted to an equal pattern of control of ventilation, as the number of pressure controlled breaths was similar compared to the number of controlled breaths in the patients who had the most net effective unloading with the high frequency setting. Only 2 patients had totally or sufficiently abolished EMG activity during the HPHF setting.
Control of breaths and PVA
With low backup BF, almost all breaths were pressure supported, whereas with high-frequency settings most breaths were pressure-controlled (). There was a weak but significant correlation between the percentage of pressure-supported breaths and the Dia EMGAR per breath, indicating that in measurements with more pressure-supported breaths the decrease in EMG activity per breath with NIV compared to spontaneous breathing was less (less negative EMGAR) (r=0.34, P=0.002).
Table 4 Patient-ventilator asynchrony during different settings
A total of 19,094 breaths were analyzed for assynchrony. Triggering assynchronies were, in general, infrequent. However, triggering assynchronies occurred more in the HPLF setting compared to the other settings (). In 3 HPLF measurements, IEs occurred very frequently (in 32%, 34%, and 35% of the counted breaths). However, no difference was found in NIV efficiency (decrease in transcutaneous CO2 with this setting), decrease in EMG activity or comfort scores between these patients and the other patients. Cycling problems occurred very infrequently.
There was no relationship between the percentage of PVAs and the decrease in PtCO2, VAS scores, or decrease in respiratory muscle activity with NIV.
Gas exchange and comfort
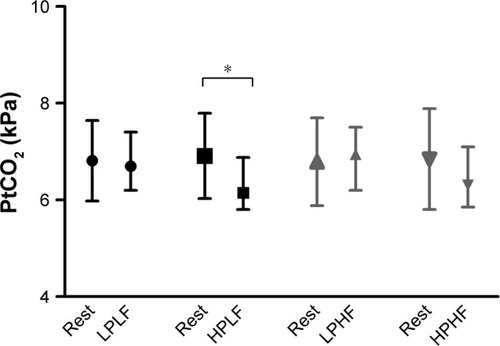
PtCO2 was only significantly decreased with HPLF ventilation compared to spontaneous breathing (). Participants judged the LPLF (median VAS score 8.2 [IQR 5.1–9.3]) and the HPHF setting (median VAS score 6.1 [IQR 4.3–8.0]) as the most comfortable, significantly more comfortable compared to the LPHF (median VAS score 4.7 [IQR 3.0–7.4]) and HPLF (median VAS score 5.3 [IQR 1.3–9.2]) setting.
Figure 2 Transcutaneous carbon dioxide pressure (PtCO2) during spontaneous breathing and with the different settings.
Abbreviations: LPLF, low-pressure/low-frequency setting; HPLF, high-pressure/low-frequency setting; LPHF, low-pressure/high-frequency setting; HPHF, high-pressure/high-frequency setting.
Reproducibility
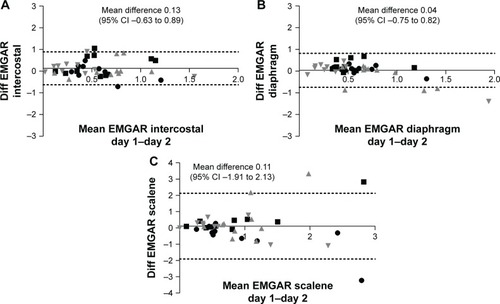
Reproducibility was moderate to good for the intercostal muscles and for the Dia, while for the Sc reproducibility was low ().
Figure 3 Reproducibility of the EMG of the intercostal muscles (A), diaphragm (B), and scalene muscles (C).
Abbreviations: EMG, electromyography; EMGAR, EMG activity ratio; LPLF, low-pressure/low-frequency setting; HPLF, high-pressure/low-frequency setting; LPHF, low-pressure/high-frequency setting; HPHF, high-pressure/high-frequency setting.
Discussion
This study shows that in patients with stable COPD and CHRF, NIV decreases respiratory EMG activity, with a clearly more pronounced reduction in activity with the use of higher inspiratory pressures. Adding a high backup BF aimed at a total control of ventilation did lead to a further decrease in EMG activity per breath. However, total activity per minute was equally decreased compared to the low-frequency setting; as in the majority of patients EMG activity was not totally abolished to trigger and to cycle breaths, also not during the HPHF setting. However, PVAs occurred more frequently with low-frequency settings, especially with the HPLF setting. The clinical relevance of the limited number of PVAs we found in our “experienced” NIV users can be questioned as the number of PVAs was low and not associated with increased respiratory muscle activity, reduced gas exchange, or discomfort experienced by the patients.
Critique of the method used
Surface EMG of the respiratory muscles has recognized limitations, such as movement artefacts and potential crosstalk from adjacent muscles. However, movement artefacts are easy to recognize, as all measurements were observed carefully by one of the investigators. Furthermore, in a resting condition, as was the case in this study, crosstalk by other chest wall muscles is believed to be minimal. Difference in electrode to muscle distance was corrected by using the EMG activity ratio, in which the EMG activity is expressed as a change in activity compared to resting breathing.Citation19
Reproducibility
The three most important respiratory muscles – the Dia, the intercostal muscles, and the Sc – were included in all measurements as the different muscles can be recruited differently under different conditions.Citation19,Citation20 It should be noticed that Dia and intercostal signals were the most stable and reproducible signals, showing in most patients a consistent decrease with NIV. Agreement between the two days was found to be less in patients who were not used to these particular settings at home. In this respect, this study acknowledges that the short periods of measurements (only 15 min) are a limitation and probably habituation might have played a role in some patients during the second measurement.
The reproducibility of the scalene signals was low across all settings. Unfortunately, scalene signals were easily disturbed, for example, by lifting the head or turning. Therefore, for future measurements this study recommends the use of intercostal and Dia signals only for measuring respiratory muscle activity during NIV.
Patient–ventilator asynchrony
PVAs counting by comparing surface EMG signals with pressure signals has recently been shown to be a reliable method.Citation21 This study primarily used the Dia signals, with an extra check by using the intercostal signals. This was done while observing the most stable, consistent signals in the Dia EMG.
Gas exchange monitoring
Transcutaneous monitoring was used to obtain an indication of the effectiveness of the settings on gas exchange. Although transcutaneous measurements have been shown to reliably reflect gas exchange at least in the chronic setting,Citation23–Citation26 it also has drawbacks: the monitor requires 10 min for equilibration, and may not reliably reflect arterial PaCO2 in some circumstances (eg, when arterialization of the ear lobe is limited). However, in this clinical practice protocol a practical and patient friendly approach was followed as is regularly done to titrate patients on NIV, with more and more use of noninvasive transcutaneous measurements. To allow equilibration, for analysis, the PtCO2 value was used during the last minute of each period. Importantly, the study accepted some drawbacks as PtCO2 was only a secondary outcome; the study did not primarily aim to investigate changes in PCO2 with different settings.
Physiological observations
Respiratory muscle activity with NIV
For more than 10 years now, the concept of using higher inspiratory pressures has been shown to bring clear benefits in terms of improvement in gas exchange, exercise tolerance, lung function, and survival.Citation9,Citation11–Citation13,Citation16,Citation17 In these studies, high pressures were combined with a high backup BF, as it was hypothesized that with a more controlled form of ventilation hypoventilation was counterbalanced most effectively and the patient was “rested” most.Citation9,Citation16 However, evidence for this high backup frequency per se is lacking, probably only a high inspiratory pressure will be sufficient to achieve benefits.
Our study shows that high inspiratory pressures indeed decrease respiratory muscle activity substantially compared to resting breathing. The effects of the addition of a high backup BF, however, is more complex. A pattern of rapid shallow breathing has been regarded beneficial in severe COPD as muscle fatigue is hypothesized to be prevented in this way.Citation27 Although the Dia of COPD patients is regarded to be adapted to chronic loading by a muscle fiber-type shift toward more oxidative type I, fatigue-resistant fibers,Citation28 it is more susceptible to sacromeric injury induced by higher inspiratory loads.Citation29 As so, the study hypothesized that a pattern of breathing with less respiratory muscle activity per breath is preferable, despite the fact that total inspiratory load per minute was equally decreased with the HPHF setting compared to the HPLF setting.
Our data also nicely show that inactivity-induced diaphragm atrophy, as has been shown to occur during controlled mechanical ventilation,Citation30 should not be feared, even not with HPHF NIV, because EMG activity and patient-triggered breaths persisted even with the HPHF setting. Furthermore, patients on home NIV always have periods of spontaneous breathing in between. Of course, this study acknowledges that measurements were done at daytime. It would be interesting to compare the settings during a full night.
Of note, the backup BF level with which individual patients reached the most reduction in EMG activity was not uniformly the HPHF setting. Choosing a too high backup frequency can lead to a short expiratory time and thereby dynamic hyperinflation, thus increasing the work of breathing.Citation31,Citation32 Therefore, it would be interesting to use our EMG to titrate the optimum BF individually in order to optimize respiratory muscle rest.
Patient–ventilator asynchrony
The prevalence of PVA in this study was moderate to low in comparison to other studies.Citation21,Citation33–Citation37 Several reasons might explain these differences. 1) The method used to detect PVA differs between the studies. This study believes that respiratory EMG being a direct parameter of respiratory drive is preferable to represent patients’ wishes, instead of an indirect parameter such as respiratory movements by bodyplethysmography or flow measurements. Recently, reliable results have been shown with the use of parasternal (intercostal) EMG.Citation21 2) The patients were long-term NIV users in stable condition, in whom PVAs were found to be considerably lower. 3) The measurements were performed at daytime, when patients were awake. In the study of Fanfulla et al no IEs were observed when patients were awake, whereas 4.7% IEs were observed while the patients were asleep.Citation38 4) Ventilatory settings influence the prevalence of PVA.Citation33,Citation37,Citation39–Citation41
The occurrence of PVA is complex and affected by both patient-related factors, such as respiratory drive, respiratory muscle strength, increased inspiratory load due to augmented airway resistance, and ventilator-related factors, such as mask leaks and ventilatory settings.Citation34 An important mechanism implicated in the genesis of PVA is dynamic hyperinflation. Dynamic hyperinflation might be a consequence of a too short expiratory time, which can be the case with high BF, or high IPAP, levels. Dynamic hyperinflation increases the work of breathing and might induce IEs, as inspiratory resistance has to be overcome before the patient can generate a negative inspiratory flow to trigger the ventilator. In this study, surprisingly, most triggering PVAs occurred during the low-frequency settings. Furthermore, this increased number of PVAs during the LF settings was caused by only a small number of patients showing a relevant number of PVAs, indicating that careful individual attention should be paid to this issue. In one patient mask leaks occurred. Mask leaks may cause ineffective efforts and autotriggering as the ventilator is unable to detect the patient’s inspiratory effort,Citation42 and delayed cycling, as the ventilator does not cycle to exhalation once the flow remains below a certain level.Citation37 However, it has also been shown that the home ventilators perform far better compared with nonhome ventilators in leak compensation.Citation33 This may be one of the reasons why PVAs were so infrequent in our cohort of patients.
In another patient, exceptionally high patient-driven BF might have resulted in dynamic hyperinflation, especially during the ST mode used in the study. In this mode the inspiratory time of patient-triggered breaths is not limited and expiratory time might become too short to exhale completely back from the high volume inflated with high inspiratory pressures used. Switching to a higher backup BF solved this problem, as most breaths became ventilator-triggered with a set (short) inspiratory time. Only one patient had a relevant incidence of double triggering (6%), with the HPLF setting. This might reflect a too high demand in comparison to the delivered minute volume, reflected by a high respiratory rate (spontaneous BF 25/min), which was, despite high pressures (IPAP 25 cm H2O), not completely met by the ventilator. This high demand was also confirmed by the fact that this was the only patient in whom EMG activity did not decrease during NIV.
In summary, COPD patients on long-term NIV are able to adjust easily to several settings of NIV, resulting in infrequent PVAs. Importantly, this study found that a high backup BF does not promote the occurrence of PVAs nor does it decrease patient satisfaction with the setting. The clinical relevance of PVAs in stable COPD patients on NIV however is questionable, as they occur in very low frequencies, and in this study, also in other studies, gas exchange, patient comfort, or overall respiratory drive was not affected. Therefore, there is no evidence that the occurrence of infrequent PVAs is a reason to change settings. In individual cases, however, it is worthy to examine PVA, as this might affect ventilatory efficiency.
Conclusion
NIV with high inspiratory pressures might be required to provide optimal respiratory muscle rest and optimal improvement in gas exchange in stable hypercapnic COPD patients. The effects of the addition of a high backup frequency on respiratory muscle unloading were individually different. On the one hand, adding a high backup might provide optimal muscle unloading, without completely controlling ventilation, and with little PVAs. On the other hand, a too high backup frequency might be disadvantageous, also with respect to respiratory muscle unloading. Further research, in a larger group of patients, is necessary to optimize the backup BF, as probably individual titration is necessary to choose its optimal setting.
Disclosure
MLD is the recipient of an European Respiratory Society Long-term Fellowship (LTRF 2014-3126). LAvE did assist with the measurements; however, his company (Inbiolab B.V.) did not have any influence on the design, conduction, or final analyses on the study. PJW has received a research grant and personal speaking fees from Philips/Respironics, the Netherlands. The other authors report no conflicts of interest in this work.
Supplementary materials
Methods
EMG data acquisition and preprocessing
Electrical heart activity, which interferes with diaphragm electromyography (EMG) signals, was removed according to the process described in Figure S1.
Control of breathing and patient–ventilator asynchrony
Control of the breaths and triggering Pressure-supported breath (Figure S2)
Pressure-supported (PS) breaths are breaths delivered by the ventilator following a trigger from the patient. By definition, a PS breath was counted once the diaphragm and/or intercostal EMG signal preceded the onset of the pressure wave.
Pressure-controlled breath (Figure S3)
Pressure-controlled (PC) breaths are breaths delivered by the ventilator without a trigger from the patient. By definition, a PC breath was counted once the diaphragm and/or intercostal EMG signal followed the onset of the pressure wave or was totally abolished.
Patient–ventilator asynchrony
We counted the following patient–ventilator asynchrony (PVAs): ineffective efforts (Figure S4); autotriggering (Figure S5); double or multiple triggering (Figure S6); and cycling asynchronies (premature [Figure S7] and delayed cycling [Figure S8]).
Figure S1 The QRS removal process.
Notes: The averaged EMG (EMGa) shows respiratory activity. As control the signal from the abdominal magnetometer band (Band) is shown. From the diaphragmatic EMG signal (EMGd), the QRS complex was detected and stretched into a standard QRS pulse with a duration of 100 ms (QRS). During the QRS pulse a cut was made in the slightly delayed (40 ms) EMG signal to completely filter out the QRS complex (EMGg). Next, the gated EMG was rectified and averaged with a moving time window of 200 ms. Finally, the missing signal in the gate was filled with the running average resulting in a fairly good interpolation during the gate and an almost QRS-free averaged EMG signal (EMGa).
Abbreviation: EMG, electromyography.
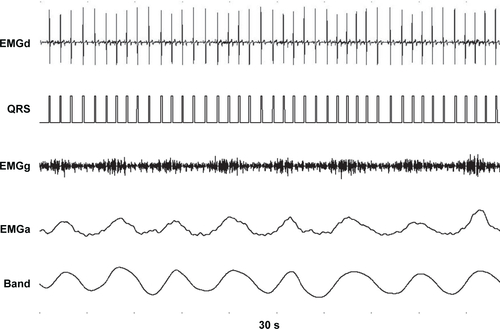
Figure S2 A pressure-supported (PS) breath.
Notes: Shown are (from top to bottom) the raw intercostal signal (Int raw), the raw frontal diaphragm signal (F Dia raw), the raw dorsal diaphragm signal (D Dia raw), the pressure wave (Paw), the average intercostal signal (Interc), the average frontal diaphragm (F Dia) signal, and the average dorsal diaphragm signal (D Dia). Two PS breaths are shown, as electromyography activity (the dotted red line) precedes the pressure wave (the straight blue line). A low backup frequency of 10 breaths/min was set on the ventilator, therefore a 2.6 s time in-between the breaths confirms that breaths were PS and not pressure-controlled (PC).
Abbreviation: EMG, electromyography.
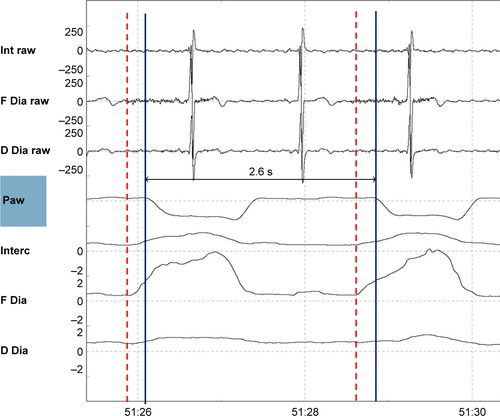
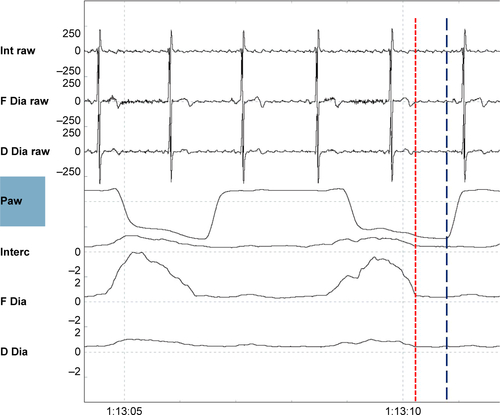
Figure S3 A pressure-controlled (PC) breath.
Notes: Shown are (from top to bottom) the raw intercostal signal (Int raw), the raw frontal diaphragm signal (F Dia raw), the raw dorsal diaphragm signal (D Dia raw), the pressure wave (Paw), the average intercostal signal (Interc), the average frontal diaphragm (F Dia) signal, and the average dorsal diaphragm signal (D Dia). Two PC breaths are shown, electromyography activity (the dotted red line) appears but after the pressure wave (the straight blue line) started. This is a tracing during a high-pressure, high-frequency setting, with a backup frequency of 22 breaths/min, so that an in-between breath time of 2.7 s means that the ventilator delivers a breath at the moment it is supposed to do according to the set-up backup frequency. Of note, electromyography activity was much lower with this setting.
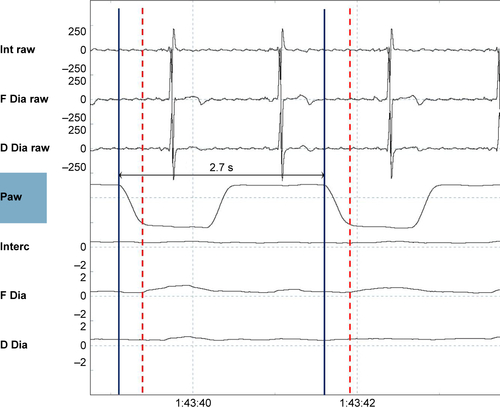
Figure S4 An ineffective effort.
Notes: Shown are (from top to bottom) the raw intercostal signal (Int raw), the raw frontal diaphragm signal (F Dia raw), the raw dorsal diaphragm signal (D Dia raw), the pressure wave (Paw), the average intercostal signal (Interc), the average frontal diaphragm (F Dia) signal, and the average dorsal diaphragm signal (D Dia). An electromyography signal (dotted red line) was not followed by a breath delivered by the ventilator (straight arrow blue line).
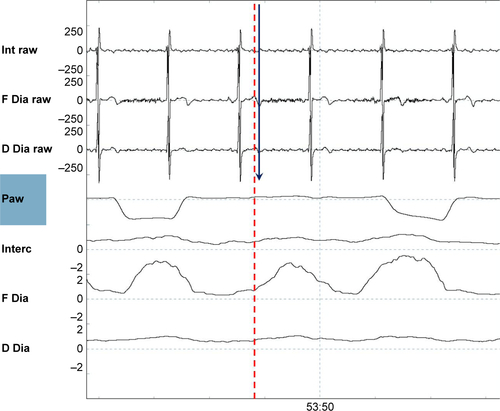
Figure S5 Autotriggering.
Notes: Shown are (from top to bottom) the raw intercostal signal (Int raw), the raw frontal diaphragm signal (F Dia raw), the raw dorsal diaphragm signal (D Dia raw), the pressure wave (Paw), the average intercostal signal (Interc), the average frontal diaphragm (F Dia) signal, and the average dorsal diaphragm signal (D Dia). During this low-frequency setting (backup frequency 10 breaths/min), the two breaths denoted by arrows come too soon to be PC. As it is not preceded by EMG activity, these are defined as inappropriate autotriggered breaths (straight blue lines).
Abbreviations: EMG, electromyography; PC, pressure-controlled.
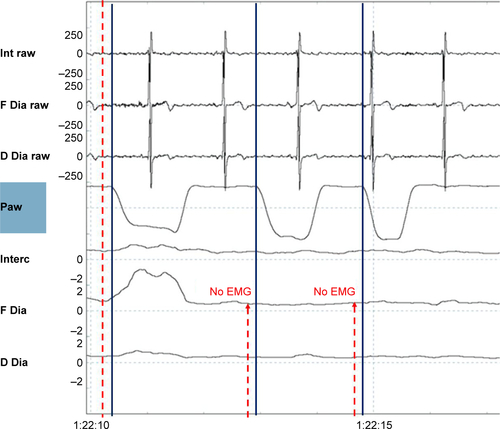
Figure S6 Double triggering.
Notes: Shown are (from top to bottom) the raw intercostal signal (Int raw), the raw frontal diaphragm signal (F Dia raw), the raw dorsal diaphragm signal (D Dia raw), the pressure wave (Paw), the average intercostal signal (Interc), the average frontal diaphragm (F Dia) signal, and the average dorsal diaphragm signal (D Dia). A single electromyography wave (dotted red line) is followed by two ventilator delivered breaths (nr.1 and nr.2 straight blue lines).
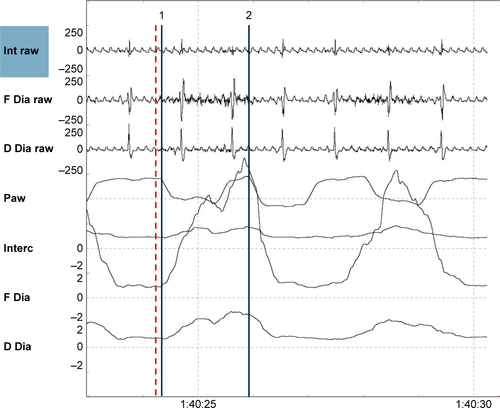
Figure S7 Premature cycling.
Notes: Shown are (from top to bottom) the raw intercostal signal (Int raw), the raw frontal diaphragm signal (F Dia raw), the raw dorsal diaphragm signal (D Dia raw), the pressure wave (Paw), the average intercostal signal (Interc), the average frontal diaphragm (F Dia) signal, and the average dorsal diaphragm signal (D Dia). Electromyography activity (the maximum of the electromyography is depicted by the red dotted line) continues, while the pressure returns to baseline again (the end of the inspiratory pressure delivering is depicted by the blue dotted line).
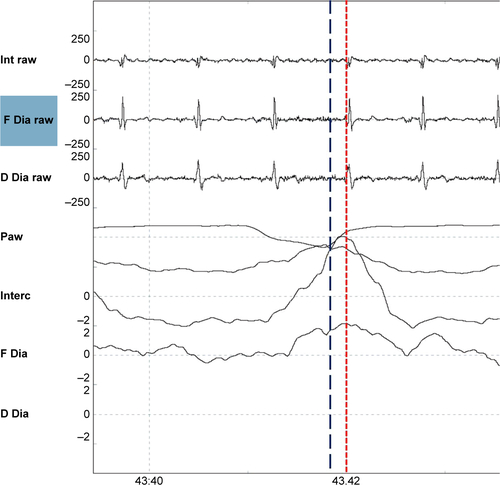
Figure S8 Delayed cycling.
Notes: Shown are (from top to bottom) the raw intercostal signal (Int raw), the raw frontal diaphragm signal (F Dia raw), the raw dorsal diaphragm signal (D Dia raw), the pressure wave (Paw), the average intercostal signal (Interc), the average frontal diaphragm (F Dia) signal, and the average dorsal diaphragm signal (D Dia). The electromyography activity has already ceased (end of the electromyography activity depicted by the red dotted line), while the pressure wave continues, (end of the breaths depicted by the straight blue line).
References
- LopezADShibuyaKRaoCChronic obstructive pulmonary disease: Current burden and future projectionsEur Respir J200627239741216452599
- CasanovaCCelliBRTostLLong-term controlled trial of nocturnal nasal positive pressure ventilation in patients with severe COPDChest200011861582159011115443
- CliniESturaniCRossiAThe Italian multicentre study on noninvasive ventilation in chronic obstructive pulmonary disease patientsEur Respir J200220352953812358325
- LinCCComparison between nocturnal nasal positive pressure ventilation combined with oxygen therapy and oxygen monotherapy in patients with severe COPDAm J Respir Crit Care Med19961542 Pt 13533588756806
- McEvoyRDPierceRJHillmanDNocturnal non-invasive nasal ventilation in stable hypercapnic COPD: a randomised controlled trialThorax200964756156619213769
- StruikFMLacasseYGoldsteinRSKerstjensHAWijkstraPJNocturnal noninvasive positive pressure ventilation in stable COPD: A systematic review and individual patient data meta-analysisRespir Med2014108232933724157199
- StrumpfDAMillmanRPCarlisleCCNocturnal positive-pressure ventilation via nasal mask in patients with severe chronic obstructive pulmonary diseaseAm Rev Respir Dis19911446123412391741532
- Meecham JonesDJPaulEAJonesPWWedzichaJANasal pressure support ventilation plus oxygen compared with oxygen therapy alone in hypercapnic COPDAm J Respir Crit Care Med199515225385447633704
- DreherMStorreJHSchmoorCWindischWHigh-intensity versus low-intensity non-invasive ventilation in patients with stable hypercapnic COPD: a randomised crossover trialThorax201065430330820388753
- DreherMEkkernkampEWalterspacherSNoninvasive ventilation in COPD: impact of inspiratory pressure levels on sleep qualityChest2011140493994521565967
- DuivermanMLWempeJBBladderGNocturnal non-invasive ventilation in addition to rehabilitation in hypercapnic patients with COPDThorax200863121052105718710905
- DuivermanMLWempeJBBladderGTwo-year home-based nocturnal noninvasive ventilation added to rehabilitation in chronic obstructive pulmonary disease patients: a randomized controlled trialRespir Res20111211221861914
- KohnleinTWindischWKohlerDNon-invasive positive pressure ventilation for the treatment of severe stable chronic obstructive pulmonary disease: a prospective, multicentre, randomised, controlled clinical trialLancet Respir Med20142969870525066329
- WindischWStorreJHKohnleinTNocturnal non-invasive positive pressure ventilation for COPDExpert Rev Respir Med20159329530825896807
- WindischWDreherMStorreJHSorichterSNocturnal non-invasive positive pressure ventilation: physiological effects on spontaneous breathingRespir Physiol Neurobiol20061502–325126015990366
- WindischWKosticSDreherMVirchowJCJrSorichterSOutcome of patients with stable COPD receiving controlled noninvasive positive pressure ventilation aimed at a maximal reduction of pa(CO2)Chest2005128265766216100151
- WindischWVogelMSorichterSNormocapnia during nIPPV in chronic hypercapnic COPD reduces subsequent spontaneous PaCO2Respir Med200296857257912195837
- MurphyPBBrignallKMoxhamJPolkeyMIDavidsonACHartNHigh pressure versus high intensity noninvasive ventilation in stable hypercapnic chronic obstructive pulmonary disease: a randomized crossover trialInt J Chron Obstruct Pulmon Dis2012781181823271905
- DuivermanMLvan EykernLAVennikPWKoeterGHMaarsinghEJWijkstraPJReproducibility and responsiveness of a noninvasive EMG technique of the respiratory muscles in COPD patients and in healthy subjectsJ Appl Physiol (1985)20049651723172914660508
- DuivermanMLde BoerEWvan EykernLARespiratory muscle activity and dyspnea during exercise in chronic obstructive pulmonary diseaseRespir Physiol Neurobiol2009167219520019406254
- RamsayMMandalSSuhESParasternal electromyography to determine the relationship between patient-ventilator asynchrony and nocturnal gas exchange during home mechanical ventilation set-upThorax2015701094695226197816
- BlandJMAltmanDGCalculating correlation coefficients with repeated observations: part 2 – correlation between subjectsBMJ199531069806337703752
- StorreJHSteurerBKabitzHJDreherMWindischWTranscutaneous PCO2 monitoring during initiation of noninvasive ventilationChest200713261810181618079217
- StorreJHMagnetFSDreherMWindischWTranscutaneous monitoring as a replacement for arterial PCO(2) monitoring during nocturnal non-invasive ventilationRespir Med2011105114315021030230
- MagnetFSWindischWStorreJHMonitoring of pCO2 during ventilationMed Klin Intensivmed Notfmed2016111320220727048842
- HazenbergAZijlstraJGKerstjensHAWijkstraPJValidation of a transcutaneous CO(2) monitor in adult patients with chronic respiratory failureRespiration201181324224621242669
- GoriniMSpinelliAGinanniRDurantiRGigliottiFScanoGNeural respiratory drive and neuromuscular coupling in patients with chronic obstructive pulmonary disease (COPD)Chest1990985117911862225964
- LevineSNguyenTKaiserLRHuman diaphragm remodeling associated with chronic obstructive pulmonary disease: clinical implicationsAm J Respir Crit Care Med2003168670671312857719
- OttenheijmCAHeunksLMDekhuijzenPNDiaphragm muscle fiber dysfunction in chronic obstructive pulmonary disease: toward a pathophysiological conceptAm J Respir Crit Care Med2007175121233124017413128
- KabitzHJWindischWSchonhoferBUnderstanding ventilator-induced diaphragmatic dysfunction (VIDD): progress and advancesPneumologie201367843544123818292
- CooperCBCalligaroGLQuinnMMDeterminants of dynamic hyperinflation during metronome-paced tachypnea in COPD and normal subjectsRespir Physiol Neurobiol2014190768023994176
- VassilakopoulosTZakynthinosSRoussosCThe tension-time index and the frequency/tidal volume ratio are the major pathophysiologic determinants of weaning failure and successAm J Respir Crit Care Med199815823783859700110
- CarteauxGLyazidiACordoba-IzquierdoAPatient-ventilator asynchrony during noninvasive ventilation: a bench and clinical studyChest2012142236737622406958
- NavaSBruschiCFracchiaCBraschiARubiniFPatient-ventilator interaction and inspiratory effort during pressure support ventilation in patients with different pathologiesEur Respir J19971011771839032512
- PankowWBeckerHKohlerUSchneiderHPenzelTPeterJHPatient-ventilator interaction during noninvasive pressure supported spontaneous respiration in patients with hypercapnic COPDPneumologie200155171211236359
- ThilleAWRodriguezPCabelloBLelloucheFBrochardLPatient-ventilator asynchrony during assisted mechanical ventilationIntensive Care Med200632101515152216896854
- VignauxLTassauxDCarteauxGPerformance of noninvasive ventilation algorithms on ICU ventilators during pressure support: a clinical studyIntensive Care Med201036122053205920689921
- FanfullaFTaurinoAELupoNDTrentinRD’AmbrosioCNavaSEffect of sleep on patient/ventilator asynchrony in patients undergoing chronic non-invasive mechanical ventilationRespir Med200710181702170717448652
- JollietPTassauxDClinical review: patient-ventilator interaction in chronic obstructive pulmonary diseaseCrit Care200610623617096868
- ThilleAWCabelloBGaliaFLyazidiABrochardLReduction of patient-ventilator asynchrony by reducing tidal volume during pressure-support ventilationIntensive Care Med20083481477148618437356
- LeungPJubranATobinMJComparison of assisted ventilator modes on triggering, patient effort, and dyspneaAm J Respir Crit Care Med19971556194019489196100
- FaurouxBLerouxKDesmaraisGPerformance of ventilators for noninvasive positive-pressure ventilation in childrenEur Respir J20083161300130718321932