
Abstract
Purpose
This study aims to investigate the renal protective effect of glucagon-like peptide 1 receptor agonist (GLP-1RA) on improving renal tubular damage in diabetic kidney disease (DKD) and to explore the potential mechanism of GLP-1RA on renal tubular protection.
Methods
Long-acting GLP-1RA was used to treat DKD mice for 12 weeks. The label-free quantitative proteomic analysis of renal proteins was conducted to explore the differentially expressed proteins (DEPs) in the renal tissues of the control, DKD and GLP-1RA groups. The DEPs and markers of renal tubular injury were verified by qPCR in vivo and in vitro. The expression of glucagon-likepeptide-1 receptor (GLP-1R) in renal tubules was determined by immunofluorescence staining.
Results
GLP-1RA treatment significantly improved the tubular damages in kidney tissues of DKD mice and mTEC cells stimulated by high glucose (HG). Proteomics analysis revealed that 30 proteins in kidney tissue were differentially expressed among three groups. Seminal vesicle secretory protein 6 (SVS6) was the most differentially expressed protein in kidney tissues among three groups of mice. The expression changes of Svs6 mRNA in vitro and in vivo detected by qPCR were consistent with the results of proteomic analysis. Furthermore, reduction of Svs6 expression by SVS6 siRNA could attenuate HG-stimulated tubular injury in mTEC cells. Immunofluorescence staining also found that GLP-1R was widely expressed in renal tubules in vitro and in vivo.
Conclusion
GLP-1RA significantly improved renal tubular damage in DKD mice. SVS6 may be a potential therapeutic target for GLP-1RA in the treatment of DKD.
Introduction
Diabetes Mellitus (DM) is recognized as a metabolic disorder characterized by hyperglycemia, which is caused by absolute or relative deficiency of insulin, and can affect people at different life stages.Citation1 Diabetic kidney disease (DKD) is the most common microvascular complication of DM, and the main cause of chronic kidney disease and end-stage renal disease worldwide.Citation2,Citation3 The underlying pathogenesis of DKD is complex and multifactorial, including glycolipid metabolism disorder, oxidative stress, inflammatory response, autophagy and genetic factors.Citation4 The clinical diagnostic criteria of DKD are defined as persistent proteinuria and decreased glomerular filtration rate (eGFR).Citation5,Citation6 These alterations are associated with the production and composition of the extracellular matrix, leading to thickening of the glomerular basement membrane and expansion of the mesangial matrix, ultimately developing into glomerular hypertrophy and glomerulosclerosis.Citation4,Citation6
Previous studies have mainly focused on glomerular lesions in the progression of DKD. However, increasing evidence has changed our traditional understanding of DKD, that is, in addition to glomerular damage, tubular interstitial damage is also closely related to the development of DKD.Citation7–9 Under the stimulation of high glucose, a series of pathological changes such as renal tubular and interstitial thickening, renal tubular atrophy, interstitial inflammation and fibrosis may occur in the proximal renal tubules, which accelerate renal failure.Citation10,Citation11 A series of clinical and experimental studies have concluded that renal proximal tubules play a major role in the development of early initial albuminuria in DKD.Citation7,Citation12 Therefore, in the process of inhibiting the occurrence and development of DKD, diabetic tubulopathy must be concerned as much as diabetic glomerulopathy.
Glucagon-like peptide 1 (GLP-1) is mainly secreted by L cells in the intestine, which stimulates insulin secretion and inhibits glucagon secretion in response to food intake.Citation13 Other effects of GLP-1 include inhibiting food intake, retarding gastric emptying, limiting weight gain, lowering blood pressure, and reducing postprandial triglyceride and free fatty acid concentrations.Citation14 Glucagon-like peptide-1 receptor agonist (GLP-1RA) is a novel type of anti-diabetic drug with the potential to prevent and treat DKD.Citation13 GLP-1RAs may play an indirect renal protective effect by improving the traditional risk factors for DKD, such as blood glucose control, weight loss and blood pressure reduction.Citation15 Moreover, it has been reported that glucagon-like peptide-1 receptor (GLP-1R) is widely expressed in the glomeruli and proximal tubules.Citation16,Citation17 GLP-1RAs may also have a direct effect on DKD, including proximal tubular natriuretic stimulation, cAMP/PKA signaling regulation, and renin angiotensin system inhibition.Citation15 Exenatide-loaded microsphere, a long-acting GLP-1RA, has a good regulatory effect on blood glucose and body weight by prolonging the stimulation of GLP-1R.Citation18,Citation19 Accumulating data have indicated that Exendin-4 exerts a beneficial effect on DKD by acting on GLP-1R.Citation20,Citation21 Recent clinical trials have demonstrated that Exenatide-loaded microspheres reduced albuminuria by 26% in patients with type 2 diabetes mellitus (T2DM) compared with non-GLP-1RA group, independent of their blood glucose-lowering effect.Citation22 Most of previous studies have mainly investigated the glomerular damage in DM models and the mitigation effect of GLP-1RA on the glomerular injury, often neglecting its impact on renal tubular injury.Citation23–25 There are very few literatures suggesting that GLP-1RA also has a therapeutic effect on renal tubular injury. For example, the administration of Exendin-4 significantly alleviated renal tubular damage in DM mice induced by streptozotocin (STZ), which was shown to reduce the infiltration of macrophages and inhibit the production of chemokines in renal tubular cells.Citation21
However, so far, the research on the therapeutic effect of GLP-1RA on renal tubular damage of DKD is still very limited. At the same time, the molecular mechanism of the protective effect of GLP-1RA on the renal tubules of DKD is still inconclusive. Therefore, we evaluated the therapeutic effect of GLP-1RA on renal tubular injury in DKD mice, and investigated the potential effects of GLP-1RA on the proteomics of the kidney in DKD mice, providing a favorable clue for finding possible therapeutic targets for DKD.
Materials and Methods
Animal
Eight-week-old male C57BL/6J mice (n=30) were obtained from Model Animal Research Center of Nanjing University and housed in Laboratory Animal Center at Tongji University Hubei Campus. All mice were maintained under stable conditions in the specific pathogen-free (SPF) environment (temperature: 21 ± 4◦C, humidity: 55 ± 20%, 12/12 light-dark cycle). After 1 week of adaptation, mice were randomly divided into 3 groups: control group (n=10), DKD group (n=10) and GLP-1RA treated group (n=10, GLP-1RA group).
Mice in control group were fed with a normal chow diet containing 10% Kcal fat (Puluteng Biotech, China). Mice in DKD and GLP-1RA group were fed with a high fat diet (HFD) containing 42% Kcal fat (Puluteng Biotech, China). After 4 weeks, all HFD-fed mice were intraperitoneally injected with STZ (100mg/kg; Sigma Aldrich, USA) freshly diluted in sodium citrate buffer (0.1M, pH 4.5; Solarbio, China); mice of control mice were intraperitoneally injected with an equal amount of sodium citrate buffer. One week after STZ injection, fasting blood glucose level ≥11.1mmol/L was defined as successful models of T2DM. Mice with T2DM were fed with HFD for another 6 weeks to construct DKD models according to the previous study.Citation26 Then, mice in GLP-1RA group were intraperitoneally injected Exenatide-loaded microspheres once a week (10mg/kg/w; Eli Lilly, USA) for 12 weeks; mice in control group and DKD group were intraperitoneally injected with an equal amount of saline for 12 weeks (). During this period, mice in DKD group and GLP-1RA group continued to be fed with HFD, and fasting blood-glucose and body weight were monitored weekly. Immediately after the above 12 weeks, the three groups of mice were placed in metabolic cages and urine was collected for 24 hours. Next, the blood and kidney samples were collected and stored at − 80 °C. All animal experiments were approved by the Animal Ethics Committee of Tongji Hospital, Tongji University School of Medicine (2021-DW-(003)). This study was conducted in accordance with the Guide for the Care and Use of Laboratory Animals (NIH Publication, 8th Edition, 2011), and Animal Research: Reporting of In Vivo Experiments Guidelines. All international, national, and/or institutional guidelines applicable to the care and use of animals were followed.
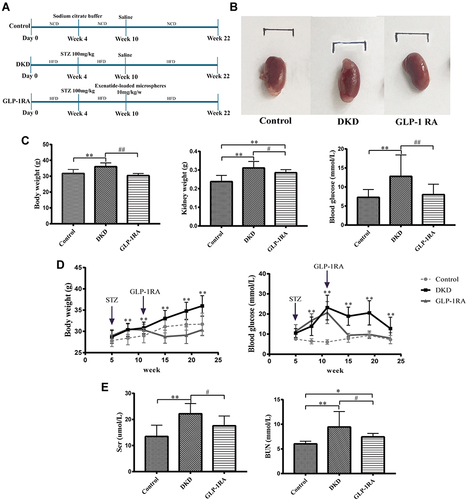
Figure 1 GLP-1RA reduces body weight, lowers blood glucose, and improves kidney function. (A) Schematic presentation of the experimental design and protocol. (B) The gross appearance of the kidney among three groups. (C) Body weight, kidney weight and blood glucose of mice among three groups (n = 10). (D) Comparison of body weight and blood glucose of mice among three groups in different periods (n = 10). (E) Scr and BUN of mice among three groups (n = 10). Data are expressed as mean ± SD, *P<0.05, **P<0.01 vs control group; #P<0.05, ##P<0.01 vs DKD group.
Cell Culture
Murine kidney proximal tubular epithelial (mTEC) cells, a gift from Department of Nephrology, Tongji Hospital were cultured in Dulbecco’s modified Eagle’s medium (DMEM) (Gibco, USA) with 10% FBS (Gibco, USA) and 1% penicillin/streptomycin (KeyGEN, China). Cells were incubated in an incubator with 5% CO2 at 37°C, and passaged every 3–5 days. The culture medium was replaced every 2 days. When mTEC cells were seeded at ~60% confluence in 6-well plates, they were harvested overnight and subsequently exposed to 5.5mM glucose (NG group), 30 mM glucose (HG group) and 30 mM glucose with 10nM Exenatide (GLP-1RA group) for an additional 48h.Citation20
For cell transfection, specific SVS6 siRNA, and negative control siRNA (Sangon Biotech, China) were transfected into mTEC cells at 20μM concentration in 6-well plates for 48h by using Lipofectamine™ 3000 reagent (Invitrogen, USA) according to the manufacturer’s protocol. mTEC cells were divided into the following groups: 1) control group (5.5mM glucose + negative control siRNA); 2) HG group (30 mM glucose + negative control siRNA); 3) GLP-1RA group (30 mM glucose with 10nM Exenatide + negative control siRNA); 4) HG+si-SVS6 (30 mM glucose+ specific SVS6 siRNA).
Biochemical Measurements
After fasting for at least 12h, blood samples were collected from all mice. Serum creatinine (Scr) and blood uric nitrogen (BUN) were measured at the central clinical laboratory of Tongji Hospital using fully automatic biochemical analyzer (PUZS-300X, Perlong, China). The levels of urine KIM-1 were measured using an enzyme-linked immunosorbent assay (ELISA) kit (CUSABIO, USA) according to the manufacturer’s instructions.
Histological Analysis
Kidney tissues were embedded in paraffin and sectioned for staining. Hematoxylin and Eosin (H&E), Periodic Acid-Silver Methenamine (PASM) and periodic acid-Schiff (PAS) staining were used to observe the morphological changes of kidney. To examine the effect of GLP-1RA on glomerular cross-sectional area, mesangial area and tubular injury area, PASM and PAS-stained kidney sections were analyzed respectively. Six mice were randomly selected from each group, and 20 glomeruli were randomly selected from each mouse for mesangial expansion assessment. Twenty cortico-medullary areas in each section were randomly assessed for tubulointerstitial lesions on a scale of 0 to 3. 0, normal; 1, less than 25% of the tubular area is injured; 2, 26–50% of the tubular area is injured; and 3, >50% of the tubular area is injured.Citation27 The evaluation of the mesangial area percentage (%) and the analysis of the area percentage (%) of the damaged renal tubular area were performed using Image-Pro Plus 6.0 software (Media Cybernetics, USA). The kidney sections were also stained with Sirius Red to assess the level of renal fibrosis. A semi-quantitative analysis of the collagen area on the Sirius Red stained sections was performed by Image-Pro Plus 6.0 software (Media Cybernetics, USA).
Immunofluorescence
Immunofluorescence staining technique was performed as previously described.Citation28 Kidney sections, ovary sections and mTEC cells were stained with GLP-1R antibody (NBP1-97308, Novus Biologicals, USA) overnight at 4°C, followed by incubation with Alexa-488 goat anti-rabbit (#111-545-003, Jackson ImmunoResearch, USA). Then, the sections were counterstained with DAPI-staining-solution (Boster, USA), and the images were captured using inverted optical microscope (Nikon, Japan).
Label-Free Quantification (LFQ)-Based Proteomics Analysis
Protein Extraction and Trypsin Digestion
Kidney tissues of three mice in each group were lysed to extract protein, and bicinchoninic acid (BCA) protein assay kit (Beyotime, China) was used for protein quantification according to manufacturer’s instructions. About 200μg protein of each sample was trypsinized using filter aided proteome preparation (FASP) method.Citation29 The peptide was desalted on C18 cartridge, concentrated by vacuum centrifugation, re-dissolved with 40μL, 0.1% formic acid solution, and quantified (OD280).
LC-MS/MS Analysis
The enzymatic hydrolysates were analyzed by LC-MS/MS analysis, as previously reported.Citation30 Each sample was separated by high-performance liquid chromatography (HPLC) in an Easy nLC system (Proxeon Biosystems). The chromatographic column was balanced with 95% liquid A (0.1% formic acid). The samples were automatically transferred to the loading column (Thermo Scientific Acclaim PepMap100, 100μm*2cm, nanoViper C18), separated by the analytical column (Thermo scientific EASY column, 10cm, ID75μm, 3μm, C18-A2) at a constant flow rate of 300 nL/min, and eluted with liquid B (0.1% formic acid in 84% acetonitrile) in different gradients. The eluted peptides were introduced into Q-Exactive mass spectrometer (MS) instrument (Thermo Fisher Scientific, USA). The instrument parameters were set as follows: the MS1 resolution ratio, 70,000 at 200 m/z; automatic gain control target (AGC), 1e6; maximum injection time (IT), 50ms; dynamic exclusion, 60s. The mass-to-charge ratio of polypeptides and fragments was collected as follows: 20 pieces of atlas were collected after each full scan (MS2 scan), MS2 activation type, high energy collisional dissociation (HCD); Isolation window, 2 m/z; The MS2 resolution ratio, 17,500 at 200 m/z; Normalized collision energy, 30eV; Underfill, 0.1%.
Bioinformatics Analysis
The original data collected by LC-MS/MS were RAW files, and MaxQuant software (version 1.5.3.17) was used for database identification and data quantitative analysis.Citation31 The mass tolerance for MS1 was 10 ppm. The cut-off of false discovery rate (FDR) was 1% for both proteins and peptides. The quantitative information of the target protein dataset was normalized (normalized to the interval of (−1,1)) in order to assess the homogeneity of the designated groups. The data were analyzed with at least three valid values in each group. The protein expression level increased by 1 fold or decreased by 1 fold, indicating the difference among groups was significant (P<0.05). To generate a hierarchical clustering heatmap, the Complex heatmap R package (R Version 3.4) was used to classify the two dimensions of the sample and protein expression simultaneously (distance algorithm: Euclid; linkage method: average linkage). Venn diagrams were generated using a more flexible tool named InteractiVenn, which is a web-based tool for the analysis of sets. Gene ontology (GO, https://www.blast2go.com/) was used to determine the function of proteins. GO annotations were classified into the following three categories: biological process (BP), molecular function (MF), and cell population points (CC). Pathway analysis of proteins was conducted through the Kyoto Encyclopedia of Genes and Genomes (KEGG, https://www.kegg.jp/). Fisher’s exact test was used to compare the distribution of GO classification and KEGG pathway in the target protein dataset and the total protein dataset. Enrichment analysis was performed on GO annotations and KEGG pathway annotations in the target protein dataset.
Quantitative Real-Time PCR (qPCR)
Total RNA was extracted from kidney tissues and mTEC cells using a TRIzol reagent (Invitrogen, USA). RNA quality was measured using a NanoDrop ND-1000 spectrophotometer (Thermo Fisher Scientific, USA). Approximately 500 ng RNA was converted into 10ul cDNA using a reverse transcription kit (Takara RR037A, Japan), according to the manufacturer’s protocol. QPCR reaction systems were prepared with SYBR® Premix Ex TaqTM (TAKARA RR820A, Japan) using a QuantStudio7Flex System (ABI, USA). The cDNA was diluted 10 times with RNase-free ddH2O.
The reaction mixture was configured according to the following components: TB GreenTM Premix Ex Taq II 5μL; PCR Forward Primer (10μM) 0.2μL; PCR Reverse Primer (10μM) 0.2μL; ROX Dye II 0.2μL; cDNA 2uL; ddH2O 2.4uL. The amplification conditions were set as follows: 95°C for 30 sec, followed by 40 cycles of 95°C for 5 sec, 60°C for 30 sec, and 72°C for 30 sec. Primer sequences were listed in . Expression levels of mRNA were quantified by the 2−ΔΔCt method. Gapdh was used as an internal control for mRNAs.
Table 1 Gene-Specific Primers for qPCR Analysis
Statistical Analysis
All statistical analyses were performed with SPSS software version 22.0 (IBM, USA). All data were presented as mean ± standard deviation (SD). One-way analysis of variance (ANOVA) followed by LSD’s post hoc test or Dunnett’s T3 post hoc multiple comparison test was performed to compare the significant differences among three groups. P-values < 0.05 was set as statistical significance.
Results
GLP-1RA Reduces Body Weight, Lowers Blood Glucose, and Improves Kidney Function
The gross appearance of kidney is shown in . The body weight, the kidney weight and blood glucose were all significantly increased in DKD mice compared with controls, while they were all dramatically reduced after GLP-1RA treatment ( and ). In addition, Scr and BUN were obviously elevated in DKD group compared to the control group, whereas they were significantly decreased after GLP-1RA treatment ().
GLP-1RA Improves Renal Tubular Injury in DKD Mice and mTEC Cells Stimulated by High Glucose
Glomerular mesangial damage and renal tubular injury were observed under the microscope by H&E, PASM and PAS staining. Glomerular mesangial expansion, disordered arrangement of renal tubular epithelial cells and vacuolar degeneration were significant in DKD mice compared with the control mice. In contrast, GLP-1RA treatment significantly inhibited mesangial expansion and improved tubular injury in DKD mice ().
Figure 2 GLP-1RA improves renal tubular injury in DKD mice. (A–C) H&E staining (A), PASM staining (B) and PAS staining (C) of kidney sections among three groups (×200) (n=6). (D–F) Relative quantification of the mesangial expansion (D), renal tubular injury area (%) (E) and renal tubular injury score (F) in the kidney among three groups. (G) The mRNA expression of Fabp1, Kim-1, Ngal and Sglt2 in kidney tissues among three groups (n=10). (H) Urine KIM-1 levels among three groups (n=10). (I) The mRNA expression of Fabp1, Kim-1, Ngal and Sglt2 in mTEC cells among three groups (n=10). (J) Sirius Red staining of kidney sections among three groups (×200) (n=3). (K) Collagen fiber area (%) among three groups (n=6). (L) The mRNA expression of Col1a1, Col3a1 and Fn1 in kidney tissues among three groups (n=10). Data are expressed as mean ± SD, *P<0.05, **P<0.01 vs control group; #P<0.05, ##P<0.01 vs DKD group.
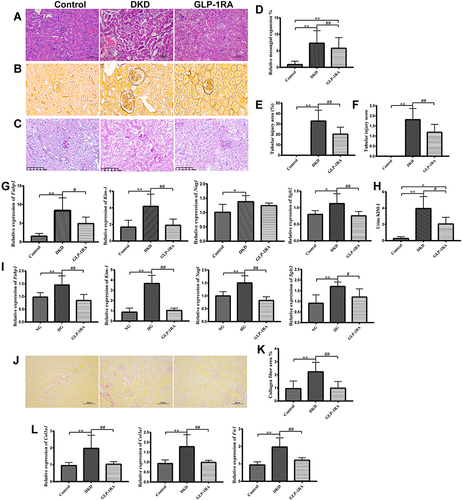
To further explore the therapeutic effect of GLP-1RA on renal tubular damage, we also detected the mRNA expression of renal tubular damage markers in DKD mice, such as fatty acid binding protein 1 (FABP1), kidney injury molecule-1 (KIM-1), neutrophil gelatinase-associated lipocalin (NGAL) and sodium-glucose co-transporter 2 (SGLT2). QPCR showed that the mRNA levels of Fabp1, Kim-1, Ngal and Sglt2 in renal tissues of DKD mice were significantly higher than those of control mice, and GLP-1RA treatment dramatically reduced the expression of Fabp1, Kim-1 and Sglt2 in DKD mice (). Meanwhile, the changes of KIM-1 levels in the urine of the three groups of mice were consistent with the gene expression changes of Kim-1 in the kidney tissues of mice among the three groups (). In addition, the mRNA levels of Fabp1, Kim-1, Ngal and Sglt2 in mTEC cells stimulated by high glucose (HG) were significantly elevated compared with the control group, whereas they were significantly reduced after GLP-1RA treatment (). Our results indicated that GLP-1RA can significantly improve diabetic renal tubular damage in vivo and in vitro.
Furthermore, the analysis of the results from Sirius red staining indicated that the renal collagen deposition was dramatically increased in DKD group compared with controls, whereas it was significantly decreased after GLP-1RA treatment ( and ). The mRNA expressions of collagen type I alpha 1 chain (Col1a1), collagen type III alpha 1 chain (Col3a1) and fibronectin 1 (Fn1) were significantly up-regulated in renal tissues of the DKD group compared to the control group, whereas they were significantly down-regulated after GLP-1RA treatment, indicating that GLP-1RA treatment significantly ameliorates renal collagen deposition in DKD mice ().
Identification of Significant Differentially Expressed Proteins (DEPs) in Kidney of Mice Among Three Groups by LFQ-Based Proteomic Analysis
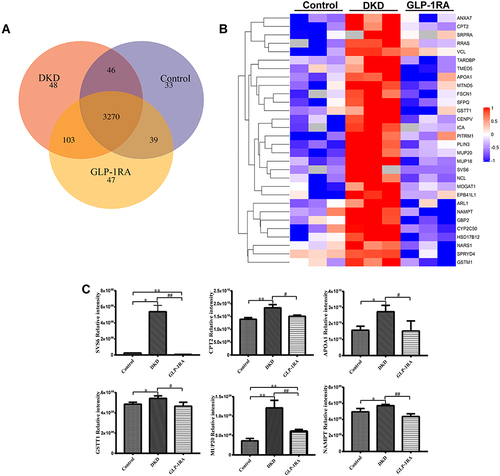
To explore the therapeutic mechanism of GLP-1RA on DKD mice, LFQ proteomics analysis was performed to detect the differentially expressed proteins (DEPs) in the kidneys of mice from the control, DKD and GLP-1RA groups. Protein identification indicated that a total of 3270 common proteins were observed in the kidneys of three groups (). To investigate the potential target proteins of GLP-1RA in the treatment of DKD, fold change (FC) > 1 (up-regulation> 1 or down-regulation < 1) and P value <0.05 were applied to define DEPs among the control, DKD and GLP-1RA groups. A heatmap was presented to show that 30 proteins significantly up-regulated in the kidneys of DKD group compared with the control group, while these proteins were significantly down-regulated in the GLP-RA group (). Seminal vesicle secretory protein 6 (SVS6) was the most significant differentially expressed protein among the three groups. In the results of proteomics analysis, the protein expression levels of SVS6, carnitine palmitoyl transferase 2 (CPT2), apolipoprotein A1 (APOA1), glutathione S-transferase theta 1 (GSTT1), major urinary protein 20 (MUP20), and nicotinamide phosphoribosyl transferase (NAMPT) in the kidney of mice among three groups are shown in . To further analyze the functions of these 30 DEPs, we performed GO annotations analysis (Figure S1A and B and Supplementary table 1). GO annotations were classified into three categories: BP, CC and MF. In the BP category, the most abundant DEPs were contained in cellular process, metabolic process and biological regulation. In the CC category, DEPs were mainly involved in the cell, cell part and organelle. In the MF category, DEPs displayed enrichment in binding and catalytic activity. In order to further understand the pathway information of these 30 DEPs, KEGG enrichment analysis was performed. The results of KEGG indicated that the majority of the DEPs were involved in chemical carcinogenesis, fatty acid metabolism and glutathione metabolism.
Figure 3 Identification of significant differentially expressed proteins (DEPs) in kidney of mice among three groups by LFQ-based proteomic analysis. (A) Venn diagram for overlapping proteins of the kidney among three groups (n=3). (B) Heatmap for the comparison of the DEPs among three groups (n=3). Red represents significantly up-regulated proteins, blue represents significantly down-regulated proteins, and gray represents no protein quantitative information. (C) The protein expression levels of SVS6, CPT2, APOA1, CSTT1, MUP20, and NAMPT in the kidney of mice among three groups were measured by proteomics analysis (n=3). Data are expressed as mean ± SD, *P<0.05, **P<0.01 vs control group; #P<0.05, ##P<0.01 vs DKD group.
Validation of DEPs Among Three Groups of Renal Tissues and mTEC Cells by qPCR
QPCR analysis was used to verify the mRNA expression level of DEPs analyzed by the proteomics in vivo and in vitro. The results of qPCR showed that mRNA expressions of Svs6, Cpt2, Apoa1, Gstt1, Mup20, and Nampt were significantly increased in the kidneys of DKD group compared with the control group, whereas elevated expressions of Svs6, Cpt2, Apoa1, Gstt1 and Mup20 in renal tissues of the DKD mice were all dramatically decreased after GLP-1RA treatment. There was no significantly difference in the expression of Nampt between the DKD group and GLP-1RA group (). The qPCR verification results of the above DEPs in vivo were similar to the proteomics results. We also verified the mRNA expression levels of the above DEPs in three groups of mTEC cells, including the control group, HG group and GLP-1RA group. However, only the expression changes of Svs6 in the three groups of mTEC cells was consistent with the proteomics results (). As there is no commercial antibody of SVS6, the protein expression of SVS6 has not been verified by Western blot.
Figure 4 Validation of DEPs by qPCR in vivo and in vitro. (A) The mRNA expression of Svs6, Cpt2, Apoa1, Cstt1, Mup20, and Nampt in the kidney of mice among three groups was measured by qPCR (n = 10). (B) The mRNA expression of Svs6, Cpt2, Apoa1, Cstt1, Mup20, and Nampt in mTEC cells among three groups was measured by qPCR (n = 10). (C) The mRNA expression of Svs6 in mTEC cells after transfection with si-SVS6 by qPCR (n=10). (D) The mRNA expression of Kim-1, Ngal and Sglt2 in mTEC cells among NG group, HG group, GLP-1RA group and HG+si-SVS6 group (n=10). Data are expressed as mean ± SD, *P<0.05, **P<0.01 vs control group; #P<0.05, ##P<0.01 vs DKD group or HG group.
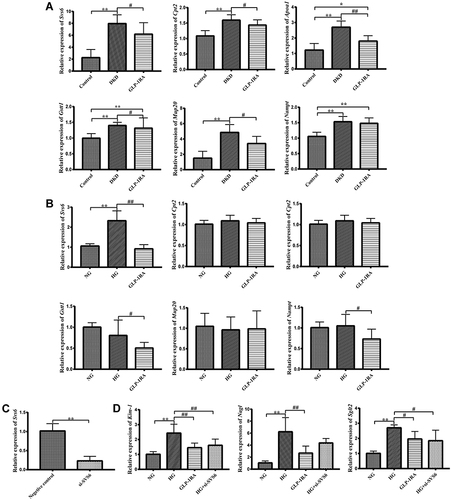
In addition, mRNA expressions of Kim-1 and Sglt2 in the HG+si-SVS6 group were significantly lower than those in the HG group, while mRNA expression of Nagl in the HG+Si-SVS6 group showed a downward trend compared with the HG group (no statistical difference). Besides, there was no significant difference in the above renal tubular injury markers between the HG+ Si-SVS6 group and the GLP-1RA group ( and ). Therefore, we speculated that reduction of SVS6 expression could alleviate HG-induced tubular injury in mTEC cells.
GLP-1R is Widely Expressed in Both Glomeruli and Renal Tubules of Mice
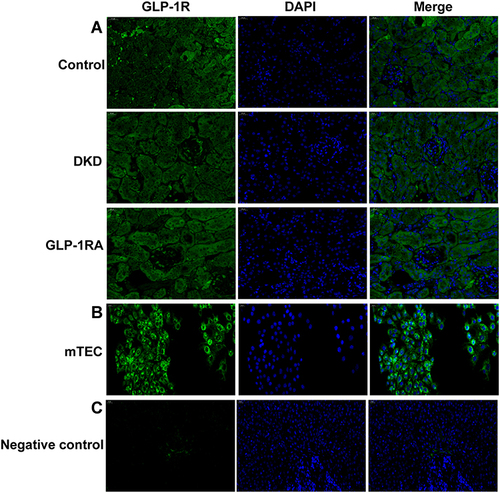
To explore whether GLP-1RA can directly acts on renal tubules through GLP-1R, we determined the expression of GLP-1R in the kidney of mice among three groups by immunofluorescence staining (). We found that GLP-1R was widespread expressed in the kidney of mice (including glomeruli and renal tubules) (). To further investigated the GLP-1R expression in renal tubules, we detected the expression of GLP-1R in mTEC cells (). Our data confirmed the widespread expression of GLP-1R in murine renal tubules in vitro (). The expression of GLP-1R in the ovary of mice was detected as a negative control according to a network bioinformatics tool (https://www.proteinatlas.org/) ().
Figure 5 GLP-1R is widely expressed in renal tubules of mice and mTEC cells. (A) Immunofluorescence staining of GLP-1R (green) was performed on the kidney sections of mice in the three groups (n = 3) (400×). (B) Immunofluorescence staining of GLP-1R (green) was performed on the mTEC cells (n = 3) (200×). (C) Immunofluorescence staining of GLP-1R (green) was performed on the ovary sections of mice as a negative control (n = 3) (400×).
Discussion
DKD complicates the course of numerous diabetic patients, imposes a huge economic burden on the family and society, and even increases the mortality of diabetic patients.Citation3,Citation32 Although studies have shown that GLP-1RA may be beneficial to DKD through direct or indirect effects on the kidney, the specific mechanism remains unclear.Citation15 Therefore, exploring the potential renal protection mechanism of GLP-1RA is of great significance for the effective treatment of DKD. In this study, a DKD mouse model induced by HFD combined with STZ was used. Our results showed that compared with the controls, the blood glucose, body weight, kidney weight, Scr and BUN were significantly increased in DKD group. In addition, mice in the DKD group showed significant mesangial expansion compared to the control group. According to the criteria for animal models of DKD developed by the Animal Models of Diabetic Complication Consortium (AMDCC),Citation33 we successfully established a mouse model of DKD. Our results also confirmed that GLP-1RA treatment significantly reduced blood glucose, body weight, kidney weight, Scr and BUN in DKD mice. Meanwhile, GLP-1RA treatment also dramatically improved the mesangial dilatation of DKD mice.
We also observed a series of structural changes in renal tubules of DKD mice, such as the disordered arrangement of renal tubular epithelial cells, vacuolar degeneration and tubular interstitial fibrosis. In addition, the mRNA levels of Fabp1, Kim-1, Ngal and Sglt2, which are key markers of renal tubular injury, in the kidneys of DKD group were significantly higher than those of the control group. Moreover, gene expressions of the above four renal tubular injury markers of mTEC cells were also significantly increased by high glucose stimulation. Therefore, we suggest that in addition to glomerular lesions, renal tubular damage also plays an important role in the pathogenesis of DKD. Several previous studies have suggested the importance of renal tubular injury in the pathogenesis of DKD. Gilbert et alCitation10 emphasized the non-glomerular mechanism, especially tubular cell damage, in the pathogenesis of DKD, and indicated that renal tubular lesion could more accurately predict the changes in DKD renal function than glomerular damage. Moreover, Tang et alCitation34 proposed the concept of diabetic renal tubulopathy (DT), and suggested that tubulointerstitial injury in DKD was more serious than glomerular lesions, which possibly due to the multiple chemokines and injury signal factors secreted by the proximal tubular epithelial cells (PTECs), eventually lead to progressive interstitial inflammation and fibrosis. Therefore, renal tubular injury may become a new target for the therapy of DKD.Citation6
Previous in vitro studies have demonstrated that hyperglycemia exerts both proinflammatory (via interleukin 6 and monocyte chemoattractant protein-1) and profibrotic effects (via the transforming growth factor-beta) on PTECs,Citation35,Citation36 which are partly mediated via mitogen-activated protein kinase (MAPK) and protein kinase C (PKC) signaling.Citation35 Besides, other studies have revealed showed that HG induced renal tubular cell injury may be due to reduced autophagy.Citation37 Autophagy maintains the homeostasis and cell survival by degrading damaged organelles, so reduction or lack of autophagy may ultimately lead to cellular damage.Citation37 Meanwhile, overexpression of Klotho could dramatically enhance autophagy and AMP-activated protein kinase (AMPK) and extracellular signal-regulated kinase 1/2 (ERK1/2) activities in kidney tissues of T2DM mice induced by HFD/STZ and HG-induced PTECs.Citation37 In addition, bone morphogenetic protein 7 (BMP7) has been reported to inhibit advanced glycation end products (AGEs)-induced oxidative stress and multiple inflammatory signaling pathways, including p38 and p44/42 MAPK in PTECs.Citation38 However, so far, the molecular mechanism of renal tubular damage of DKD has not been fully determined.
Recently, GLP-1RA, an effective hypoglycemic agent, has been reported to have renal protection function in patients with T2DM.Citation15 Our research showed that GLP-1RA treatment significantly improved renal tubular injury and tubulointerstitial fibrosis in DKD mice. Moreover, qPCR demonstrated that GLP-1RA could reduce the expression of renal tubule damage markers (Fabp1, Kim-1 and Sglt2) in the kidneys of DKD mice. In addition, our immunofluorescence staining confirmed the presence of GLP-1R in mouse glomeruli and renal tubules. Therefore, we speculated that GLP-1RA might improve renal function, renal tubular injury and fibrosis by directly acting on GLP-1R in renal tubules. A small amount of previous literature has revealed the effect of GLP-1RA on diabetic renal tubular damage. Serap et alCitation21 observed that kidney damage mainly occurred in the renal tubule area of STZ-induced diabetic BALB/c mice rather than in the glomerulus, and found that Exendin-4 treatment improved renal tubular damage by reducing the production of reactive oxygen species and inflammation. Yijie et alCitation20 reported that Exendin-4 ameliorates the HG-induced FN1 and COL1A1 expression in PTECs by inhibiting the expression of miR-192, a p53-regulated microRNA that plays a role in renal fibrosis. Additionally, recombinant human GLP-1 has been shown to attenuate AGEs-induced tubulointerstitial injury by inhibiting phosphorylation of MAPK and nuclear factor-kappa B (NF-κB) in human proximal tubular cells (HK-2 cells).Citation39 Furthermore, liraglutide has been reported to mitigate renal fibrosis induced by unilateral ureteral obstruction and attenuate epithelial-mesenchymal transition (EMT) in recombinant transforming growth factor-beta 1 (TGF-β1)-treated renal tubular epithelial cells (NRK-52E).Citation40 However, the molecular mechanism of GLP-1RA in improving renal tubular damage of DKD remains controversial.
To investigate the mechanism of renal tubule injury in DKD and to elucidate the potential mechanism of GLP-1RA in improving renal tubular damage, we used LFQ-based proteomics to clarify the changes in kidney proteins among the control group, DKD group and GLP-1RA group. In this study, we identified a total of 30 DEPs of kidney among three groups. Then, we further validated several DEPs using qPCR, including SVS6, CPT2, APOA1, GSTT1, MUP20 and NAMPT. Among them, SVS6 was the most differentially expressed protein in the kidneys of the three groups of mice. Furthermore, the expression changes of Svs6 mRNA in mTEC cells among the control group, HG group and GLP-1RA group were consistent with LFQ-based proteomics results. When gene expression of Svs6 was inhibited by SVS6 siRNA in HG-stimulated mTEC cells, renal tubular damage markers were significantly decreased compared to the HG group. We speculated that SVS6 might be a candidate pathogenic protein for the development of DKD and a potential target for GLP-1RA in the treatment of DKD. Previous studies have found that the seminal vesicles of rodents can secrete 6 kinds of proteins, which are denoted as SVS1 to SVS6 in order of descending size.Citation41,Citation42 It has been found in the past that the role of these proteins is to form mating plugs after mating.Citation41 However, the expression and the role of SVS6 in the kidney have not been explored yet. We proposed for the first time that SVS6 was highly expressed in the kidneys of DKD mice and mTEC cells under HG conditions, whereas GLP-1RA reduced SVS6 expression and prevented tubular injury in vivo and in vitro. Therefore, SVS6 might be involved in the pathogenesis of DKD and in the treatment of DKD by GLP-1RA. However, further experiments are still needed to confirm the role of SVS6 in the pathogenesis of DKD.
Conclusions
In summary, our study found that there were abnormal renal function and obvious renal tubular damage in DKD mice, and GLP-1RA could significantly improve renal function and reduce renal tubular injury. The results of proteomics analysis indicated that the expression of SVS6 protein in the kidney of DKD group was significantly increased compared with the controls, and it was significantly decreased after GLP-1RA treatment. Changes in mRNA expression of SVS6 have been validated in vivo and in vitro. We also found that renal tubular damage markers were elevated in mTEC cells stimulated by HG, whereas tubular injury markers were obviously decreased after SVS6 expression inhibition by SVS6 siRNA in mTEC cells induced by HG. Our results suggest that SVS6 might be involved in the pathogenesis of DKD and in the treatment of DKD by GLP-1RA. Furthermore, we also found GLP-R was widely expressed in both glomeruli and renal tubules. Therefore, we speculate that GLP-1RA may directly bind to GLP-1R in the kidney to regulate the expression of SVS6, and ultimately improve renal tubular damage. SVS6 may be a potential therapeutic target for patients with DKD.
Abbreviations
GLP-1RA, glucagon-like peptide 1 receptor agonist; DKD, diabetic kidney disease; DEPs, the differentially expressed proteins; mTEC, murine kidney proximal tubular epithelial cells; GLP-R, glucagon-like peptide-1 receptor; eGFR, glomerular filtration rate; T2DM, type 2 diabetes mellitus; STZ, streptozotocin; SPF, the specific pathogen-free; HFD, high-fat diet; Scr, Serum creatinine; BUN, blood uric nitrogen; H&E, Hematoxylin and Eosin; PASM, Periodic Acid-Silver Methenamine; PAS, periodic acid-Schiff; LFQ, label-free quantification; GO, gene ontology; BP, biological process; MF, molecular function; CC, cell population points; KEGG, the Kyoto Encyclopedia of Genes and Genomes; GAPDH, glyceraldehyde-3-phosphate dehydrogenase; FABP-1, fatty acid binding protein 1; KIM-1, kidney injury molecule-1; NGAL, neutrophil gelatinase-associated lipocalin; SGLT2, sodium-glucose co-transporter 2; COL1A1, collagen type I alpha 1 chain; COL3A1, collagen type III alpha 1 chain; FN1, fibronectin 1; SVS6, seminal vesicle secretory protein 6; CPT2, carnitine palmitoyl transferase 2; APOA1, apolipoprotein A1; GSTT1, glutathione S-transferase theta 1; MUP20, major urinary protein 20; NAMPT, nicotinamide phosphoribosyl transferase.
Ethics Approval
All animal experiments were approved by the Animal Ethics Committee of Tongji Hospital, Tongji University School of Medicine (2021-DW-(003)). This study was conducted in accordance with the Guide for the Care and Use of Laboratory Animals (NIH Publication, 8th Edition, 2011), and Animal Research: Reporting of In Vivo Experiments guidelines. All applicable international, national, and/or institutional guidelines for the care and use of animals were followed.
Disclosure
The authors declare that they have no conflicts of interest for this work.
Additional information
Funding
References
- Ali Khan I. Do second generation sequencing techniques identify documented genetic markers for neonatal diabetes mellitus? Heliyon. 2021;7(9):e07903. doi:10.1016/j.heliyon.2021.e07903
- Shaheen FA, Al-Khader AA. Epidemiology and causes of end stage renal disease (ESRD). Saudi J Kidney Dis Transpl. 2005;16(3):277–281.
- Zhang XX, Kong J, Yun K. Prevalence of diabetic nephropathy among patients with type 2 diabetes mellitus in china: a meta-analysis of observational studies. J Diabetes Res. 2020;2020:2315607. doi:10.1155/2020/2315607
- Han J, Pang X, Shi X, Zhang Y, Peng Z, Xing Y. Ginkgo biloba extract EGB761 ameliorates the extracellular matrix accumulation and mesenchymal transformation of renal tubules in diabetic kidney disease by inhibiting endoplasmic reticulum stress. Biomed Res Int. 2021;2021:6657206. doi:10.1155/2021/6657206
- Haneda M, Utsunomiya K, Koya D, et al. A new classification of diabetic nephropathy 2014: a report from joint committee on diabetic nephropathy. J Diabetes Investig. 2015;6(2):242–246. doi:10.1111/jdi.12319
- Lassén E, Daehn IS. Molecular mechanisms in early diabetic kidney disease: glomerular endothelial cell dysfunction. Int J Mol Sci. 2020;21(24):9456. doi:10.3390/ijms21249456
- Kunika K, Yamaoka T, Itakura M. Damage of charge-dependent renal tubular reabsorption causes diabetic microproteinuria. Diabetes Res Clin Pract. 1997;36(1):1–9. doi:10.1016/S0168-8227(97)01382-X
- Zeni L, Norden AGW, Cancarini G, Unwin RJ. A more tubulocentric view of diabetic kidney disease. J Nephrol. 2017;30(6):701–717. doi:10.1007/s40620-017-0423-9
- Huh JH, Lee M, Park SY, Kim JH, Lee BW. Glycated albumin is a more useful glycation index than HbA1c for reflecting renal tubulopathy in subjects with early diabetic kidney disease. Diabetes Metab J. 2018;42(3):215–223. doi:10.4093/dmj.2017.0091
- Gilbert RE. Proximal tubulopathy: prime mover and key therapeutic target in diabetic kidney disease. Diabetes. 2017;66(4):791–800. doi:10.2337/db16-0796
- Tang SC, Lai KN. The pathogenic role of the renal proximal tubular cell in diabetic nephropathy. Nephrol Dial Transplant. 2012;27(8):3049–3056. doi:10.1093/ndt/gfs260
- Russo LM, Sandoval RM, Campos SB, Molitoris BA, Comper WD, Brown D. Impaired tubular uptake explains albuminuria in early diabetic nephropathy. J Am Soc Nephrol. 2009;20(3):489–494. doi:10.1681/ASN.2008050503
- Górriz JL, Soler MJ, Navarro-González JF, et al. GLP-1 receptor agonists and diabetic kidney disease: a call of attention to nephrologists. J Clin Med. 2020;9(4):947. doi:10.3390/jcm9040947
- Meier JJ. GLP-1 receptor agonists for individualized treatment of type 2 diabetes mellitus. Nat Rev Endocrinol. 2012;8(12):728–742. doi:10.1038/nrendo.2012.140
- Greco EV, Russo G, Giandalia A, Viazzi F, Pontremoli R, De Cosmo S. GLP-1 receptor agonists and kidney protection. Medicina. 2019;55(6):233. doi:10.3390/medicina55060233
- Körner M, Stöckli M, Waser B, Reubi JC. GLP-1 receptor expression in human tumors and human normal tissues: potential for in vivo targeting. J Nucl Med. 2007;48(5):736–743. doi:10.2967/jnumed.106.038679
- Hviid AVR, Sørensen CM. Glucagon-like peptide-1 receptors in the kidney: impact on renal autoregulation. Am J Physiol Renal Physiol. 2020;318(2):F443–f454. doi:10.1152/ajprenal.00280.2019
- Nolen-Doerr E, Stockman MC, Rizo I. Mechanism of glucagon-like peptide 1 improvements in type 2 diabetes mellitus and obesity. Curr Obes Rep. 2019;8(3):284–291. doi:10.1007/s13679-019-00350-4
- Fan H, Pan Q, Xu Y, Yang X. Exenatide improves type 2 diabetes concomitant with non-alcoholic fatty liver disease. Arq Bras Endocrinol Metabol. 2013;57(9):702–708. doi:10.1590/S0004-27302013000900005
- Jia Y, Zheng Z, Guan M, et al. Exendin-4 ameliorates high glucose-induced fibrosis by inhibiting the secretion of miR-192 from injured renal tubular epithelial cells. Exp Mol Med. 2018;50(5):1–13. doi:10.1038/s12276-018-0084-3
- Sancar-Bas S, Gezginci-Oktayoglu S, Bolkent S. Exendin-4 attenuates renal tubular injury by decreasing oxidative stress and inflammation in streptozotocin-induced diabetic mice. Growth Factors. 2015;33(5–6):419–429. doi:10.3109/08977194.2015.1125349
- van der Aart-van der Beek AB, van Raalte DH, Guja C, et al. Exenatide once weekly decreases urinary albumin excretion in patients with type 2 diabetes and elevated albuminuria: pooled analysis of randomized active controlled clinical trials. Diabetes Obes Metab. 2020;22(9):1556–1566. doi:10.1111/dom.14067
- Kodera R, Shikata K, Kataoka HU, et al. Glucagon-like peptide-1 receptor agonist ameliorates renal injury through its anti-inflammatory action without lowering blood glucose level in a rat model of type 1 diabetes. Diabetologia. 2011;54(4):965–978. doi:10.1007/s00125-010-2028-x
- Amin SN, El-Gamal EM, Rashed LA, Kamar SS, Haroun MA. Inhibition of notch signalling and mesangial expansion by combined glucagon like peptide-1 agonist and crocin therapy in animal model of diabetic nephropathy. Arch Physiol Biochem. 2020;1–11. doi:10.1080/13813455.2020.1846203
- Fang S, Cai Y, Lyu F, et al. Exendin-4 improves diabetic kidney disease in C57BL/6 mice independent of brown adipose tissue activation. J Diabetes Res. 2020;2020:9084567. doi:10.1155/2020/9084567
- Habib HA, Heeba GH, Khalifa MMA. Effect of combined therapy of mesenchymal stem cells with GLP-1 receptor agonist, exenatide, on early-onset nephropathy induced in diabetic rats. Eur J Pharmacol. 2021;892:173721. doi:10.1016/j.ejphar.2020.173721
- Jeong HY, Kang JM, Jun HH, et al. Chloroquine and amodiaquine enhance AMPK phosphorylation and improve mitochondrial fragmentation in diabetic tubulopathy. Sci Rep. 2018;8(1):8774. doi:10.1038/s41598-018-26858-8
- Ma Z, Li L, Livingston MJ, et al. p53/microRNA-214/ULK1 axis impairs renal tubular autophagy in diabetic kidney disease. J Clin Invest. 2020;130(9):5011–5026. doi:10.1172/JCI135536
- Pi E, Zhu C, Fan W, et al. Quantitative phosphoproteomic and metabolomic analyses reveal GmMYB173 optimizes flavonoid metabolism in soybean under salt stress. Mol Cell Proteomics. 2018;17(6):1209–1224. doi:10.1074/mcp.RA117.000417
- Hou W, Zhang Y, Zhang Y, et al. Label-free proteomics study on Shewanella putrefaciens regulated by ε-Poly-lysine treatment. J Appl Microbiol. 2020;131(2):791–800.
- Cox J, Mann M. MaxQuant enables high peptide identification rates, individualized p.p.b.-range mass accuracies and proteome-wide protein quantification. Nat Biotechnol. 2008;26(12):1367–1372. doi:10.1038/nbt.1511
- Selby NM, Taal MW. An updated overview of diabetic nephropathy: diagnosis, prognosis, treatment goals and latest guidelines. Diabetes Obes Metab. 2020;22(Suppl 1):3–15. doi:10.1111/dom.14007
- Heinz-Taheny KM, Harlan SM, Qi Z, Heuer JG. Synopsis of sweet! Mouse models of diabetic kidney disease. Toxicol Pathol. 2018;46(8):970–975. doi:10.1177/0192623318799995
- Tang SCW, Leung JCK, Lai KN. Diabetic tubulopathy: an emerging entity. Contrib Nephrol. 2011;170:124–134.
- Tang SC, Chan LY, Leung JC, et al. Bradykinin and high glucose promote renal tubular inflammation. Nephrol Dial Transplant. 2010;25(3):698–710. doi:10.1093/ndt/gfp599
- Ziyadeh FN, Simmons DA, Snipes ER, Goldfarb S. Effect of myo-inositol on cell proliferation and collagen transcription and secretion in proximal tubule cells cultured in elevated glucose. J Am Soc Nephrol. 1991;1(11):1220–1229. doi:10.1681/ASN.V1111220
- Xue M, Yang F, Le Y, et al. Klotho protects against diabetic kidney disease via AMPK- and ERK-mediated autophagy. Acta Diabetol. 2021;58(10):1413–1423. doi:10.1007/s00592-021-01736-4
- Li RX, Yiu WH, Wu HJ, et al. BMP7 reduces inflammation and oxidative stress in diabetic tubulopathy. Clin Sci. 2015;128(4):269–280. doi:10.1042/CS20140401
- Yin W, Xu S, Wang Z, et al. Recombinant human GLP-1(rhGLP-1) alleviating renal tubulointestitial injury in diabetic STZ-induced rats. Biochem Biophys Res Commun. 2018;495(1):793–800. doi:10.1016/j.bbrc.2017.11.076
- Li YK, Ma DX, Wang ZM, et al. The glucagon-like peptide-1 (GLP-1) analog liraglutide attenuates renal fibrosis. Pharmacol Res. 2018;131:102–111. doi:10.1016/j.phrs.2018.03.004
- Shindo M, Inui M, Kang W, et al. Deletion of a seminal gene cluster reinforces a crucial role of SVS2 in male fertility. Int J Mol Sci. 2019;20(18):4557. doi:10.3390/ijms20184557
- Lundwall A, Malm J, Clauss A, Valtonen-Andre C, Olsson AY. Molecular cloning of complementary DNA encoding mouse seminal vesicle-secreted protein SVS I and demonstration of homology with copper amine oxidases. Biol Reprod. 2003;69(6):1923–1930. doi:10.1095/biolreprod.103.019984