
Abstract
Purpose
The triglyceride–glucose index (TyG) is positively correlated with serum uric acid (SUA) in patients with type 2 diabetes mellitus (T2DM). However, whether this relationship exists in non-obese T2DM patients remains unknown. The study investigated the relationship between TyG and SUA in Chinese non-obese T2DM patients and examined the prognostic value of TyG in hyperuricemia (HUA).
Patients and Methods
In total, 719 T2DM patients who were not obese were enrolled from among those who visited the Hebei General Hospital. The patients were categorized into groups according to their SUA levels. The relationship between TyG and clinical parameters was examined through correlation analysis. To consider covariates and examine the independent impact of TyG on HUA, logistic regression was performed. The receiver operating characteristic (ROC) curve analysis was performed to evaluate the diagnostic value of TyG and homeostasis model assessment of insulin resistance (HOMA-IR) for HUA.
Results
The HUA prevalence was 12.10%. TyG was statistically different among the four SUA groups, with lower TyG levels in the Q1, Q2, and Q3 groups than that in the Q4 group. TyG was positively correlated with SUA (r = 0.176, P < 0.001). Logistic regression exhibited that TyG and SUA were independently correlated (OR = 2.427, 95% CI = 1.134-5.195, P = 0.022) even after adjustment for confounding factors. The ROC curve showed that the predictive value of TyG for HUA was higher than that of HOMA-IR (AUROC = 0.613, P = 0.001).
Conclusion
TyG was positively correlated with SUA in non-obese T2DM patients. TyG may better predict HUA in non-obese T2DM patients than HOMA-IR.
Introduction
In the past decade, the prevalence of both hyperuricemia (HUA) and type 2 diabetes mellitus (T2DM) was increasing, and they are currently major public health concerns globally.Citation1,Citation2 T2DM is a chronic disease characterized by hyperglycemia with insulin resistance (IR) and relative insulin deficiency. HUA is a state in which serum uric acid (SUA) levels are elevated because of excessive production or insufficient excretion of uric acid (UA). Studies have shown that T2DM is closely related to HUA.Citation3–6 Both these diseases are associated with chronic inflammation.Citation7–9 Moreover, IR and obesity are the common risk factors for T2DM and HUA.Citation10–13 Thus, understanding the relationship of HUA with IR and T2DM may be beneficial for investigating mechanisms underlying T2DM and HUA development.
The HUA–IR relationship has been investigated in populations with and without diabetes.Citation14–16 In 53,477 adults, Tae et alCitation17 showed that the homeostasis model assessment of IR (HOMA-IR) was independently and positively associated with SUA. In 2016, a meta-analysis of 16 cohort studies on the association between SUA and T2DM revealed that SUA was independently associated with T2DM, and IR developed with an increase in baseline SUA.Citation18 Inflammation is considered a crucial link in the IR–HUA relationship.Citation19 SUA may influence insulin signaling and induce IR under the action of inflammatory factors.Citation20 On the other hand, IR can cause inflammation and indirectly promote HUA. Administration of anti-inflammatory intervention to insulin-resistant individuals reduces SUA levels.Citation21 Although obese individuals are more likely to have IR and HUA, non-obese individuals, including those normal-weight and overweight, also have elevated SUA levels.Citation22–24 Currently, few studies have investigated the IR–HUA relationship in non-obese people.
Several measurement methods have been used to evaluate IR, with the gold standard being the hyperinsulinemic-euglycemic clamp (HEC) technique. HEC is less used in clinical studies because it is time-consuming, labor-intensive, and invasive. HOMA-IR is the most commonly used clinical surrogate index. HOMA-IR is based on fasting insulin (FINS) and fasting plasma glucose (FPG) levels. HOMA-IR is susceptible to the effect of exogenous insulin, and uniform experimental methods are lacking. Therefore, some non-insulin-dependent IR-related indicators have been developed. In 2008, Simental-Mendía developed the triglyceride–glucose index (TyG) as a proxy for IR evaluation in apparently healthy people.Citation25 Numerous investigations have demonstrated that TyG has an outstanding capability to predict IR.Citation26,Citation27 Compared with HEC and HOMA-IR, the detection of FPG and triglyceride (TG) levels for TyG calculation is inexpensive and easy to perform. Therefore, TyG has great potential for clinical application. Recent reports have suggested the important role of TyG as an IR indicator in metabolic and inflammatory conditions, such as T2DMCitation28,Citation29 and hypertension.Citation30 In addition, TyG is used to study the HUA–IR relationship. TyG was discovered as an independent risk factor for elevated SUA in several investigations of the general populationCitation31,Citation32 and hypertensive patients.Citation33,Citation34 Han et alCitation35 was the first to use TyG to investigate the IR–HUA relationship in T2DM patients. They showed that TyG was positively correlated with SUA levels and that TyG had a predictive value for HUA, with an area under the receiver operating characteristic (ROC) curve (AUROC) of 0.693 and a cut-off value of 9.55.
Different from the Caucasian population, most Asian patients with T2DM are normal-weight and overweight. However, no specific study has explored the connection between TyG and HUA in non-obese T2DM patients. Therefore, we conducted this cross-sectional study to investigate the link between TyG and HUA in non-obese T2DM patients and to evaluate the predictive value of TyG for HUA.
Methods
Participants
All participants were selected from patients with T2DM who visited the Department of Endocrinology of Hebei General Hospital during December 2020–2021.
The subject inclusion criteria were as follows: 1) the diagnosis of T2DM was based on the latest American Diabetes Association guidelines for the diagnosis and treatment of diabetes;Citation36 2) all patients were aged ≥18 years and ≤80 years; 3) subjects had a body mass index (BMI) <28 kg/m2, which met the Chinese diagnostic standard for non-obesity.Citation37
The subject exclusion criteria were as follows: 1) individuals with other types of diabetes, including type 1 diabetes, gestational diabetes, and other specific types of diabetes; 2) patients with acute complications of diabetes, such as hyperosmolar hyperglycemic syndrome, ketoacidosis, and hypoglycemia; 3) patients with a history of chronic kidney disease, severe hepatic or renal insufficiency, and those undertaking a uric acid-lowering therapy; 4) patients with severe cardiac diseases, acute cerebrovascular diseases, tumor, and psychosis.
The study was conducted in accordance with the Declaration of Helsinki, and the Ethics Committee of the Hebei General Hospital gave its clearance to this study (approval number: No. 387). All participants provided their signed informed consent forms before participating in the study. The participants’ information has been kept private.
Data Collection
Basic information about the patients was collected, which included their gender, age, the course of diabetes, medical history, and a history of drug application. The height, weight, and blood pressure (systolic/diastolic blood pressure, SBP/DBP) of the subjects were measured. For all patients, venous blood samples were collected after fasting them for 8–12 h to detect total protein (TP), albumin (ALB), aspartate transaminase (ALT), alanine transaminase (AST), blood urea nitrogen (BUN), serum creatinine (Scr), SUA, total cholesterol (TC), TG, high-density lipoprotein (HDL), low-density lipoprotein (LDL), 25-hydroxyvitamin D [25-(OH)D], FPG, glycated hemoglobin (HbA1c), and FINS. All patients underwent abdominal ultrasonography under a fasting state to confirm the presence of fatty liver (FL).
Definition
SUA >420 µmol/L in men and >360 µmol/L in women was used to define HUA. FL was defined as the echo enhancement of liver parenchyma with an attenuation of the posterior liver tissues and poor visualization of intrahepatic ductal structures on ultrasound. The estimated glomerular filtration rate (eGFR) was determined by using the following chronic kidney disease-epidemiology (CKD-EPI) formula.Citation38 .
.
.
.
.
Study Groups
The study patients were categorized into the following groups: Q1 (SUA <247.50 µmol/L), Q2 (247.50 ≤ SUA < 296.10 µmol/L), Q3 (296.10 ≤ SUA < 350.80 µmol/L), and Q4 (SUA ≥350.80 µmol/L) according to the SUA quartiles. In addition, all participants were split into either the hyperuricemia (HUA) group or the normal uric acid (NUA) group.
According to the Chinese BMI classification standards, the patients were classified as non-overweight (BMI <24 kg/m2) or overweight (BMI ≥24 kg/m2).
The patients were also categorized into the FL group and non-FL (NFL) group based on the results of abdominal ultrasonography.
Statistical Analyses
SPSS 26.0 and GraphPad Prism 9.0 were used for the statistical analysis of the data. Continuous variables were tested for conformity to a normal distribution by Shapiro–Wilk test, with normally distributed variables, expressed as the mean ±standard deviation and non-normally distributed variables expressed as a median value (P25, P75). ANOVA test was applied to analyze the differences between groups for variables that conformed to a normal distribution with an equal variance between the groups. The Nonparametric test was applied to analyze the differences for variables that conformed to a normal distribution, but with an uneven variance between the groups and for variables that were not normally distributed. Categorical variables were presented as percentages and Chi-square tests were applied for the analysis of differences between the groups. Correlational analyses were performed to test the correlation between SUA and other indicators. Logistic regression analysis was performed to analyze whether TyG was independently correlated with HUA. The predictive powers of TyG and HOMA-IR for HUA were examined using ROC curves. A two-tailed distribution of P < 0.05 was considered to indicate statistical significance.
Results
In total, 719 patients were included in this study, including 436 men and 283 women (median age: 58 years, BMI: 24.86 kg/m2, and diabetes course: 8 years). Of all the participants, 12.10% had HUA.
Comparison of Clinical Parameters Among the Four SUA Groups
According to , no significant differences in age, BMI, SBP, DBP, diabetes course, TP, eGFR, TC, LDL, 25(OH)D, and HOMA-IR were observed among the SUA subgroups, whereas age, male proportion, BMI, ALB, ALT, AST, BUN, Scr, TG, HDL, FPG, HbA1c, HOMA-β, TyG, TG/HDL, and FL prevalence were different. Further pairwise comparisons of the Q1, Q2, and Q3 groups were made with the Q4 group, which was considered the control. Compared with the Q4 group, HDL and HbA1c in the Q1 group were higher, whereas BMI, ALB, ALT, AST, Scr, BUN, TG, HOMA-β, TyG, and TG/HDL were lower. Compared with the Q2 group, HDL and HbA1c were lower in the Q4 group, whereas BMI, AST, Scr, BUN, TG, TyG, and TG/HDL were higher. Moreover, Scr, BUN, TG, TyG, and TG/HDL were lower in the Q3 group than those in the Q4 group. The proportion of male patients and FL showed an upward trend among the four groups, but statistically significant differences were observed only between the Q1, Q2, and Q4 groups. With increased SUA levels, the age decreased, and the patients in the Q1 and Q2 groups were noticeably older than those in the Q4 group.
Table 1 Comparison of the Clinical Parameters of the 4 SUA Groups
Comparison of TyG and HOMA-IR Between Male and Female Patients
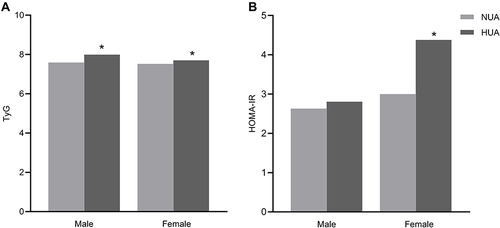
In the male patients, while no discernible difference in HOMA-IR was observed between the NUA and HUA groups, a higher TyG was observed in the HUA group than that in the NUA group. In the female participants, the HUA group had higher TyG and HOMA-IR than the NUA group ().
Figure 1 Comparison of TyG and HOMA-IR between male and female patients. (A) Comparison of TyG between male and female patients; (B) Comparison of HOMA-IR between male and female patients. *P < 0.05.
Comparison of SUA Between BMI and FL Subgroups
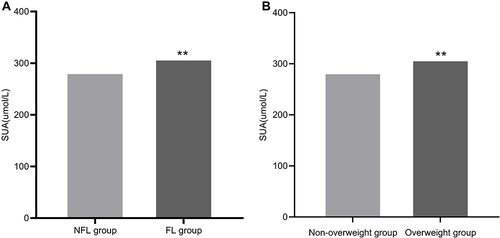
Compared with the overweight group, the SUA levels were lower in the non-overweight group (). The SUA levels in the FL group were significantly higher than those in the NFL group ().
Figure 2 Comparison of SUA between FL subgroups and BMI subgroups. (A) Comparison of SUA between NFL group and FL group; (B) Comparison of SUA between non-overweight group and overweight group. **P < 0.01.
Correlation Analysis of SUA with Other Indicators
According to Spearman correlation analysis, SUA was inversely related to age, HDL, FPG, and HbA1c and positively correlated with DBP, BMI, TP, ALB, ALT, AST, BUN, Scr, TG, HOMA-IR, HOMA-β, TyG, and TG/HDL. However, SUA was not correlated with SBP, diabetes course, eGFR, TC, LDL, and 25(OH)D ().
Table 2 Correlation Between the SUA and Other Factors
Regression Analysis of TyG and HUA
We tested whether TyG was independently associated with HUA by three models (). TyG was independently associated with HUA in all three models. Model 1 did not adjust for any confounding factors, and a 1-unit increase in TyG was associated with a 67.40% increase in HUA prevalence (OR = 1.674, 95% CI 1.291–2.170). Age and gender were considered in Model 2, which demonstrated that a 1-unit increase in TyG increased HUA prevalence by 71.80% (OR = 1.718, 95% CI 1.302–2.267). Model 3 was further adjusted for BMI, ALB, ALT, AST, BUN, Scr, TG, HDL, FPG, HbA1c, and FL based on Model 2, with a more than 2-fold increase in HUA prevalence for each unit increase in TyG (OR = 2.427, 95% CI 1.134–5.195).
Table 3 Logistic Regression Analysis of TyG and HUA
ROC Curve of TyG and HOMA-IR for HUA
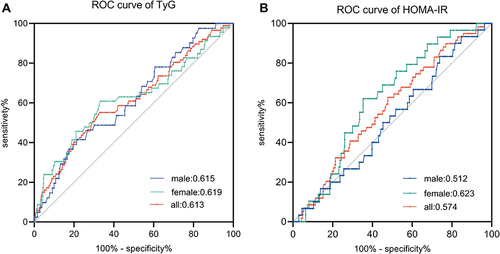
We further analyzed the diagnostic value of TyG for HUA through ROC curve analysis and compared it with that of HOMA-IR. As shown in and , in all T2DM patients, the AUROC for TyG was 0.613 (95% CI 0.680–7.880) with a cut-off value of 7.880. The AUROC for TyG was 0.619 (95% CI 0.715–7.880) in the male patients, with a cut-off value of 7.880, while in the female patients, the AUROC for TyG was 0.615 (95% CI 0.707–8.040), with a cut-off value of 8.040. The AUROCs for HOMA-IR in all participants and the male patients were 0.574 (95% CI 0.502–0.646) and 0.512 (95% CI 0.410–0.603), respectively, with P > 0.05. In the female patients, HOMA-IR had a predictive value for HUA, with an AUROC of 0.623 (95% CI 0.523–0.719).
Table 4 The Diagnostic Value of TyG and HOMA-IR for HUA in Non-Obese Patients with T2DM
Figure 3 ROC curve of TyG and HOMA-IR in predicting HUA in non-obese patients with T2DM. (A) ROC curve of TyG in predicting HUA; (B) ROC curve of HOMA-IR in predicting HUA.
Discussion
This is the first study reporting the correlation between TyG and SUA in non-obese T2DM patients. We found that TyG was considerably greater in the Q4 group than that in the Q1, Q2, and Q3 groups. TyG was also markedly higher in the HUA group than that in the NUA group. Further analysis revealed that TyG was a risk factor for HUA in non-obese T2DM patients, independent of sex, age, BMI, ALB, ALT, AST, BUN, Scr, TG, HDL, FPG, HbA1c, and FL. Moreover, TyG had a predictive value for HUA, with an AUROC of 0.613 and a cut-off value of 7.880.
The association between IR and HUA has been investigated in several studies. In a cross-sectional study involving a population with an average BMI of 28.52 kg/m2, Mohsen et alCitation39 revealed that HOMA-IR and TyG were strongly and positively correlated with SUA. Obesity, including higher BMI, waist circumference, and visceral fat, was thought to mediate SUA and IR. Wu et alCitation40 explored the relationship between SUA, IR, and insulin secretion in prediabetes individuals. However, they did not collect BMI data. The study showed that HOMA-IR was independently positively correlated with SUA in prediabetes individuals (OR = 2.017, P < 0.01). Furthermore, the IR–HUA relationship has been demonstrated in T2DM patients. A case-control study by Li et alCitation41 enrolled 90 elderly patients with T2DM, 49 of whom had BMI ≥ 25 kg/m2. The study revealed that SUA was positively correlated with BMI and HOMA-IR. A Chinese study explored the association of four IR indicators, namely TyG, TyG-BMI, TG/HDL, and METS-IR, with HUA in T2DM patients.Citation35 Based on SUA levels, all participants were divided into three groups and the average BMI of the groups was >25 kg/m2. The study reported that the four indicators were all independently correlated with HUA. The AUROC for TyG predicting HUA was 0.693 with a cut-off value of 9.55. However, none of these aforementioned studies specifically investigated non-obese T2DM patients, who are more common among the Asian diabetic population. Therefore, the present study investigated the association of SUA with IR in non-obese T2DM patients. Compared with HOMA-IR, TyG is inexpensive and readily available and is not affected by insulin therapy. Therefore, TyG was used for evaluating IR in our study. According to the results, TyG was independently associated with HUA, which was consistent with Han’s study. However, TyG had a weaker predictive power than that reported in Han’s study. This may be because of the difference in the characteristics of our study population. The participants in Han’s study were mostly overweight or obese, whereas our study focused on non-obese patients with T2DM. Furthermore, we compared the predictive ability of TyG and HOMA-IR for HUA; TyG had a stronger ability to recognize HUA.
The causal relationship between IR and HUA is controversial. Several studies have indicated that HUA may underlie IR, while some studies have shown that HUA can appear before IR.Citation42,Citation43 Krishnan et al followed 5012 young American patients for 15 years and found that those with HUA were 1.36 times more likely to have IR than those without HUA. Zhu et alCitation44 examined the effect of HUA on IR using an HUA model mouse and HepG2 cells. According to that study, HUA can inhibit insulin signal transduction and lead to IR, which was associated with inflammation and oxidative stress. However, considerable findings have suggested that IR contributes to HUA. In 2021, McCormick et alCitation45 published a two-way Mendelian randomization study on HUA and IR. Through their analysis of single-nucleotide polymorphisms associated with SUA, gout, and insulin, they found that genetically determined FINS was positively and independently correlated with SUA, whereas no correlation was noted between genetically determined SUA and FINS. Moreover, HOMA-IR can independently predict HUA incidence within 6 years in young and middle-aged Japanese men.Citation46 In Nakamura’s study, relative to the lowest quartile of HOMA-IR, HUA incidence in the highest quartile increased by 44%. IR may contribute to elevated SUA levels through several mechanisms. First, UA reabsorption was increased in response to insulin regulation of regulating urate transporter 1 (URAT-1) and ATP-binding cassette subfamily G member 2 (ABCG2).Citation47 Second, IR disrupts oxidative phosphate and leads to increased adenosine levels. Adenosine has a sodium retention effect and therefore reduces UA excretion.Citation41 Third, under the IR state, intermediates of glycolysis and pentose phosphate processes can be converted to ribose pyrophosphate and 5-ribose phosphate, thereby increasing SUA production.Citation48 Moreover, IR can amplify inflammatory cascades and lead to liver dysfunction. Liver dysfunction is associated with high xanthine oxidoreductase activity, which then leads to increased UA production.Citation49 Our study results showed that in non-obese individuals with T2DM, TyG was a risk factor for HUA, independent of sex, age, BMI, lipid parameters, FPG, HbA1c, and FL. The finding implies that IR contributes to SUA elevation.
Although obesity is strongly associated with IR, IR is undeniably present in non-obese individuals. This may be because of the underlying visceral obesity. Visceral obesity refers to excessive adipose tissue deposited in the abdominal organ. Asians are more likely to develop visceral obesity with only a normal or overweight BMI.Citation50 FL is a common manifestation of visceral obesity. In our study, FL incidence increased among SUA quartile groups in non-obese T2DM patients. In addition, the FL group showed higher SUA levels than the NFL group. These results are consistent with those of several previous studies. Liu et al showed that the effect of visceral obesity on SUA was more pronounced than that of general obesity.Citation51 In T2DM patients, HUA is positively correlated with central body fat distribution, particularly visceral adipose tissue.Citation52 The increased SUA level may be related to visceral adipose inflammation induced IR.Citation53 Sun et alCitation54 showed that adipose tissue IR (Adipo-IR), HOMA-IR, and SUA were closely related. However, HOMR-IR was not correlated with HUA in men with a normal BMI (18.5 kg/m2 ≤ BMI < 24 kg/m2). Interestingly, our results also showed that TyG, but not HOMA-IR, was strongly correlated with SUA in non-obese T2DM patients. This may be because HOMA-IR mainly reflects glucose metabolism, while TyG is an index based on a combination of FPG and TG. Thus, TyG reflects the condition of both glucose and lipid metabolism.
Furthermore, the proportion of men in the Q1, Q2, and Q3 groups was lower than that in the Q4 group, which is consistent with the results of previous studies.Citation55–57 Men are more susceptible to HUA than women. First, men and women differ in sex hormone production and skeletal muscle content.Citation58,Citation59 Moreover, differences in dietary habits, commuting modes, and physical activities between men and women may act as potential factors affecting HUA prevalence.Citation60
TG levels in our study exhibited an obvious upward trend among the four SUA subgroups. TG was positively associated with SUA; this result is consistent with those of previous studies.Citation61,Citation62 Some studies from different geographical regions of China have found higher TG to be associated with higher SUA.Citation63,Citation64 Qiu et alCitation64 found a 3.3-fold elevated HUA risk in participants with TG ≥ 5.65 mmol/L compared with those with TG < 1.69 mmol/L. Diet may partly mediate the simultaneous elevation of TG and SUA.Citation65 In addition, TG synthesis requires NADPH as the reducing molecule of the fatty acid synthase complex, which is mainly produced in the pentose phosphate metabolic pathway. Hypertriglyceridemia may be accompanied by an upregulated pentose phosphate pathway and therefore a concomitant increase in SUA synthesis.Citation66
Our study showed that the Q1 and Q2 groups comprised older adults than the Q4 group. Moreover, SUA was negatively correlated with age in our study. However, most studies suggest a positive correlation between SUA and age, and it is thought to be associated with the deterioration of renal function. The renal function decreases by 10% for every 10 years of age after 40 years of age.Citation67 Therefore, older patients are at a significantly higher risk of HUA. Our study result was different from the results of previous research possibly because the patients enrolled in the present study are at the median in the CKD I phase (median eGFR: >90 mL/min/1.73 m2). We excluded patients with severe renal insufficiency when screening the participants. Although the median participant age in all four SUA groups was >50 years, no between-group differences were observed in eGFR. Thus, group differences in SUA may be more related to the UA amount generated in the body, including factors such as diet and metabolism, but not renal function.
This was the first study investigating the relationship between SUA and TyG in non-obese T2DM. In non-obese T2DM patients, TyG was positively correlated with SUA and the predictive value of TyG for HUA was better than that of HOMA-IR. In addition, because of the lack of stability of HOMA-IR calculation and its susceptibility to exogenous insulin, the clinical value of TyG in disease monitoring and prevention is non-neglectable. Improving IR may be a crucial target for HUA treatment and prevention in non-obese T2DM patients. This study also had some shortcomings. First, the study was cross-sectional and could not provide a definitive causal association between IR and HUA. Second, this study included patients from a single clinical institution, and thus, the results might not apply to other populations. Third, SUA was derived from a single blood sample and only reflects UA levels within an individual at a certain time point. Fourth, factors affecting UA levels, including physical activity and dietary habits, were not considered in our study. Therefore, further investigations are required for a better understanding of the relationship between IR and SUA.
Conclusion
For non-obese T2DM patients, TyG was an independent risk factor for elevated SUA. In addition, TyG was found to be an inexpensive and readily available index for IR evaluation. The predictive value of TyG for HUA was higher than that of HOMA-IR.
Disclosure
The authors report no conflicts of interest in this work.
References
- Dehlin M, Jacobsson L, Roddy E. Global epidemiology of gout: prevalence, incidence, treatment patterns and risk factors. Nat Rev Rheumatol. 2020;16(7):380–390. doi:10.1038/s41584-020-0441-1
- Sun H, Saeedi P, Karuranga S, et al. IDF diabetes atlas: global, regional and country-level diabetes prevalence estimates for 2021 and projections for 2045. Diabetes Res Clin Pract. 2022;183:109119. doi:10.1016/j.diabres.2021.109119
- Song P, Wang H, Xia W, et al. Prevalence and correlates of hyperuricemia in the middle-aged and older adults in China. Sci Rep. 2018;8(1):4314. doi:10.1038/s41598-018-22570-9
- Donkeng M, Kuate D, Koudjou PN, Noubiap JJ, Kuiate JR. Association between hyperuricemia and glycated hemoglobin in type 2 diabetes at the District Hospital of Dschang. Pan Afr Med J. 2021;40:177. doi:10.11604/pamj.2021.40.177.30207
- Yu KH, Chen DY, Chen JH, et al. Management of gout and hyperuricemia: multidisciplinary consensus in Taiwan. Int J Rheum Dis. 2018;21(4):772–787. doi:10.1111/1756-185X.13266
- Woyesa SB, Hirigo AT, Wube TB. Hyperuricemia and metabolic syndrome in type 2 diabetes mellitus patients at Hawassa university comprehensive specialized hospital, South West Ethiopia. BMC Endocr Disord. 2017;17(1):76. doi:10.1186/s12902-017-0226-y
- Kimura Y, Tsukui D, Kono H. Uric acid in inflammation and the pathogenesis of atherosclerosis. Int J Mol Sci. 2021;22(22):12394. doi:10.3390/ijms222212394
- Li ZY, Liu B, Ji Y, et al. 2型糖尿病患者血尿酸水平与超敏C反应蛋白的关系 [Association between serum uric acid levels and high sensitive C-reactive protein in patients with type 2 diabetes]. Zhonghua Yi Xue Za Zhi. 2017;97(28):2181–2185. Chinese. doi:10.3760/cma.j.issn.0376-2491.2017.28.005
- Scheithauer TPM, Rampanelli E, Nieuwdorp M, et al. Gut microbiota as a trigger for metabolic inflammation in obesity and type 2 diabetes. Front Immunol. 2020;11:571731. doi:10.3389/fimmu.2020.571731
- Wan X, Xu C, Lin Y, et al. Uric acid regulates hepatic steatosis and insulin resistance through the NLRP3 inflammasome-dependent mechanism. J Hepatol. 2016;64(4):925–932. doi:10.1016/j.jhep.2015.11.022
- Yanai H, Adachi H, Hakoshima M, Katsuyama H. Molecular biological and clinical understanding of the pathophysiology and treatments of hyperuricemia and its association with metabolic syndrome, cardiovascular diseases and chronic kidney disease. Int J Mol Sci. 2021;22(17):9221. doi:10.3390/ijms22179221
- Han T, Meng X, Shan R, et al. Temporal relationship between hyperuricemia and obesity, and its association with future risk of type 2 diabetes. Int J Obes. 2018;42(7):1336–1344. doi:10.1038/s41366-018-0074-5
- Arersa KK, Wondimnew T, Welde M, Husen TM. Prevalence and determinants of hyperuricemia in type 2 diabetes mellitus patients attending Jimma Medical Center, Southwestern Ethiopia, 2019. Diabetes Metab Syndr Obes. 2020;13:2059–2067. doi:10.2147/DMSO.S252825
- Binh TQ, Tran Phuong P, Thanh Chung N, et al. First report on association of hyperuricemia with type 2 diabetes in a Vietnamese population. Int J Endocrinol. 2019;2019:5275071. doi:10.1155/2019/5275071
- Elizalde-Barrera CI, Estrada-Garcia T, Lozano-Nuevo JJ, et al. Serum uric acid levels are associated with homeostasis model assessment in obese nondiabetic patients: HOMA and uric acid. Ther Adv Endocrinol Metab. 2017;8(10):141–146. doi:10.1177/2042018817732731
- Gu Q, Hu X, Meng J, et al. Associations of triglyceride-glucose index and its derivatives with hyperuricemia risk: a cohort study in Chinese general population. Int J Endocrinol. 2020;2020:3214716. doi:10.1155/2020/3214716
- Yoo TW, Sung KC, Shin HS, et al. Relationship between serum uric acid concentration and insulin resistance and metabolic syndrome. Circ J. 2005;69(8):928–933. doi:10.1253/circj.69.928
- Xu YL, Xu KF, Bai JL, et al. Elevation of serum uric acid and incidence of type 2 diabetes: a systematic review and meta-analysis. Chronic Dis Transl Med. 2016;2(2):81–91. doi:10.1016/j.cdtm.2016.09.003
- Banik SD, Avila-Nava A, Lugo R, Chim Ake R, Gutierrez Solis AL. Association between low-grade inflammation and hyperuricemia in adults with metabolic syndrome in Yucatan, Mexico. Can J Diabetes. 2022;46(4):369–374. doi:10.1016/j.jcjd.2021.11.010
- Zhao H, Lu J, He F, et al. Hyperuricemia contributes to glucose intolerance of hepatic inflammatory macrophages and impairs the insulin signaling pathway via IRS2-proteasome degradation. Front Immunol. 2022;13:931087. doi:10.3389/fimmu.2022.931087
- Zhang X, Nie Q, Zhang Z, et al. Resveratrol affects the expression of uric acid transporter by improving inflammation. Mol Med Rep. 2021;24(2):1–9.
- Liu XZ, Chen DS, Xu X, et al. Longitudinal associations between metabolic score for visceral fat and hyperuricemia in non-obese adults. Nutr Metab Cardiovasc Dis. 2020;30(10):1751–1757. doi:10.1016/j.numecd.2020.06.001
- Shirasawa T, Ochiai H, Yoshimoto T, et al. Cross-sectional study of associations between normal body weight with central obesity and hyperuricemia in Japan. BMC Endocr Disord. 2020;20(1):2. doi:10.1186/s12902-019-0481-1
- Yang C, Yang S, Xu W, et al. Association between the hyperuricemia and nonalcoholic fatty liver disease risk in a Chinese population: a retrospective cohort study. PLoS One. 2017;12(5):e0177249. doi:10.1371/journal.pone.0177249
- Simental-Mendia LE, Rodriguez-Moran M, Guerrero-Romero F. The product of fasting glucose and triglycerides as surrogate for identifying insulin resistance in apparently healthy subjects. Metab Syndr Relat Disord. 2008;6(4):299–304. doi:10.1089/met.2008.0034
- Guerrero-Romero F, Villalobos-Molina R, Jimenez-Flores JR, et al. Fasting triglycerides and glucose index as a diagnostic test for insulin resistance in young adults. Arch Med Res. 2016;47(5):382–387. doi:10.1016/j.arcmed.2016.08.012
- Kang B, Yang Y, Lee EY, et al. Triglycerides/glucose index is a useful surrogate marker of insulin resistance among adolescents. Int J Obes. 2017;41(5):789–792. doi:10.1038/ijo.2017.14
- Pan Y, Zhong S, Zhou K, et al. Association between diabetes complications and the triglyceride-glucose index in hospitalized patients with type 2 diabetes. J Diabetes Res. 2021;2021:8757996. doi:10.1155/2021/8757996
- Park B, Lee HS, Lee YJ. Triglyceride glucose (TyG) index as a predictor of incident type 2 diabetes among nonobese adults: a 12-year longitudinal study of the Korean Genome and Epidemiology Study cohort. Transl Res. 2021;228:42–51. doi:10.1016/j.trsl.2020.08.003
- Zheng R, Mao Y. Triglyceride and glucose (TyG) index as a predictor of incident hypertension: a 9-year longitudinal population-based study. Lipids Health Dis. 2017;16(1):175. doi:10.1186/s12944-017-0562-y
- Shi W, Xing L, Jing L, Tian Y, Liu S. Usefulness of triglyceride-glucose index for estimating hyperuricemia risk: insights from a general population. Postgrad Med. 2019;131(5):348–356. doi:10.1080/00325481.2019.1624581
- Liu XZ, Xu X, Zhu JQ, Zhao DB. Association between three non-insulin-based indexes of insulin resistance and hyperuricemia. Clin Rheumatol. 2019;38(11):3227–3233. doi:10.1007/s10067-019-04671-6
- Dong J, Yang H, Zhang Y, Hu Q. Triglyceride-glucose index is a predictive index of hyperuricemia events in elderly patients with hypertension: a cross-sectional study. Clin Exp Hypertens. 2022;44(1):34–39. doi:10.1080/10641963.2021.1984499
- Yu C, Wang T, Zhou W, et al. Positive association between the triglyceride-glucose index and hyperuricemia in Chinese adults with hypertension: an insight from the China H-type hypertension registry study. Int J Endocrinol. 2022;2022:4272715. doi:10.1155/2022/4272715
- Han R, Zhang Y, Jiang X. Relationship between four non-insulin-based indexes of insulin resistance and serum uric acid in patients with type 2 diabetes: a cross-sectional study. Diabetes Metab Syndr Obes. 2022;15:1461–1471. doi:10.2147/DMSO.S362248
- American Diabetes Association. 2. Classification and diagnosis of diabetes: standards of medical care in diabetes-2022. Diabetes Care. 2022;45(Suppl 1):S17–S38. doi:10.2337/dc22-S002
- Liu R, Zhang Q, Peng N, et al. Inverse correlation between serum irisin and cardiovascular risk factors among Chinese overweight/obese population. BMC Cardiovasc Disord. 2021;21(1):570. doi:10.1186/s12872-021-02380-0
- Dai W, Ye L, Liu A, et al. Prevalence of nonalcoholic fatty liver disease in patients with type 2 diabetes mellitus: a meta-analysis. Medicine. 2017;96(39):e8179. doi:10.1097/MD.0000000000008179
- Mazidi M, Katsiki N, Mikhailidis DP, Banach M. The link between insulin resistance parameters and serum uric acid is mediated by adiposity. Atherosclerosis. 2018;270:180–186. doi:10.1016/j.atherosclerosis.2017.12.033
- Wu Y, He H, Yu K, et al. The association between serum uric acid levels and insulin resistance and secretion in prediabetes mellitus: a cross-sectional study. Ann Clin Lab Sci. 2019;49(2):218–223.
- Li L, Shi Z, Ma L, Lu Y. Analysis of the correlation between plasma coagulation factor VII, PAI-1, and uric acid with insulin resistance and macrovascular complications in elderly patients with type 2 diabetes. Ann Palliat Med. 2021;10(1):664–671. doi:10.21037/apm-20-2609
- Han T, Lan L, Qu R, et al. Temporal relationship between hyperuricemia and insulin resistance and its impact on future risk of hypertension. Hypertension. 2017;70(4):703–711. doi:10.1161/HYPERTENSIONAHA.117.09508
- Krishnan E, Pandya BJ, Chung L, Hariri A, Dabbous O. Hyperuricemia in young adults and risk of insulin resistance, prediabetes, and diabetes: a 15-year follow-up study. Am J Epidemiol. 2012;176(2):108–116. doi:10.1093/aje/kws002
- Zhu Y, Hu Y, Huang T, et al. High uric acid directly inhibits insulin signalling and induces insulin resistance. Biochem Biophys Res Commun. 2014;447(4):707–714. doi:10.1016/j.bbrc.2014.04.080
- McCormick N, O’Connor MJ, Yokose C, et al. Assessing the causal relationships between insulin resistance and hyperuricemia and gout using bidirectional Mendelian randomization. Arthritis Rheumatol. 2021;73(11):2096–2104. doi:10.1002/art.41779
- Nakamura K, Sakurai M, Miura K, et al. HOMA-IR and the risk of hyperuricemia: a prospective study in non-diabetic Japanese men. Diabetes Res Clin Pract. 2014;106(1):154–160. doi:10.1016/j.diabres.2014.07.006
- Toyoki D, Shibata S, Kuribayashi-Okuma E, et al. Insulin stimulates uric acid reabsorption via regulating urate transporter 1 and ATP-binding cassette subfamily G member 2. Am J Physiol Renal Physiol. 2017;313(3):F826–F834. doi:10.1152/ajprenal.00012.2017
- Kottgen A, Albrecht E, Teumer A, et al. Genome-wide association analyses identify 18 new loci associated with serum urate concentrations. Nat Genet. 2013;45(2):145–154. doi:10.1038/ng.2500
- Furuhashi M, Matsumoto M, Murase T, et al. Independent links between plasma xanthine oxidoreductase activity and levels of adipokines. J Diabetes Investig. 2019;10(4):1059–1067. doi:10.1111/jdi.12982
- Liu X, Chen Y, Boucher NL, Rothberg AE. Prevalence and change of central obesity among US Asian adults: NHANES 2011–2014. BMC Public Health. 2017;17(1):678. doi:10.1186/s12889-017-4689-6
- Liu XZ, Li HH, Huang S, Zhao DB. Association between hyperuricemia and nontraditional adiposity indices. Clin Rheumatol. 2019;38(4):1055–1062. doi:10.1007/s10067-018-4374-x
- Zong J, Sun Y, Zhang Y, et al. Correlation between serum uric acid level and central body fat distribution in patients with type 2 diabetes. Diabetes Metab Syndr Obes. 2020;13:2521–2531. doi:10.2147/DMSO.S260891
- Zhang S, Huang YP, Li J, et al. The visceral-fat-area-to-hip-circumference ratio as a predictor for insulin resistance in a Chinese population with type 2 diabetes. Obes Facts. 2022;15(4):621–628. doi:10.1159/000525545
- Sun H, Chang X, Bian N, et al. Adipose tissue insulin resistance is positively associated with serum uric acid levels and hyperuricemia in Northern Chinese adults. Front Endocrinol (Lausanne). 2022;13:835154. doi:10.3389/fendo.2022.835154
- Dorio M, Bensenor IM, Lotufo P, Santos IS, Fuller R. Reference range of serum uric acid and prevalence of hyperuricemia: a cross-sectional study from baseline data of ELSA-Brasil cohort. Adv Rheumatol. 2022;62(1):15. doi:10.1186/s42358-022-00246-3
- Liu R, Han C, Wu D, et al. Prevalence of hyperuricemia and gout in mainland China from 2000 to 2014: a systematic review and meta-analysis. Biomed Res Int. 2015;2015:762820. doi:10.1155/2015/762820
- Kikuchi A, Kawamoto R, Ninomiya D, Kumagi T. Hyperuricemia is associated with all-cause mortality among males and females: findings from a study on Japanese community-dwelling individuals. Metabol Open. 2022;14:100186. doi:10.1016/j.metop.2022.100186
- Xu JZ, Lu JL, Hu L, et al. Sex disparities in the association of serum uric acid with kidney stone: a cross-sectional study in China. Front Med. 2022;9:774351. doi:10.3389/fmed.2022.774351
- Chen L, Wu L, Li Q, et al. Hyperuricemia associated with low skeletal muscle in the middle-aged and elderly population in China. Exp Clin Endocrinol Diabetes. 2022;130:546–553. doi:10.1055/a-1785-3729
- Liu L, Lou S, Xu K, et al. Relationship between lifestyle choices and hyperuricemia in Chinese men and women. Clin Rheumatol. 2013;32(2):233–239. doi:10.1007/s10067-012-2108-z
- Eljaaly Z, Mujammami M, Nawaz SS, Rafiullah M, Siddiqui K. Risk predictors of high uric acid levels among patients with type-2 diabetes. Diabetes Metab Syndr Obes. 2021;14:4911–4920. doi:10.2147/DMSO.S344894
- Yu H, Zhao L, Liu L, et al. Relationship between serum uric acid level and nonalcoholic fatty liver disease in type 2 diabetes patients. Medicine. 2021;100(33):e26946. doi:10.1097/MD.0000000000026946
- Zhang Y, Nie FQ, Huang XB, et al. High prevalence and low awareness of hyperuricemia in hypertensive patients among adults aged 50–79 years in Southwest China. BMC Cardiovasc Disord. 2022;22(1):2. doi:10.1186/s12872-021-02427-2
- Qiu L, Cheng XQ, Wu J, et al. Prevalence of hyperuricemia and its related risk factors in healthy adults from Northern and Northeastern Chinese provinces. BMC Public Health. 2013;13:664. doi:10.1186/1471-2458-13-664
- Yang Y, Piao W, Huang K, et al. Dietary pattern associated with the risk of hyperuricemia in Chinese elderly: result from china nutrition and health surveillance 2015–2017. Nutrients. 2022;14(4):844.
- Ali N, Perveen R, Rahman S, et al. Prevalence of hyperuricemia and the relationship between serum uric acid and obesity: a study on Bangladeshi adults. PLoS One. 2018;13(11):e0206850. doi:10.1371/journal.pone.0206850
- Molla MD, Bekele A, Melka DS, et al. Hyperuricemia and its associated factors among adult staff members of the Ethiopian Public Health Institute, Ethiopia. Int J Gen Med. 2021;14:1437–1447. doi:10.2147/IJGM.S308158