
Abstract
Hepatocellular carcinoma (HCC) is the fifth most common malignancy, the third most common cause of cancer death, and the most common primary liver cancer. Overall, there is a need for more reliable biomarkers for HCC, as those currently available lack sensitivity and specificity. For example, the current gold-standard biomarker, serum alpha-fetoprotein, has a sensitivity of roughly only 70%. Cancer cells have different characteristic metabolic signatures in biofluids, compared to healthy cells; therefore, metabolite analysis in blood or urine should lead to the detection of suitable candidates for the detection of HCC. With the advent of metabonomics, this has increased the potential for new biomarker discovery. In this article, we look at approaches used to identify biomarkers of HCC using proton nuclear magnetic resonance (1H-NMR) spectroscopy of urine samples. The various multivariate statistical analysis techniques used are explained, and the process of biomarker identification is discussed, with a view to simplifying the knowledge base for the average clinician.
Background
Globally, hepatocellular carcinoma (HCC) is the fifth most common malignancy in men and the seventh in women.Citation1 HCC is up to four times more common in men and is the most common primary liver cancer,Citation2 with most cases occurring in sub-Saharan Africa and East Asia, due to the high prevalence of hepatitis B virus (HBV).Citation3–Citation5 Roughly 80% of HCCs occur on a background of cirrhosis.Citation6 The mortality rate is almost identical to the incidence, which is increasing.Citation7 However, in Taiwan, HBV vaccination programs have reduced incidence rates.Citation8
HCC is the second leading cause of cancer death, with over half a million cases diagnosed per year,Citation1 although data quality varies worldwide. Prognosis is poor, with 5-year survival <5% due to late presentation, as HCC is often asymptomatic in the early stages.Citation9 However, HCC is potentially curable, following the defined treatment algorithm,Citation10 if detected early, but liver transplantation must conform to strict criteria used to assess suitability of patients with cirrhosis and HCC, such as the Milan criteria.Citation11
In terms of the importance of this review topic, urine-based nuclear magnetic resonance studies are considered valuable methods of analyzing large quantities of data and have a wide variety of uses. Most notably of these uses is the detection of biomarkers, which have increasingly important roles in disease discovery and monitoring. Furthermore, there is the advantage of urine-based tests being noninvasive, compared to blood tests, which can cause discomfort or harm. Greater understanding of this topic offers further insight into disease development, prognosis, and pathogenesis. This is done through achieving metabolic and spectral fingerprints of urine, which allow for identification of relevant signals, that differ in ill health. These signals are ultimately processed using multivariate analysis techniques to identify biomarkers for disease, which aim to detect diseases, such as HCC, earlier to resultantly improve prognosis.
HCC risk factors
Chronic hepatitis and cirrhosis of any cause accounts for 70–90% cases of HCC occurring on a background of chronic liver disease.Citation6 Human immunodeficiency virus co-infection with either HBV or hepatitis C virus (HCV) leads to quicker progression to cirrhosis and HCC.Citation12 Of note, 80% of HCC cases occur in Eastern Asia and sub-Saharan Africa, where the main risk factor remains to be chronic HBV. HCC incidence increases when there are higher levels of HBV DNA and with a longer duration of infection.Citation13 HBV has two main ways of causing HCC:
HBV causes cirrhosis from chronic inflammation of the liver, predisposing to HCC and
HBV is directly oncogenic, whereby the virus integrates into the host genome, causing carcinogenic mutations.Citation14
By contrast, HCV is the main risk factor for HCC in Europe, North America, and Japan. Roughly 3–5% of individuals with HCV cirrhosis develop HCC per year.Citation15 Acute infection leads to chronic hepatitis and then cirrhosis, thereby leading to the risk of HCC. However, fortunately antiviral therapy may reduce this risk.Citation16 Alcohol and tobacco abuse are further risk factors for HCC. Prolonged, heavy drinking (40–60 g alcohol per day) is a well-established risk factor for HCC, independently and in combination with HCV.Citation17 Alcoholic cirrhosis has a role in up to 35% of all HCCs.Citation18,Citation19 Tobacco independently increases the risk of HCC in cirrhotic patients with a dose-dependent effect.Citation20 Furthermore, an increase in the number of cases of non-alcoholic fatty liver disease in more developed countries due to a more obesogenic environment is an emerging risk of HCC.Citation21,Citation22 However, estimates of risk are unclear. HCC has been found to be twice as likely to develop in diabetic patients compared to non-diabetics.Citation23,Citation24
Aflatoxin is a carcinogenic mycotoxin produced from certain species of fungi such as Aspergillus flavus, which colonizes food crops, most heavily impacting developing countries.Citation25 HCC occurs through chronic low-level ingestion from dietary aflatoxin contamination,Citation26 as aflatoxin is metabolized in the liver, allowing for its toxic effects to be exerted. Tumor suppressor gene p53 becomes mutated at the third position of codon 249, leading to the development of HCC.Citation27 Aflatoxin B1 is the most toxic and prevalent type, further described as the most potent known experimental carcinogen.Citation28 There is up to a 30 times increased risk of HCC when individuals are also infected with HBV, suggesting that HBV and aflatoxin promote HCC development synergistically.Citation29
Currently available biomarker: alpha-fetoprotein (AFP)
The current gold-standard and only established noninvasive diagnostic marker for HCC is serum AFP, but this fails in diagnostic performance ability, making it unreliable.Citation30 The American Association for the Study of Liver Diseases (AASLD) describes the relationship of AFP to HCC as lacking “adequate sensitivity and specificity for effective surveillance and diagnosis”.Citation10 Serum AFP level and 6-monthly ultrasound (US) scans are used for surveillance and diagnosis of HCC.Citation5 However, these are often unsuitable for resource-limited settings as imaging is often expensive or unavailable. Furthermore, sensitivity and specificity are known to be poor. Sensitivity of US to discover malignant liver lesions and characteristic changes in vascularization is often operator dependent. AFP alone has been reported to detect ~70% of HCC cases as it is only produced by about two-thirds of cases.Citation30 Area under receiver operating characteristic curve values are seen to vary between 0.60 and 0.70,Citation31 which highlights the need for a more effective diagnostic biomarker.
However, AFP is not the only available biomarker for HCC. There are many others, including cell surface heparan sulfate proteoglycan glypican 3, circulating microRNAs (miRNAs), and abnormal coagulation protein des-gamma carboxyprothrombin, also known as PIVKA-II (protein induced by vitamin K absence or antagonist II). Despite having great potential, the sensitivity and specificity of these have been disappointing and consequently none are routinely used in clinical practice around the world.
Metabonomics and its utility in HCC
To study disease biomarkers, metabonomics can be used. It has been defined by Nicholson et al as “the quantitative measurement of the dynamic multiparametric metabolic response of living systems to pathophysiological stimuli or genetic modification”.Citation32 This differs from metabolomics which identifies and analyzes all metabolites in a system,Citation33,Citation34 although terms are often used interchangeably. Metabonomics is useful to investigate HCC, because in terms of molecular pathogenesis, there are 30–40 mutations per tumor,Citation35 and according to the Warburg hypothesis, tumors have altered metabolism compared to healthy cells.Citation36,Citation37 More specifically, there are variations in mitochondrial respiration as malignant tissue consumes more glucose. Consequently, the key focus is on metabolites associated with energy, altered lipid metabolism, and membrane turnover for identification of potential HCC biomarkers.Citation38 Once identified, in the future, these biomarkers would have the potential to be detected in urine using a simple dipstick test, with the aim for it to be cheap and readily available at the point of care, to help identify the presence of HCC.
Why use urine in metabonomic studies to identify biomarkers?
Urine is a stable and convenient biofluid for metabonomics because collection is noninvasive and easily accessible. Urine can be used for widespread screening and surveillance through a simple dipstick test, suited to the developing world where cost and access to imaging techniques are more problematic. Consequently, work is being done involving urine samples to identify and validate metabolites for HCC that could act as potential biomarkers for accurate detection of the disease.
Proton nuclear magnetic resonance (1H-NMR) spectroscopy background
The NMR phenomenon can be applied as magnetic resonance imaging (MRI) to provide anatomical structural details and study tissue metabolism in vivo. However, for the analysis of urine samples, 1H-NMR spectroscopy is used, which is a noninvasive analytical chemistry technique and is used to determine protein structure and chemical composition of biofluids. A familiarity and basic knowledge of 1H-NMR theory for readers is assumed.
Furthermore, 1H-NMR spectroscopy has been used for metabolic phenotyping since the 1980s. Mass spectrometry (MS) is more sensitive, but 1H-NMR is more robust and versatile, with very high reproducibility when there is consistent sample preparation and setup.Citation39 The use of 1H-NMR spectroscopy for biomarker discovery has the advantage of simpler sample preparation and more reproducible results. However, it is not as sensitive as liquid chromatography mass spectrometry (LCMS) and it has the challenge of signal overlap leading to difficulty in making assignments. While LCMS offers greater sensitivity, it is more laborious to set up and results depend on individual experimental conditions which make metabolite assignments and data analysis more challenging. 1H-NMR is non-destructive and, therefore, precious samples can be reused for biomarker determination, unlike in MS. Consequently, 1H-NMR spectroscopy is deemed to be a well-suited technique for analysis of samples in metabonomic studies. As neither technique can detect all chemical compounds present in a biofluid sample, the two approaches should be considered complementary in the discovery of biomarkers. This review will focus on the workflow of biomarker discovery using 1H-NMR.
Chemical shift and metabolite interpretation
The chemical shift phenomenon refers to the differences in electron density surrounding nuclei depending on the local chemical environment within molecules which causes variation in the opposing magnetic field.Citation40 This is integral in 1H-NMR spectroscopy for metabolite interpretation and biomarker identification in metabonomics. Chemical shift is calculated by determining the difference in resonance frequency of the nucleus, against a standard. 3-(Trimethylsilyl)-2,2′,3,3′-tetradeuteropropionic acid (TSP) is most commonly used as an internal chemical shift reference in metabonomics for reasons listed in .Citation41,Citation42 However, TSP can be affected by protein in urine, causing the peak to become smaller and wider, as protein binds to TSP. Peak position is indicative of the chemical environment, whereas peak area is proportional to the number of nuclei with the same chemical environment generating the signal and the overall concentration of the compound in the sample.
Table 1 Reasons for using TSP as a reference standard during 1H-NMR spectroscopy
Chemical shift (d) is expressed on the horizontal scale, where TSP is assigned to zero parts per million (ppm) to serve as the reference peak. ppm measures frequency signals instead of Hertz, on the x-axis, as it more simply represents frequency and aids comparison of spectra from spectrometers with different magnetic strength. Moreover, ppm is used when assigning metabolite identity to determine what is present in a sample.
NMR applications within hepatology
NMR spectroscopy has several versatile research applications in hepatology, as the liver has a variety of metabolic and detoxification functions to be assessed and interpreted. These include using markers to assess the functional capacity of the cirrhotic liver,Citation43 grading liver disease in hepatitis C,Citation44 and identifying biomarkers of cholangiocarcinoma in bile.Citation45 Advancements are constantly being developed to improve NMR performance, such as the ongoing invention of the “microcoil” for enhanced resolution of in vivo MRI.Citation46 Metabonomic biomarker discovery is an important application of 1H-NMR within hepatology, as many papers are now focused on identifying biomarkers in HCC. However, it must be noted that 1H-NMR is not intended to be a replacement for imaging but is to be used as a complementary technique.
In vitro urine 1H-NMR spectra
1H-NMR spectroscopy of urine aims to acquire high-resolution spectra, to determine composition by identifying metabolites, without prior structural knowledge. Sample randomization prior to analysis is important to avoid bias from operator differences or conditions.Citation47 The 1H-NMR urine spectrum is generally composed of low molecular weight metabolites, forming thousands of sharp resonances.Citation48 Urine has a high water content; therefore, water suppression achieved by constant irradiation which saturated the resonance of water is key to reduce interference for optimum detection of metabolites. 1H-NMR offers high reproducibility without compensating throughput; therefore, spectra of the same urine sample should be superimposable, making it a suitable mode of analysis for detecting potential biomarkers of HCC.
High-quality samples are required for successful metabonomic studies, but quality may have varied between samples in different studies. Similarly, in comparison, some samples will have been left in the NMR spectrometer for longer than others. Although, like the logistical delay between collecting and analyzing samples, this is not expected to impact upon the urinary 1H-NMR profile, as urine is metabolically stable unless contaminated.Citation49 However, several factors influence urinary metabolic profiles.
Factors affecting 1H-NMR urine spectra
A variety of factors can affect the utility of biomarkers in HCC due to variations in 1H-NMR urine spectra which impacts upon the identification of metabolites as potential biomarkers. However, given the vast assortment of metabolites found in urine, wide variations in human gene-environment exposure can make disease biomarkers even more difficult to identify.Citation50
Diet affects the gut microbiome and is the biggest contributor altering urinary metabolites. This has been demonstrated by studies considering dietary variation and metabolic profiles of urine, showing diet can be a confounding factor in disease biomarker studies. For example, variations in urinary metabolites are seen between vegetarian diets and in meat eaters, thereby suggesting differences in urine metabolic signatures, based on diet. Diets including meat have shown increased concentrations of metabolites, such as creatinine, carnitine, acetylcarnitine, and trimethylamine-N-oxide (TMAO). In contrast, those on vegetarian diets have higher levels of p-hydroxy phenylacetate, suggesting that alterations in the microbiome and diet contribute to urinary metabolic profile.Citation42 Moreover, urine samples are more affected by changes in the diet than serum samples.Citation51
Drugs such as non-steroidal anti-inflammatory drugs can affect the metabolic composition of urine.Citation52 Most notably, antibiotics affect the gut microbiome, which may alter urinary metabolites.Citation53 Similarly, paracetamol metabolites in urine heavily influence analysis and therefore they could be justifiably excluded from further analysis if discovered.Citation54 Dietary supplements, herbal remedies, and over-the-counter medications can in cases be found in urine, but with difficulty to determine the identity of the compound.Citation47 Overall, interference by drug metabolites can cause changes in urine composition to be more difficult to identify or missed altogether. Likewise, urinary changes have been identified due to diabetes.Citation55,Citation56 If diabetes is detected in urine spectra by high glucose, the peak should be removed from analysis if possible. The whole sample should be justifiably excluded from further analysis because if the peak is so strong it biases the model.
The degree of physical activity is directly associated with metabolism, whereby different levels of exercise have short- and long-term effects. For example, urine lactate increases after exercise,Citation57 among a variety of other changes in urinary metabolites. 1H-NMR has the potential to differentiate between urine taken before and after exercise, according to metabolic profile.Citation58 Genetic factors contribute to the high variability of the human urine metabolome due to inter-individual differences.Citation47 Age has also been suggested to play a role in urine metabolite levels as 1H-NMR spectra have been found to distinguish between those of young and old.Citation59 Furthermore, time of sample collection is important to monitor and keep consistent, as some studies have seen diurnal variation in all urine samples.Citation60
Metabolites found to be discriminatory for HCC
Hormone profiles differ between men and women and significant differences in steroid metabolite excretion profiles have been identified, among other metabolite variations affecting 1H-NMR urine spectra.Citation61 Moreover, female hormones are known to be protective against HCC, whereas male hormones, like testosterone, have been shown to correlate with HCC risk.Citation62 Evidence suggests this could relate to interleukin-6 (IL-6), which is a mediator synthesized by Kupffer cells that promotes HCC but is inhibited by estrogens. In mouse models, when IL-6 was ablated, there were no longer gender differences in hepatocarcinogenesis.Citation63
Altered composition of urinary metabolites in HCC vs controls has been previously confirmed by 1H-NMR studies,Citation38,Citation49,Citation54,Citation64 whereby reportedly discriminatory candidate biomarkers are described in . However, in most cases, there is also a general trend in the difference between HCC and cirrhotic patients, but not often shown to be significant. Many Chinese studiesCitation65–Citation69 have also been carried out comparing HCC with healthy controls by considering HCC urinary biomarkers using MS, but there is a need for more large-scale African studies, where HCC is an issue of equivalent magnitude. Each study highlights the need for further validation studies to discriminate between metabolic phenotypes of disease states alone, such as HCC, HBV, and cirrhosis, as most HCCs occur on the background of cirrhosis; therefore, metabolic differences in chronic liver disease also need to be identified. Creatinine,Citation49,Citation54,Citation64,Citation65 hippurate,Citation49,Citation64 citrate,Citation64,Citation67 and carnitineCitation49,Citation54 are the main metabolites corroboratively reported to be discriminant in HCC based on independent studies. For more information beyond the scope of this review, the uses and derivation of notable metabolites in HCC are detailed in a thorough review by Kimhofer et al.Citation70
Table 2 Previously published studies aiming to identify HCC biomarkers through analysis of urine by 1H-NMR spectroscopy
Creatinine is the breakdown product of creatine phosphate in muscle; therefore, reduced creatinine may be found because of decreased muscle mass, linked to cancer cachexia. Renal impairment causes increased serum creatinine and, therefore, it is important to check for differences in renal function between disease classes. Dietary animal protein increases creatinine levels,Citation38 but it is rare for sub-Saharan individuals to consume much meat due to economic constraints. Diet in sub-Saharan Africa mostly consists of vegetables and crops, such as yam, and fish in coastal regions. Overall, the reduction of creatinine in previous publications is likely to be due to the diverse effects of the tumor on physiology.Citation49,Citation54,Citation64,Citation65
Benzoate is formed by the metabolism of gut microbes from dietary aromatic compounds due to reduced hepatic function in HCC.Citation71,Citation72 Consequently, hippurate, an acyl glycine formed by conjugation of benzoate and glycine in liver and kidney mitochondria,Citation73 may act as a surrogate marker of hepatic function. Hippurate levels have been found to be reduced in previous studiesCitation38,Citation49,Citation64 due to less efficient benzoate conjugation, possibly from dysbiosis of microbiota, because of the disease.
Previous publications have also reported a reduction of citrate in HCC.Citation38,Citation64,Citation67 Citrate is an intermediate in the Krebs cycle and, therefore, downregulation of citrate follows the Warburg effect relating to alterations in mitochondrial aerobic respiration of tumor cells.Citation36,Citation37 However, this is not specific for HCC. Citrate concentration has been shown to be higher in women, which is postulated to relate to estrogen levels,Citation74,Citation75 but more research is required.
Carnitine is mainly derived from the diet and has an essential role in mitochondrial metabolic pathways as a product of tumor respiration.Citation64 Significantly raised urinary carnitine levels have been found in HCC,Citation49,Citation54 whereas in healthy individuals <5% is usually excreted.Citation76 Carnitine overproduction may result from rapid tumor growth, fueled by increased mitochondrial activity. Carnitine is important for energy metabolism, specifically as a cofactor to transport fatty acids from cytosol to mitochondria for the initial phase of beta-oxidation.Citation77
Process of biomarker determination
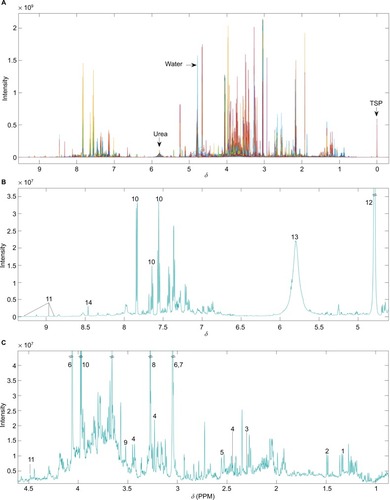
There is quite a challenging process involved in biomarker determination, involving several important steps. 1H-NMR spectral data must be acquired from urine samples following standardized protocols conforming to experimental protocols by Dona et alCitation48 and then must be matched with associated demographic and anonymized clinical data. Pre-processing is carried out on the unedited spectra (), involving the removal of the uninformative TSP, water and urea regions, alignment, and normalization.
Figure 1 (A) Unedited 1H-NMR spectra example. Different colors correspond to individual samples overlaid. (B) Median spectra of unedited data for ppm values ranging from above 4.5 to below 9.5. (C) Median spectra of unedited data for ppm values ranging from 1 to 4.5. Numbers indicate the following commonly reported metabolites – 1: lactate; 2: alanine; 3: acetoacetate; 4: carnitine; 5: citrate; 6: creatinine; 7: creatine; 8: TMAO; 9: glycine; 10: hippurate; 11: 1-methylnicotinamide; 12: water; 13: urea; 14: formate.
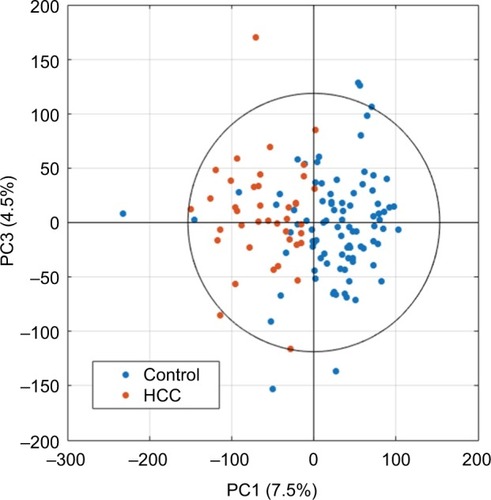
After editing of spectra, scaled principal component analysis (PCA) score plots () can be generated to summarize all samples, with potential to identify trends in data, and remove outliers determined by the Hotelling T2 confidence interval,Citation78 if well-reasoned, such as interference from drug metabolites or glucose. PCA is an unsupervised method involving principal components that are linearly uncorrelated coordinates used to express the greatest variance within a data set in decreasing orthogonal fashion. Component scores describe variations between samples.Citation79
Figure 2 Example of univariance scaled PCA scores plot after data processing using the first and third principal components.
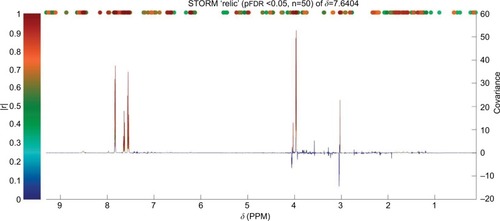
Orthogonal partial least-squares discriminant analysis is a supervised method used to generate loadings plots. These show statistical deviations in response to the difference between the variable of interest, used to help determine peaks that significantly differ, such as the classification of different patient groups or certain clinical measurements ().
Figure 3 Loading plot from an OPLS-DA model built using HCC and healthy control as disease classes pairwise.
Abbreviations: HCC, hepatocellular carcinoma; OPLS-DA, orthogonal partial least squares discriminant analysis; pFDR, false discovery rate; δ, chemical shift; PPM, parts per million.
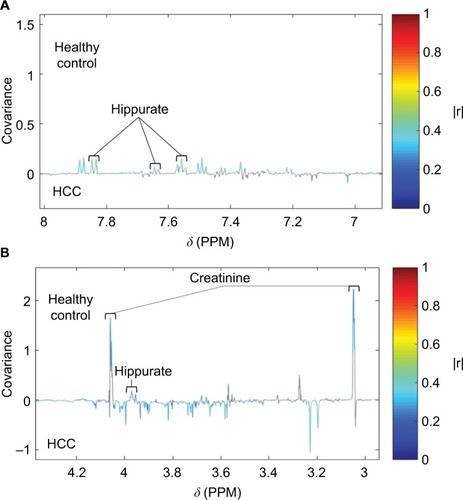
Statistical total correlation spectroscopy (STOCSY) is a technique developed by Cloarec et al to help determine the chemical structure of the molecule responsible for a peak of interest.Citation80 Signals are identified from specific metabolites as well as associated signals involved in the same pathway. This is done by inputting ppm value of a signal and then the correlation between resonances is calculated. Posma et al’s development of subset optimization by reference matching (STORM)Citation50 offers improved visualization of peaks (), compared to STOCSY, as well as the ability to select subsets of 1H-NMR spectra. This optimizes the statistical approach to identify and assign metabolites.
Figure 4 Identification of peaks from the same compound (hippurate) using STORM.Citation50 Significant signals (pFDR<0.05) are shown in colors corresponding to the correlation coefficient (|r|).
However, multiple testing is prone to false positives; therefore, to help determine the true significance of signals, Bonferroni–HochbergCitation81 method of p-value correction for multiple testing is an important step to include to ensure significant results are not due to chance.Citation82
Assignment of metabolites is then done by comparing spectral signals to published literature and databases, such as the Human Metabolome Database (HMDB), or by searching internal reference databases according to metabolite name or ppm value of 1H-NMR signal. Furthermore, experiments involving spiked-in quantities of putatively assigned metabolites act as the gold standard, forming the basis of biomarker discovery.
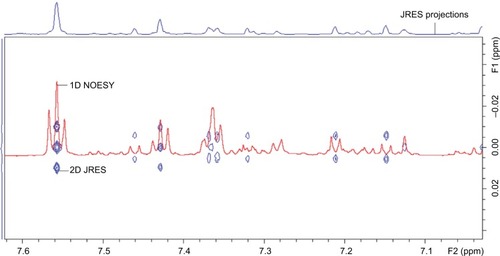
Furthermore, two-dimensional (2D) JRES (J-resolved spectroscopy)Citation83 1H-NMR data is useful alongside the overlay of one-dimensional (1D) spectra to verify multiplicity of peak signals (). In general, 2D NMR is mainly used to provide additional detail of complicated molecular structures, through increased scan number.Citation84
Figure 5 Example of 2D JRES image (blue) with 1D NOESY spectra overlaid (red) used to verify multiplicity.
Abbreviations: JRES, J-resolved spectroscopy; 2D, two-dimensional; 1D, one-dimensional; NOESY, nuclear Overhauser effect spectroscopy; ppm, parts per million.
One limitation of publications so far is that many compounds are yet to be identified due to peak overlap being problematic for assignment and metabolites not documented in databases. 2D NMR data is underused, such as correlation spectroscopyCitation85 and total correlation spectroscopy.Citation86 However, they can aid confirmation of metabolite assignments by providing additional information about the relationship between peaks, to help with overlap. Similarly, more studies including spike-in experiments are required to confirm metabolite identity, which involves analyzing authentic compounds added to samples, to observe the peaks produced. However, both 1D and 2D NMR can sometimes be inconclusive, making metabolite assignment more challenging. For instance, in cases where spectra are of poor quality, insufficient intensity, or have resonance overlap.
Conclusion
This review is based on the observation of an unmet medical need for an effective, reliable, and affordable diagnostic HCC test. HCC is an important issue due to its poor prognosis and late diagnosis.Citation87 Consequently, in some parts of the world, HCC is the leading cause of death for those under 40 years old.Citation5 Urine is a suitable biofluid for 1H-NMR spectroscopy to detect significant markers of HCC, as urine samples are easily accessible and acceptable to patients. Similarly, the development of a simple urine dipstick test for HCC based on the diverse effects of HCC tumorigenesis on metabolic pathways would be inexpensive and convenient for use in resource-deprived areas, where HCC incidence is highest.Citation3,Citation4 1H-NMR spectroscopy is useful in the development of a candidate biomarker panel. Such dipstick technology is a future line of research but has not yet been effected. Metabonomic studies and biomarkers are now even more essential to continue improving as we need to be looking beyond the genome to make more progress toward facilitating the diagnosis, treatment, and cure of HCC.
Future directions
Overall, studies so far suggest that urinary diagnostics are possible, and metabolites associated with energy, altered lipid metabolism, and markers of cell membrane turnover are probably discriminatory for HCC. However, larger studies are required, involving multiple sample populations, including different geographical locations, genetics, and etiologies of HCC. Furthermore, it is important to pay attention to confounding factors of 1H-NMR in studies, such as diet, smoking, and drugs. The inclusion of more women is also key to identifying and confirming the significant metabolites for a diagnostic panel of HCC biomarkers. Further independent validation studies of new sample sets are needed, with comprehensive clinical data, including AFP for comparison of diagnostic performance against any potential new biomarkers identified for HCC. Ultimately, this should lead to the development of a novel pregnancy test–style urine dipstick test for HCC, which is theoretically plausible, and possible in the future, after further research and development. Biomarkers in HCC could have a massive medical impact in alleviating disease burden through low cost, earlier detection, and before the cancer stage is too late for curative treatment.
Acknowledgments
All authors acknowledge the support of the National Institute for Health Research Biomedical Research Centre at Imperial College London for infrastructure support. We would like to express our gratitude to the Imperial College President’s PhD Scholarship and the Stratified Medicine Graduate Training Programme in Systems Medicine and Spectroscopic Profiling (STRATiGRAD) for funding MRAU.
Disclosure
SDT-R holds grants from the United Kingdom Medical Research Council and the Wellcome Trust Institutional Strategic Support Fund (ISSF). The authors report no other conflicts of interest in this work.
References
- MittalSEl-SeragHBEpidemiology of HCC: consider the populationJ Clin Gastroenterol201347S223632345
- HefaiedhREnnaiferRRomdhaneHGender difference in patients with hepatocellular carcinomaTunis Med20139150550824227507
- FerlayJSoerjomataramIDikshitRCancer incidence and mortality worldwide: sources, methods and major patterns in GLOBOCAN 2012Int J Cancer20151365E359E38625220842
- ParkinDMBrayFFerlayJJemalACancer in africa 2012Cancer Epidemiol Biomarkers Prev201423695396624700176
- ShariffMICoxIJGomaaAIKhanSAGedroycWTaylor-RobinsonSDHepatocellular carcinoma: current trends in worldwide epidemiology, risk factors, diagnosis and therapeuticsExpert Rev Gastroenterol Hepatol20093435336719673623
- El-SeragHBRudolphKLHepatocellular carcinoma: epidemiology and molecular carcinogenesisGastroenterology200713272557257617570226
- JemalABrayFCenterMMFerlayJWardEFormanDGlobal cancer statisticsCA Cancer J Clin2011612699021296855
- ChangM-HYouS-LChenC-JDecreased incidence of hepatocellular carcinoma in hepatitis B vaccinees: a 20-year follow-up studyJ Natl Cancer Inst2009101191348135519759364
- HolmesEWijeyesekeraATaylor-RobinsonSDNicholsonJKThe promise of metabolic phenotyping in gastroenterology and hepatologyNat Rev Gastroenterol Hepatol201512845847126194948
- BruixJShermanMManagement of hepatocellular carcinoma: an updateHepatology20115331020102221374666
- MazzaferroVLlovetJMMiceliRPredicting survival after liver transplantation in patients with hepatocellular carcinoma beyond the Milan criteria: a retrospective, exploratory analysisLancet Oncol2009101354319058754
- MacdonaldDCNelsonMBowerMPowlesTHepatocellular carcinoma, human immunodeficiency virus and viral hepatitis in the HAART eraWorld J Gastroenterol20081411165718350596
- ChenC-JYangH-ISuJRisk of hepatocellular carcinoma across a biological gradient of serum hepatitis B virus DNA levelJAMA20062951657316391218
- ChenJDYangHIIloejeUHCarriers of inactive hepatitis B virus are still at risk for hepatocellular carcinoma and liver-related deathGastroenterology2010138517471754.e174120114048
- FornerALlovetJMBruixJHepatocellular carcinomaLancet201237998221245125522353262
- SingalAKSinghAJaganmohanSAntiviral therapy reduces risk of hepatocellular carcinoma in patients with hepatitis C virus–related cirrhosisClin Gastroenterol Hepatol20108219219919879972
- DonatoFTaggerAGelattiUAlcohol and hepatocellular carcinoma: the effect of lifetime intake and hepatitis virus infections in men and womenAm J Epidemiol2002155432333111836196
- HassanMMHwangLYHattenCJRisk factors for hepatocellular carcinoma: synergism of alcohol with viral hepatitis and diabetes mellitusHepatology20023651206121312395331
- Schöniger-HekeleMMüllerCKutilekMOesterreicherCFerenciPGanglAHepatocellular carcinoma in Austria: aetiological and clinical characteristics at presentationEur J Gastroenterol Hepatol200012894194810958223
- MarreroJAFontanaRJFuSConjeevaramHSSuGLLokASAlcohol, tobacco and obesity are synergistic risk factors for hepatocellular carcinomaJ Hepatol200542221822415664247
- MichelottiGAMachadoMVDiehlAMNAFLD, NASH and liver cancerNat Rev Gastroenterol Hepatol2013101165666524080776
- Neuschwander-TetriBACaldwellSHNonalcoholic steatohepatitis: summary of an AASLD Single Topic ConferenceHepatology20033751202121912717402
- El-SeragHBHampelHJavadiFThe association between diabetes and hepatocellular carcinoma: a systematic review of epidemiologic evidenceClin Gastroenterol Hepatol20064336938016527702
- El-seragHBTranTEverhartJEDiabetes increases the risk of chronic liver disease and hepatocellular carcinomaGastroenterology2004126246046814762783
- KewMCAflatoxins as a cause of hepatocellular carcinomaJ Gastrointestin Liver Dis201322330531024078988
- XiaQHuangX-YXueFGenetic polymorphisms of DNA repair genes and DNA repair capacity related to aflatoxin b1 (AFB1)-induced DNA damagesChenCNew Research Directions in DNA RepairInTech Publishers2013377412
- AguilarFHussainSPCeruttiPAflatoxin B1 induces the transversion of G--> T in codon 249 of the p53 tumor suppressor gene in human hepatocytesProc Natl Acad Sci U S A19939018858685908397412
- IARC Working Group on the Evaluation of Carcinogenesis Risks to HumansSome traditional herbal medicines, some mycotoxins, naphthalene and styreneIARC Monogr Eval Carcinog Risks Hum200282155612687954
- TillettTCarcinogenic crops: analyzing the effect of aflatoxin on global liver cancer ratesEnviron Health Perspect20101186A258
- FarinatiFMarinoDDe GiorgioMDiagnostic and prognostic role of α-fetoprotein in hepatocellular carcinoma: both or neither?Am J Gastroenterol2006101352453216542289
- GianniniEGMarencoSBorgonovoGAlpha-fetoprotein has no prognostic role in small hepatocellular carcinoma identified during surveillance in compensated cirrhosisHepatology20125641371137922535689
- NicholsonJKLindonJCHolmesE‘Metabonomics’: understanding the metabolic responses of living systems to pathophysiological stimuli via multivariate statistical analysis of biological NMR spectroscopic dataXenobiotica199929111181118910598751
- EverettJRA new paradigm for known metabolite identification in metabonomics/metabolomics: metabolite identification efficiencyComput Struct Biotechnol J20151313114425750701
- FiehnOMetabolomics – the link between genotypes and phenotypesPlant Mol Biol2002481–215517111860207
- VillanuevaALlovetJMLiver cancer in 2013: mutational landscape of HCC – the end of the beginningNat Rev Clin Oncol2014112737424395088
- LocasaleJWCantleyLCAltered metabolism in cancerBMC Biol2010818820598111
- WarburgOÜber den stoffwechsel der carcinomzelle. [The metabolism of the carcinoma cell]Naturwissenschaften1924125011317 German
- LadepNGDonaACLewisMRDiscovery and validation of urinary metabotypes for the diagnosis of hepatocellular carcinoma in West AfricansHepatology20146041291130124923488
- EmwasA-HMThe strengths and weaknesses of NMR spectroscopy and mass spectrometry with particular focus on metabolomics researchMethods Mol Biol2015127716119325677154
- HornakJPNMR Spectroscopy2017 Available from: https://www.cis.rit.edu/htbooks/nmr/chap-4/chap-4.htm#4.1Accessed March 10, 2017
- HolzgrabeUWawerIDiehlBNMR Spectroscopy in Pharmaceutical AnalysisAmsterdam, The NetherlandsElsevier2011
- StellaCBeckwith-HallBCloarecOSusceptibility of human metabolic phenotypes to dietary modulationJ Proteome Res20065102780278817022649
- Taylor-RobinsonSDSargentoniJBellJDIn vivo and in vitro hepatic 31P magnetic resonance spectroscopy and electron microscopy of the cirrhotic liverLiver Int1997174198209
- LimAKPatelNHamiltonGHajnalJVGoldinRDTaylor-RobinsonSDThe relationship of in vivo31P MR spectroscopy to histology in chronic hepatitis CHepatology200337478879412668971
- KhanSACoxIJThillainayagamAVBansiDSThomasHCTaylor-RobinsonSDProton and phosphorus-31 nuclear magnetic resonance spectroscopy of human bile in hepatopancreaticobiliary cancerEur J Gastroenterol Hepatol200517773373815947550
- AhmadMSymsRYoungICatheter-based flexible microcoil RF detectors for internal magnetic resonance imagingJ Micromech Microeng2009197074011
- EmwasA-HLuchinatCTuranoPStandardizing the experimental conditions for using urine in NMR-based metabolomic studies with a particular focus on diagnostic studies: a reviewMetabolomics201511487289426109927
- DonaACJiménezBSchäferHPrecision high-throughput proton NMR spectroscopy of human urine, serum, and plasma for large-scale metabolic phenotypingAnal Chem201486199887989425180432
- CoxIJAlievAECrosseyMMUrinary nuclear magnetic resonance spectroscopy of a Bangladeshi cohort with hepatitis-B hepatocellular carcinoma: a biomarker corroboration studyWorld J Gastroenterol20162216419127122669
- PosmaJMGarcia-PerezIDe IorioMSubset optimization by reference matching (STORM): an optimized statistical approach for recovery of metabolic biomarker structural information from 1H NMR spectra of biofluidsAnal Chem20128424106941070123151027
- WalshMCBrennanLMalthouseJPGRocheHMGibneyMJEffect of acute dietary standardization on the urinary, plasma, and salivary metabolomic profiles of healthy humansAm J Clin Nutr200684353153916960166
- LeverenceRAveryMJKavetskaiaOBiHHopCEGusevAISignal suppression/enhancement in HPLC-ESI-MS/MS from concomitant medicationsBiomed Chromatogr200721111143115017582231
- Romick-RosendaleLEGoodpasterAMHanwrightPJNMR-based metabonomics analysis of mouse urine and fecal extracts fol-lowing oral treatment with the broad-spectrum antibiotic enrofloxacin (Baytril)Magn Reson Chem200947S1S36S4619768747
- ShariffMILadepNGCoxIJCharacterization of urinary biomarkers of hepatocellular carcinoma using magnetic resonance spectroscopy in a Nigerian populationJ Proteome Res2010921096110319968328
- CuledduNChessaMPorcuMCNMR-based metabolomic study of type 1 diabetesMetabolomics20128611621169
- SalekRMMaguireMLBentleyEA metabolomic comparison of urinary changes in type 2 diabetes in mouse, rat, and humanPhysiol Genomics20072929910817190852
- EneaCSeguinFPetitpas-MulliezJ1H NMR-based metabolomics approach for exploring urinary metabolome modifications after acute and chronic physical exerciseAnal Bioanal Chem201039631167117619943160
- PechlivanisAKostidisSSaraslanidisP1H NMR-based metabonomic investigation of the effect of two different exercise sessions on the metabolic fingerprint of human urineJ Proteome Res20109126405641620932058
- SlupskyCMRankinKNWagnerJInvestigations of the effects of gender, diurnal variation, and age in human urinary metabolomic profilesAnal Chem200779186995700417702530
- LenzEMBrightJWilsonIDMorganSNashAA 1H NMR-based metabonomic study of urine and plasma samples obtained from healthy human subjectsJ Pharm Biomed Anal20033351103111514656601
- ShamimWYousufuddinMBakhaiACoatsAJHonourJWGender differences in the urinary excretion rates of cortisol and androgen metabolitesAnn Clin Biochem200037677077411085621
- M-WYuC-JChenElevated serum testosterone levels and risk of hepatocellular carcinomaCancer Res19935347907948381328
- NauglerWESakuraiTKimSGender disparity in liver cancer due to sex differences in MyD88-dependent IL-6 productionScience2007317583412112417615358
- ShariffMIGomaaAICoxIJUrinary metabolic biomarkers of hepatocellular carcinoma in an Egyptian population: a validation studyJ Proteome Res20111041828183621275434
- ChenJWangWLvSMetabonomics study of liver cancer based on ultra performance liquid chromatography coupled to mass spectrometry with HILIC and RPLC separationsAnal Chim Acta200965013919720165
- JengLBLoWYHsuWYAnalysis of urinary nucleosides as helper tumor markers in hepatocellular carcinoma diagnosisRapid Commun Mass Spectrom200923111543154919399767
- ShaoYZhuBZhengRDevelopment of urinary pseudotargeted LC-MS-based metabolomics method and its application in hepatocellular carcinoma biomarker discoveryJ Proteome Res201414290691625483141
- WuHXueRDongLMetabolomic profiling of human urine in hepatocellular carcinoma patients using gas chromatography/mass spectrometryAnal Chim Acta200964819810419616694
- ZhangASunHYanGHanYYeYWangXUrinary metabolic profiling identifies a key role for glycocholic acid in human liver cancer by ultra-performance liquid-chromatography coupled with high-definition mass spectrometryClin Chim Acta2013418869023313056
- KimhoferTFyeHTaylor-RobinsonSThurszMHolmesEProteomic and metabonomic biomarkers for hepatocellular carcinoma: a comprehensive reviewBr J Cancer20151127114125826224
- NicholsonJKHolmesEWilsonIDGut microorganisms, mammalian metabolism and personalized health careNat Rev Microbiol20053543143815821725
- RechnerARKuhnleGBremnerPHubbardGPMooreKPRice-EvansCAThe metabolic fate of dietary polyphenols in humansFree Radic Biol Med200233222023512106818
- SchachterDTaggartJVBenzoyl coenzyme A and hippurate synthesisJ Biol Chem1953203292593413084662
- HodgkinsonACitric acid excretion in normal adults and in patients with renal calculusClinical Sci19622320313963791
- ZuppiCMessanaIForniF1H NMR spectra of normal urines: reference ranges of the major metabolitesClin Chim Acta1997265185979352132
- ReboucheCJKinetics, pharmacokinetics, and regulation of l-carnitine and acetyl-l-carnitine metabolismAnn N Y Acad Sci200410331304115591001
- VazFMWandersRJCarnitine biosynthesis in mammalsBiochem J2002361341742911802770
- HotellingHThe most predictable criterionJ Educ Psychol1935262139
- BjerrumJTNielsenOHWangYLOlsenJTechnology insight: metabonomics in gastroenterology – basic principles and potential clinical applicationsNat Clin Pract Gastroenterol Hepatol20085633234318431374
- CloarecODumasM-ECraigAStatistical total correlation spectroscopy: an exploratory approach for latent biomarker identification from metabolic 1H NMR data setsAnal Chem20057751282128915732908
- BenjaminiYHochbergYControlling the false discovery rate: a practical and powerful approach to multiple testingJ R Stat Soc B (Methodological)199557289300
- BroadhurstDIKellDBStatistical strategies for avoiding false discoveries in metabolomics and related experimentsMetabolomics200624171196
- AueWKarhanJErnstRHomonuclear broad band decoupling and two-dimensional J-resolved NMR spectroscopyJ Chem Phys1976641042264227
- FrydmanLScherfTLupulescuAThe acquisition of multidimensional NMR spectra within a single scanProc Natl Acad Sci U S A20029925158581586212461169
- AueWBartholdiEErnstRRTwo-dimensional spectroscopy. Application to nuclear magnetic resonanceJ Chem Phys197664522292246
- BraunschweilerLErnstRCoherence transfer by isotropic mixing: application to proton correlation spectroscopyJ Magn Reson (1969)1983533521528
- ColomboMNatural history of hepatocellular carcinomaCancer Imaging200551858816154825