
 ?Mathematical formulae have been encoded as MathML and are displayed in this HTML version using MathJax in order to improve their display. Uncheck the box to turn MathJax off. This feature requires Javascript. Click on a formula to zoom.
Abstract
Visceral leishmaniasis (VL) is a fatal, vector-borne disease caused by the intracellular protozoa of the genus Leishmania. Most of the therapeutics for VL are toxic, expensive, or ineffective. Sesquiterpenes are a new class of drugs with proven antimicrobial and antiviral activities. Artemisinin is a sesquiterpene lactone with potent antileishmanial activity, but with limited access to infected cells, being a highly lipophilic molecule. Association of artemisinin with liposome is a desirable strategy to circumvent the problem of poor accessibility, thereby improving its efficacy, as demonstrated in a murine model of experimental VL. Nanoliposomal artemisinin (NLA) was prepared by thin-film hydration method and optimized using Box–Behnken design with a mean particle diameter of 83±16 nm, polydispersity index of 0.2±0.03, zeta potential of −27.4±5.7 mV, and drug loading of 33.2%±2.1%. Morphological study of these nanoliposomes by microscopy showed a smooth and spherical surface. The mechanism of release of artemisinin from the liposomes followed the Higuchi model in vitro. NLA was free from concomitant signs of toxicity, both ex vivo in murine macrophages and in vivo in healthy BALB/c mice. NLA significantly denigrated the intracellular infection of Leishmania donovani amastigotes and the number of infected macrophages ex vivo with an IC50 of 6.0±1.4 µg/mL and 5.1±0.9 µg/mL, respectively. Following treatment in a murine model of VL, NLA demonstrated superior efficacy compared to artemisinin with a percentage inhibition of 82.4%±3.8% in the liver and 77.6%±5.5% in spleen at the highest dose of 20 mg/kg body weight with modulation of cell-mediated immunity towards protective Th1 type. This study is the first report on the use of a liposomal drug delivery system for artemisinin as a promising alternative intervention against VL.
Introduction
Visceral leishmaniasis (VL), also known as kala azar in India, is a parasitic disease caused by the Leishmania donovani complex, which includes L. donovani and Leishmania chagasi. VL is a life-threatening illness in the tropical and subtropical regions of the world with an estimated 0.2–0.4 million cases reported yearly.Citation1 VL is endemic in >62 countries, with >90% cases occurring in just five countries, namely Brazil, Sudan, India, Nepal, and Bangladesh.Citation2 It is categorized as a neglected tropical disease in terms of drug discovery, and in the absence of any vaccines, current treatment relies on a handful of drugs. Thus, there is a dire need to explore new antileishmanial agents that are effective, safe, and inexpensive to eradicate this malady. Plant-derived natural products, especially secondary metabolites, constitute a promising source of new antileishmanial agents.Citation3–Citation6
Sesquiterpene, artemisinin, for the discovery of which the Noble Prize for Physiology or Medicine was awarded to Youyou Tu in 2015, is a secondary metabolite isolated from Artemisia annua. Artemisinin is a highly lipophilic molecule with reported antileishmanial activity, but on account of its unfavorable physicochemical properties, its therapeutic efficacy is compromised.Citation7,Citation8 These limitations can be overcome by the incorporation of artemisinin in colloidal nanoparticles.Citation9,Citation10
Over the past decades, liposomes have demonstrated an increase in the therapeutic efficacy of several drugs.Citation11–Citation18 Depending upon their physical properties, liposomes are recognized as foreign particles after in vivo administration and are easily cleared by the reticuloendothelial system that harbors Leishmania parasites.Citation19–Citation21 Thus, the association or incorporation of chemotherapeutic agents in liposomes has immense therapeutic benefits against the intracellular infection of Leishmania. Liposomal drug delivery holds great promise for the treatment of infectious disease and is already used in clinical practice.Citation22 In the present study, we show that the antileishmanial potential of artemisinin is improved when incorporated into liposomes compared to free artemisinin, both ex vivo in murine macrophages and in vivo in a BALB/c model of VL. To the best of our knowledge, this study is the first report on the efficacy of nanoliposomal artemisinin (NLA) in VL.
Materials and methods
Materials
Artemisinin (purity 98%) was purchased from Baoji Herbest Bio-Tech Ltd. (Baoji, People’s Republic of China). l-α-phosphatidylcholine (≥99%), cholesterol (≥99%), amphotericin B (AmB; ~80% purity), pentamidine isethionate (purity 98%), Medium 199, penicillin, streptomycin, 4-(2-hydroxyethyl)-1-piperazine ethanesulfonic acid, RPMI-1640 medium, carboxy fluorescein succinidimyl ester (CFSE) used for the parasite and cell culture, antibodies, and o-phenylenediamine dihydrochloride for enzyme-linked immunosorbent assay were obtained from Sigma-Aldrich Co. (St Louis, MO, USA). Cytokine bead array flex was procured from BD Biosciences (San Jose, CA, USA). Kits for the estimation of serum alanine transaminase (ALT), alkaline phosphatase (ALP), aspartate aminotransaminase (AST), creatinine, and urea were obtained from Span Diagnostics Ltd. (Surat, India). Chloroform (≥99.0%), dimethylsulfoxide (DMSO; ≥99.9%), acetone (≥99.8%), and sucrose were purchased from Merck Millipore (Billerica, MA, USA). All the other reagents were of analytical grade.
Parasite culture
L. donovani parasites of strain AG83 (MHOM/IN/1983/AG83), were originally isolated from a patient, in 1983 and since then maintained by serial passages in Syrian golden hamsters in IICB, Kolkata, India. The parasites were kindly provided to us by Dr Nahid Ali, IICB, and maintained in Syrian golden hamsters in Jamia Hamdard Animal House facility. The parasites were isolated from the infected spleen, cultured in vitro up to the third to fourth passage in Medium 199 (pH 7.4) supplemented with 20% heat-inactivated fetal bovine serum, 25 mM 4-(2-hydroxyethyl)-1-piperazine ethanesulfonic acid, 2 mM l-glutamine, 100 U/mL penicillin G, and 100 µg/mL streptomycin and subsequently used for the infection of murine models.Citation23
Animals
Female BALB/c mice (6–8 weeks old, weighing 25–30 g) and Syrian golden hamsters (obtained from Central Animal House Facility, Jamia Hamdard) were used for all experiments. Jamia Hamdard Animal Ethics Committee (JHAEC) approved the study with ethics approval no 458. The animals were fed with water and feed ad libitum, and all experiments were carried out as per the guidelines directed by the Committee for the Purpose of Control and Supervision of Experiments on Animals, Ministry of Empowerment and Social Justice, Government of India.
Methods
Experimental design
Preparation of NLA was optimized by a three-level, three-factor Box–Behnken design using Design Expert® 8.0.1. The independent factors of the design consisted of phosphatidylcholine/drug ratio (%, w/w), cholesterol (%, w/v), and sonication time (minutes), and the dependent factors were the mean particle size, polydispersity index (PDI), zeta potential, and drug loading ( and ). The design generated 17 combinations including the five replicates at the central level (Table S1) with the nonlinear quadratic model equation as follows:
where Y represents the dependent variable, b0 is the intercept, A B and C represent the coded levels of independent variables, and b1–b33 are regression coefficients computed from the observed experimental values of Y. The terms AB, AC, and BC and A2, B2, and C2 represent the interaction and quadratic terms, respectively.Citation24,Citation25
Table 1 Independent variables and their coded levels in the Box–Behnken design
Table 2 Dependent variables and their constraints in the Box–Behnken design
Optimization and model validation
Optimization of NLA was performed using analysis of variance (ANOVA) in Design Expert® 8.0.1 by simultaneous fitting of the observed responses to linear, 2FI, quadratic, and cubic models based on the statistical significance of coefficients and R2 values. The optimum values of the independent factors were selected based on the desirability criteria of minimum particle size, minimum particle distribution, maximum stability, and maximum drug loading.
Preparation of nanoliposomes
NLA was prepared by a thin-film hydration method as described previously with slight modifications.Citation26 Briefly, the amounts of phosphatidylcholine/artemisinin and cholesterol for nanoliposomes were optimized using the Box–Behnken design of response surface methodology with the intention of obtaining optimum nanoliposomes. These constituents were dissolved in chloroform, and a thin film of the liposome was created using Rota vapor (Buchi® Rotavapor® R3; BUCHI Labortechnik, Flawil, Switzerland) with a water bath set at 38°C. The thin film was then hydrated with 0.9% sodium chloride, sonicated at 70% strength, 20 kHz, and 130 W with a pulse of 1 minute sonication and 1 minute rest, kept on an ice bath using the Vibra cell ultrasonicator (Sonics and Material Inc., Newtown, CT, USA), and downsized by extrusion by passing through a polycarbonate membrane (0.2 µm). The samples were then washed and lyophilized at −80°C using sucrose at a ratio of 5:1 as a lyoprotectant.
Characterization of nanoliposomes
Mean particle size and zeta potential
Mean particle diameter, size distribution, and zeta potential of NLA were determined by dynamic light scattering (DLS) using a Zetasizer (Nano ZS, Malvern Instruments, Ltd., Malvern, UK). The samples were reconstituted in nanopure water and analyzed at a detection angle of 90° at a temperature of 25°C, and the measurements were repeated three times.
Particle morphology
Morphology of optimized NLA was characterized by an Innova® atomic force microscope (Bruker Corporation, Billerica, MA, USA) and a transmission electron microscope (Technai TF20; FEI, Hillsboro, OR, USA). Briefly, a diluted sample of NLA was placed on a glass coverslip cleaned with Pirhana solution and dried under vacuum. The Atomic force microscopy (AFM) analysis was carried out in the contact mode using a cantilever nanoprobe made of silicon nitride with a spring constant of 49 N m−1 and analyzed by the Veeco SPM Lab analysis software. For Transmission electron microscopy (TEM) analysis, diluted samples of NLA (10 µL) were placed on a 300-mesh carbon-coated grid, the excess amount of sample was removed using a blotting paper, and stained negative using 1% (w/v) uranyl acetate (10 µL) for 2 minutes. The excess water was removed and the sample dried, and analyzed at an acceleration voltage of 120 kV using the FEI Technai TF20.
Drug-loading efficiency
The amount of drug loaded in the nanoliposomes was determined after disruption of liposomes in DMSO. In brief, artemisinin in DMSO was quantified after derivatization by mixing with sodium hydroxide at a ratio of 1:1 and incubated for 30 minutes at room temperature followed by the measurement of absorbance at 291 nm by ultra violet–visible spectroscopy.Citation27 The drug loading was calculated by the following formula:
In vitro release study
Release of artemisinin from nanoliposomes was studied in phosphate-buffered saline (0.2 M, pH 7.4) and sodium acetate buffer (0.2 M, pH 5.5) as release medium to mimic physiological and endosomal pH of macrophages, respectively.Citation28 In brief, 2 mg of nanoparticles were dialyzed against release buffer at 37°C±1°C in a dialysis bag with a molecular weight cut-off of 12,000 Da. The samples were drawn at predetermined intervals and replenished with equal volume of buffer to maintain the source sink conditions. The concentration of artemisinin in the release medium was determined by ultra violet–visible spectroscopy after derivatization with DMSO and sodium hydroxide as described earlier, and release data were fitted to different kinetic models for studying the mechanism of release.
Storage stability
Storage stability of NLA was determined at predetermined intervals after rehydrating it in nanopure water at 25°C for ~1 month by monitoring the mean particle diameter, PDI, zeta potential, and drug loading.
Cytotoxicity to mammalian cells
Cytotoxicity of NLA was tested on murine macrophages by MTT assay.Citation29 Briefly, murine macrophages isolated from the peritoneal cavity of BALB/c mice were seeded in a flat-bottomed 96-well plate at a density of 2×10⁵ cells/well. The cells were incubated with free artemisinin, empty nanoliposomes (ENLs), NLA, and pentamidine at a wide range of concentrations (0.82–200 µg/mL). After 48 hours, 50 µL of MTT (stock solution 5 mg/mL) was added to each well, and the plate was read at 570 nm using a microplate reader (Spectra max 450; Molecular Devices LLC, Sunnyvale, CA, USA) with 690 nm as background, and percent viability was calculated by the following formula:
Ex vivo antileishmanial activity and nitric oxide production
For studying the ex vivo antiamastigote activity, peritoneal macrophages isolated from 6–8-week-old female BALB/c mice were infected with L. donovani promastigotes at a ratio of 1:10 and then treated with test samples comprising NLA, ENLs, artemisinin, and pentamidine for 48 hours (0–50 µg/mL). The cells were Giemsa stained, and the percent amastigote infection and percent infected macrophages were calculated as described previously.Citation9
For nitric oxide production, nitrite, a surrogate marker, and quantitative indicator of nitric oxide was measured in the culture supernatant of normal, infected control, and treated samples by Griess assay, and the concentrations were calculated using a standard curve generated with NaNO2 (0–100 µM).Citation30 Briefly, 100 µL of culture supernatant at 48 hours with or without treatment was incubated with an equal volume of Griess reagent (1% sulfanilamide and 0.1% napthylethylene diamine dihydrochloride in 5% H3PO4), and the absorbance was read at 540 nm. The absorbance values obtained were subtracted from that obtained in the background control (media alone).
In vivo toxicity
Hepatic and renal toxicities of nanoliposomal formulations were studied in healthy BALB/c mice at the higher therapeutic dose after 24 hours of administration of test samples, by estimating the levels of serum hepatic markers, such as AST, ALT, ALP, and the renal toxicity markers, such as creatinine and urea, by employing commercially available kits (Span Diagnostics, Surat, India).
In vivo infection and treatment
Inbred female BALB/c mice were infected through intravenous route with 2.5×10⁷ late log or stationary phase L. donovani promastigotes. Sixty days postinfection, the animals were randomly assorted into different groups and then treated intraperitoneally with 10 mg/kg or 20 mg/kg body weight (bw) of artemisinin daily, 10 mg/kg or 20 mg/kg bw NLA on alternate days, and ENLs on alternate days (equivalent to the highest concentration in NLA) for 10 days. The normal and infected animals receiving PBS served as uninfected untreated control and infected untreated control, respectively, whereas animals receiving 5 mg/kg bw of AmB intravenously on alternate days over a period of 10 days served as positive control. Animals were killed by mild anesthesia 1 week posttreatment. Liver and spleen were weighed, impression smears made, and Leishman Donovan unit (LDU) and percentage inhibition (PI) calculated by the following formula:
Preparation of freeze thawed and soluble leishmanial antigen
Leishmanial antigens were prepared by freezing and thawing of stationary phase L. donovani promastigotes as described earlier.Citation31
Delayed-type hypersensitivity
Delayed-type hypersensitivity (DTH) was measured in the normal healthy mice, infected control, and animals treated with higher dose of test samples after 24 hours by challenging with 50 µL (800 µg/mL) of freeze thawed antigen intradermally in the right hind foot pad, whereas the same volume of PBS was injected in the control left hind foot pad. Swelling or thickness of the foot pad was measured by vernier calipers, and the differences between the right and the control left foot pad injected with PBS were determined.Citation23
Lymphoproliferation and estimation of Th1/Th2 cytokines
Lymphoproliferation was measured by CFSE (carboxyfluorescein succinimidyl ester) dilution after in vitro recall employing a flow cytometer.Citation32 Briefly, splenocytes from the uninfected, untreated, and treated animals were counted and incubated with CFSE (1 µM) for 15 minutes in the dark. The cells were seeded at a density of 5×10⁶ cells/well in a flat-bottom tissue culture plate and stimulated with soluble leishmanial antigen (SLA) (10 µg/mL) at 37°C and 5% CO2. After 72 hours, the cells were acquired in a BD LSR II flow cytometer (BD Biosciences) to assess the lymphoproliferation.
In parallel, supernatants from unlabeled splenocytes were collected after 72 hours of in vitro recall, and Th1 (interferon-γ) and Th2 (interleukin [IL]-4 and IL-10) cytokines were measured using a customized bead multiplex array kit. The concentration of cytokines was calculated from the calibration curve generated with the recombinant cytokine standards using the BD FCAP array software.Citation33
Determination of parasite-specific antibodies
Mice from untreated noninfected, infected control, and treated groups were bled 1 week post-treatment, and the sera separated were used to measure the Leishmania-specific antibodies, immunoglobulin G (IgG) 2a and IgG1, convenient surrogate markers of CD4+ T-cell differentiation into Th1 and Th2, respectively by enzyme-linked immunosorbent assay.Citation34
Statistical analysis
Data are shown as mean ± SD and are representative of one of the two independent experiments. For in vivo experiments, three to five animals were used per group, and the differences between the groups were evaluated by one-way ANOVA followed by Tukey–Kramer multiple comparison test using GraphPad prism 5.0. A P-value of <0.05 was considered statistically significant.
Results and discussion
Effect of independent variables on particle size, PDI, zeta potential, and drug loading
Box–Behnken design in the response surface methodology was applied for the development of optimal nanoliposomal preparation of artemisinin. The 17 combinations generated had a particle size of 72–138 nm, PDI of 0.20–0.39, zeta potential of −22 mV to −37 mV, and drug loading of 29%–39% (Table S2). The polynomial equations were generated based on the analysis of multiple correlation coefficients, adjusted multiple correlation coefficients, and the predicted residual sum of squares. These equations were validated statistically using ANOVA, and a P-value of <0.05 was considered significant. The best fitting mathematical model involving the individual main effects and interaction factors was selected on the basis of the comparison of the predicted residual sum of squares provided by the Design Expert software (Table S3). The response surface analysis for the reduced models demonstrated significant (P< 0.05) second-order polynomial regression equations that successfully fitted for all dependent variables with no significant (P>0.05) lack of fit. The polynomial equations generated from the model for Y1, Y2, Y3, and Y4 are given in the following equations, and the response surface plots generated are given in Figure S1 (A–F)
Optimization and model validation
Optimization of different independent variables was carried out, and the coded units given by the design were 10.95 (A), 0.30 (B), and 2.54 (C). Further model validation was performed by estimating the variation or percentage error between the predicted and calculated values for each response ().
Table 3 Optimum concentration of independent variables for desired formulation with predicted responses and error
Characterization of nanoliposomes
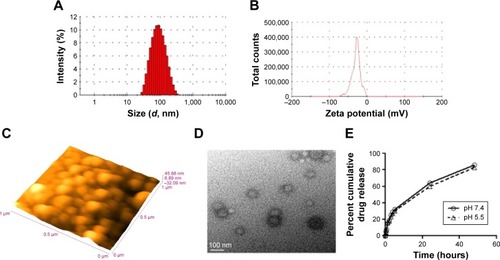
The optimum values for NLA for obtaining the minimum vesicle size, minimum PDI, and maximum zeta potential and drug loading after fitting the response values were 10.94% artemisinin/phosphatidylcholine, 0.3% cholesterol, and 2.5 minutes sonication time. The mean particle size and PDI of optimized NLA were 83±16 nm and 0.2±0.03, respectively, indicating a narrow size distribution (). The particle charge or zeta potential of optimized NLA was −27.4±5.7 mV, suggesting good stability of nanoliposomal formulation, thus preventing aggregation (). The zeta potential of >±20 in nanoliposomes indicates high stability.Citation35 A large negative or positive charge on the particles causes more repulsion, preventing aggregation and making the nanoparticles sterically more stable. These nanoliposomes were smooth in morphology with a particle diameter of 79±5 nm, as confirmed by AFM and TEM images (). The particle size shown by DLS technique is the hydrodynamic diameter of the nanoparticles, whereas the electron microscopy reveals the exact size and morphology of NLA. DLS depicts the precise size distribution of nanoliposomes. The drug loading of optimized nanoliposomes was 33.2%±2.1%, which is considered satisfactory, keeping in view the other constituents used in the preparation of nanoliposomes.
Figure 1 Characterization of NLA.
Notes: (A) Size distribution and (B) zeta potential by dynamic light scattering technique, (C) morphology by atomic force microscopy at a scale bar of 1 µm and (D) transmission electron microscopy at a scale bar of 100 nm, and (E) cumulative drug release for 48 hours at pH 5.5 and pH 7.4. All experiments were done in triplicate.
Abbreviation: NLA, nanoliposomal artemisinin.
Storage stability
There was no discernible change in the mean particle size, PDI, and zeta potential of optimized NLA at 25°C during the study period, confirming the stability of the NLA (Table S4). Hence, it clearly suggests that even at room temperature, the crucial characteristics of the optimal nanoformulation are preserved.
In vitro release
shows a two-phase pattern with an initial rapid release followed by a slow release throughout the 48-hour period at pH 5.5 and pH 7.4. The mechanism of drug release from these nanoliposomes followed the Higuchi model, as indicated by the high correlation coefficient indicating a prominent role of diffusion (Table S5). Acidic or neutral pH of the medium did not accelerate or decelerate the drug release from the nanoliposomes. In the previous studies with lipophilic drugs, concomitant contribution of diffusion from the liposomes was reported in the release process.Citation36 The initial fast release could be due to the higher concentration of drug in the nanoliposomes, while as the concentration of the drug diminished, the release rate became steady.
Ex vivo and in vivo toxicity
The results showed that ENLs and NLA were noncytotoxic to the murine macrophages in the range of concentrations tested. On the other hand, free artemisinin exerted mild toxicity at the highest concentration tested, decreasing the viability of macrophages by ~61% compared to control. The standard antileishmanial drug, pentamidine, also showed signs of cell toxicity in vitro (). Hence, incorporation of artemisinin in liposomes represents an advantage over free artemisinin, as corroborated by the elimination of toxicity on murine macrophages. Our results are in-line with previous studies demonstrating the reduction in toxicity of drugs incorporated in nanoliposomes.Citation37,Citation38
Figure 2 Toxicity of NLA.
Notes: (A) Ex vivo on murine macrophages by MTT assay after 72 hours incubation at a concentration range of 0.82–200 µg/mL. Serum levels of (B) AST and ALT, (C) ALP, (D) creatinine, and (E) urea in healthy animals after 24 hours of administration of artemisinin, NLA, ENL, and AmB at the highest dose. Data are represented as mean ± SD and are from one of the two independent experiments. ***P<0.0001.
Abbreviations: ALP, alkaline phosphatase; ALT, alanine transaminase; AmB, amphotericin B; AST, aspartate aminotransaminase; ENL, empty nanoliposome; NLA, nanoliposomal artemisinin.
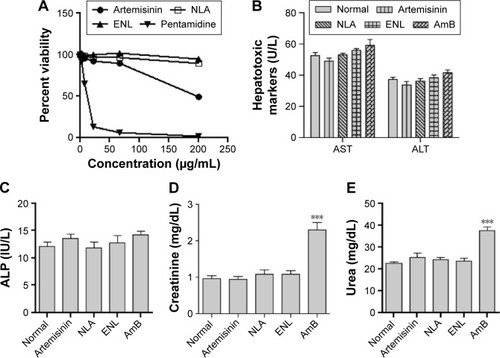
Likewise, NLA did not show hepato- or nephrotoxicity in vivo, as indicated by the normal levels of the serum markers, namely AST, ALT, ALP, creatinine, and urea (), whereas the standard antileishmanial drug, AmB, after 24 hours of administration depicted nephrotoxicity, as suggested by the higher serum levels of urea and creatinine (). These findings are in-line with previous reports that have shown nephroprotoxicity associated with AmB.Citation39,Citation40
Ex vivo antileishmanial activity and NO production
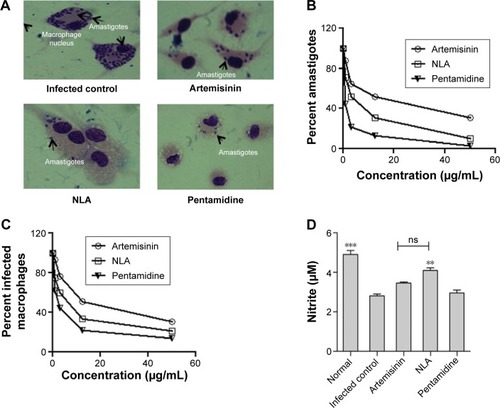
NLA showed improved efficacy against L. donovani amastigotes by decreasing their number and the number of infected macrophages (). The inhibitory concentration of NLA was 6.0±1.4 µg/mL and 5.1±0.9 µg/mL for intracellular amastigotes and infected macrophages, respectively, showing that NLA retains its activity within the liposomes (). Moreover, NLA was more potent compared to free artemisinin with more than two fold increase in activity against both L. donovani amastigotes and infected macrophages (Table S6), indicating the improved efficacy of the drug in nanoliposomes. The better leishmanicidal effect of NLA could be ascribed to the small size of nanoliposomes with an increased accessibility to infected macrophages, leading to lower IC50.Citation41 NLA also normalized the levels of NO in infected macrophages, which were significant compared to untreated macrophages (). NO is a powerful effector molecule against Leishmania parasites that survive by inhibiting the production of NO in macrophages.Citation42 As NLA resulted in the clearance of the parasites, NO levels were restored, whereas pentamidine was toxic to both macrophages and parasites and hence did not elevate the levels of NO in infected macrophages.
Figure 3 In vitro antileishmanial activity.
Notes: (A) Giemsa-stained murine macrophages infected with Leishmania donovani parasites at 48 hours in untreated and treated conditions. (B) Percent L. donovani amastigote infection and (C) percent macrophages infected with L. donovani amastigotes at 48 hours after incubation with different concentrations of artemisinin, NLA, and pentamidine (0–50 µg/mL). (D) Nitric oxide levels in the culture supernatant of uninfected, infected, and treated samples at 48 hours by Griess assay. **P<0.001, ***P<0.0001
Abbreviations: NLA, nanoliposomal artemisinin; ns, not significant.
In vivo antileishmanial activity of NLA
Liver and spleen weight
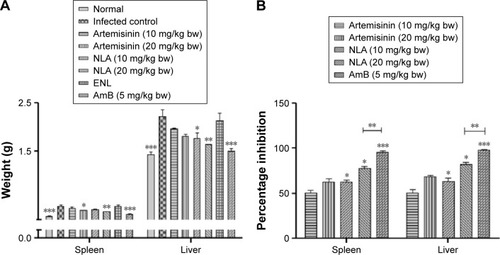
Spleno- and hepatomegaly, the pathological consequences of VL, were seen in untreated animals and were significantly decreased in animals treated with NLA when compared to treatment with free artemisinin at the same dose. ENLs did not show any effect on the liver and spleen weight compared to untreated control. The standard drug, AmB, avidly reduced the hepatosplenomegaly toward normalcy (). Thus, this study signifies an improvement in the curative effect of artemisinin in nanoliposomal form compared to free artemisinin, as evidenced by the reduction in organ weights. The reason behind reduced weights of spleen and liver, and hence the encouraging results, may be due to the small size and greater stability of artemisinin inside liposomes, which enhances bioavailability and hence passive targeting to macrophages, as reported with the liposomal formulations of other antimicrobial drugs.Citation43–Citation45
Figure 4 Antileishmanial activity of nanoliposomes in experimental VL.
Notes: (A) Spleen and liver weight in normal, infected, and treated animals 1 week post-treatment. (B) Percentage inhibition of parasites in the spleen and liver 1 week post-treatment. Data are represented as mean ± SD from one of the two independent experiments having five animals per group. *P<0.05, **P<0.001, ***P<0.0001.
Abbreviations: AmB, amphotericin B; ENL, empty nanoliposome; NLA, nanoliposomal artemisinin; VL, visceral leishmaniasis.
Parasite burden
PI of parasites in an established murine model of VL treated with NLA was significantly higher compared to free artemisinin (82.4%±3.8% vs 68.3%±4.07.0% in liver and 77.6%±5.5% vs 62.7%±6.3% in spleen at 20 mg/kg bw). A decrease in the parasite burden in animals treated with NLA could be correlated with the decrease in the organ weight due to the clearance of parasites. The standard drug AmB, mostly cleared the parasites from the liver and spleen (97.6%±1.5% and 96.0%±2.2%, respectively) as also reflected by normal weights of liver and spleen, whereas no such change was observed in animals treated with ENLs coinciding with the enhanced liver and spleen weights ().
Delayed-type hypersensitivity
DTH, an index of cell-mediated immunity, was observed in animals treated with NLA, restoring the cellular immunity that was quenched in murine VL. The highest response was found in animals treated with AmB, whereas no such response was observed in animals treated with free artemisinin or ENLs (). Minimal amount of DTH in mice treated with artemisinin correlates with the minimal reduction in infected organ weight as well as partial clearance of parasites from these organs. This study corroborates well with those that have reported failure of induction of cellular immunity in Leishmania-infected animals contributing to the disease exacerbation.Citation46,Citation47
Figure 5 Evaluation of cellular immunity.
Notes: (A) Delayed type hypersensitivity response to freeze thawed leishmanial antigen (800 µg/mL) after 24 hours in age-matched, infected control and animals treated with artemisinin, NLA, ENL, and AmB at the highest dose. (B) Proliferative response by CFSE after 72 hours of in vitro stimulation of total lymphocytes with SLA (10 µg/mL) at the highest dose of artemisinin, NLA, ENL, and AmB. (C) Induction of IL-4, (D) IFN-γ, and (E) IL-10 in the culture supernatant of splenocytes at 72 hours by cytokine bead array at the highest dose of artemisinin, NLA, ENL, and AmB. (F) Parasite-specific antibodies IgG1 and IgG2a 1 week posttreatment with artemisinin, NLA, ENL, and AmB at the highest dose measured by ELISA. Data are represented as mean ± SE from one of the two independent groups having five animals per group. *P<0.05, **P<0.001, ***P<0.0001.
Abbreviations: AmB, amphotericin B; CFSE, carboxy fluorescein succinidimyl ester; ELISA, enzyme-linked immunosorbent assay; ENL, empty nanoliposome; FT, freeze thawed; IFN-γ, interferon-γ; IgG, immunoglobulin G; IL, interleukin; NLA, nanoliposomal artemisinin; SLA, soluble leishmanial antigen.
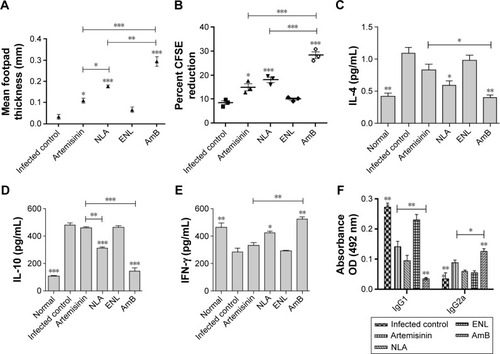
Lymphoproliferation and cytokine analysis
Splenocytes of animals treated with NLA proliferated upon in vitro recall with SLA, whereas no such proliferation was seen in infected control or animals treated with free artemisinin and empty nanoparticles. AmB-treated animals showed the highest rate of proliferation of splenocytes ( and S2). VL infection induces the T-cell anergy, and thus, effective cell-mediated response is necessary for disease suppression.Citation19 This impairment in T-cell response is successfully reversed by treatment with NLA and AmB, which reveals the clearance of the intracellular parasites.Citation48 Progression of disease is very much dependent on the induction of Th2-related cytokines, whereas disease resolution is attributable to Th1 cytokines.Citation49 After 72 hours of in vitro recall, Th2 cytokines, namely IL-4 and IL-10, in the culture supernatant were enhanced and Th1 cytokines decreased in the infected control, whereas in the supernatant of splenocytes from animals treated with NLA, the reverse trend was seen, indicating the restoration of cell-mediated arm of immunity in experimental VL. Thus, these findings are in-line with those of earlier studies, where successful therapy led to a transition from a disease-promoting Th2 cytokine profile to a disease-resolving Th1 pattern ().Citation50 Hence, it is clearly evidenced that NLA also modulates the immune response in a direction, that is pivotal for the clearance of intracellular Leishmania.
Leishmania-specific antibody response by enzyme-linked immunosorbent assay
An increase or decrease in the Th1 and Th2 cytokine levels is also supported by the increased levels of IgG2a and IgG1, which are the surrogate markers of cell-mediated and humoral immunity, respectively.Citation50 Treatment of mice with NLA or AmB resulted in an increase in IgG2a levels compared to other groups, suggesting Th1 biased immunity (). Enhanced levels of IgG2a indicate a progressive shift of immunity toward Th1, whereas higher levels of IgG1 reflect a Th2-biased response. These results coincide with the cytokine levels, as IgG2a secretion is dependent on interferon-γ and IgG1 secretion is dependent on IL-4. Our findings are well supported by previous studies that have shown enhanced levels of IgG2a in the serum of VL infection after successful therapy.Citation19
Conclusion
In this study, NLA was successfully prepared and physicochemically characterized, having a particle diameter of 79±5 nm (as shown by electron microscopy), a size distribution of 0.2±0.03, a zeta potential of −27.4±5.7 mV, and a high drug-loading efficiency of 33.2%±2.1%. The developed NLA showed improved efficacy ex vivo by decreasing the number of L. donovani amastigotes and in vivo by diminishing the spleno- and hepatomegaly along with lowering of parasite burden in an animal model of murine VL. NLA reinforced the secretion of Th1 cytokines, which is also marked by positive lymphoproliferation, increase in the levels of IgG2a, and positive DTH. Thus, considering the improved efficacy of artemisinin in nanocarriers, NLA could prove to be useful in the design of targeted therapies aimed at eliminating VL infection. Furthermore, other parameters, such as drug release for the optimization and functionalization of NLA with ligands targeted to macrophages, should be considered to improve the efficacy of these nanoliposomes.
Acknowledgments
This study was supported by the Deanship of Scientific Research (7127), Taibah University, Kingdom of Saudi Arabia. MYW was a senior research fellow at the Jamia Hamdard (Hamdard University) during the tenure of this study and is now a postdoctoral fellow at Roswell Park Cancer Institute, Buffalo, New York, USA. The authors are grateful to Professor TP Das for providing the DLS and AFM facilities.
Disclosure
The authors report no conflicts of interest in this work.
Supplementary materials
Figure S1 Box–Behnken or response surface plots showing the effect of independent factors on dependent factors.
Notes: (A) Effect of drug/PC and cholesterol. (B) Drug/PC and sonication time and (C) cholesterol and sonication time on particle size. Particle size is an important parameter or variable for the development of a drug delivery system. EquationEquation 7(7) suggests dependence of particle size on independent factors. Negative sign indicates a decrease in the particle size, whereas positive sign in the equation represents an increase in the particle size. An increase in the drug/PC has an unfavorable effect on the particle size and similarly amount of cholesterol directly influences and increases the particle size of the nanoliposomes, while the interaction terms do not have any significant effect. (D) Effect of drug/PC and cholesterol, (E) drug/PC and sonication time, and (F) cholesterol and sonication time on PDI. From the polynomial equation (EquationEquation 8
(8) ), positive sign indicates synergistic effect, whereas negative sign represents antagonistic effect. Higher value of PDI suggests nonuniform size distribution of nanoliposomes that may lead to aggregation and hence compromises the stability of nanoparticles. (G) Effect of drug/PC and cholesterol, (H) drug/PC and sonication time, and (I) cholesterol and sonication time on zeta potential. From EquationEquation 9
(9) , it is clear as the levels of cholesterol, sonication time, and interaction terms AC, ie, drug/PC and sonication time, have an inverse relationship with zeta potential. (J) Effect of drug/PC and cholesterol, (K) drug/PC and sonication time, and (L) cholesterol and sonication time on drug loading. The relationship or effect of independent variable on drug loading is shown in the equation and Box–Behnken plots generated, indicating the effect of independent variables on particle size, PDI, zeta potential, and drug loading that are given in (J–L). It is clear from the above equation and response surface plots that drug/PC, amount of cholesterol, and sonication time in the formulation had a significant positive effect on the drug loading, ie, an increase in the levels of these constituents at a time directly influences the amount of drug loading.
Abbreviations: PC, phosphatidylcholine; PDI, polydispersity index.
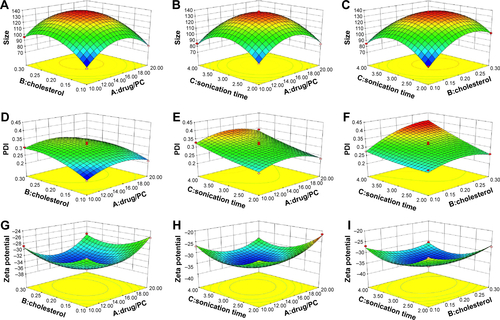
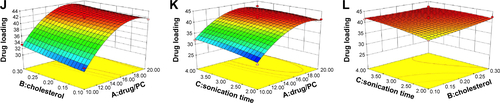
Figure S2 Contour plots representing percent proliferation of splenocytes after 72 hours of in vitro recall with SLA.
Abbreviations: AmB, amphotericin B; CFSE, carboxy fluorescein succinidimyl ester; ENL, empty nanoliposome; NLA, nanoliposomal artemisinin; SLA, soluble leishmanial antigen; SSC, side scatter.
Table S1 Experimental design generated by Design Expert® 8.0.7.1 consisting of 17 combinations including five replicates at the central level
Table S2 Responses in dependent variables (particle size, PDI, zeta potential, and drug loading after experimental run)
Table S3 Summary of results of model analysis, lack of fit, R2 analysis for measured response
Table S4 Storage stability at different time points at 37°C for 25 days
Table S5 Mechanism of drug release under in vitro conditions at endosomal and physiological pH at 37°C
Table S6 IC50 values of NLA and artemisinin in an ex vivo model of leishmaniaisis
References
- AlvarJVelezIDBernCWHO Leishmaniasis Control TeamLeishmaniasis worldwide and global estimates of its incidencePLoS One201275e3567122693548
- HerwaldtBLLeishmaniasisLancet199935491851191119910513726
- CraggGMNewmanDJNatural products: a continuing source of novel drug leadsBiochim Biophys Acta2013183063670369523428572
- SinghNMishraBBBajpaiSSinghRKTiwariVKNatural product based leads to fight against leishmaniasisBioorg Med Chem2014221184524355247
- da Costa-SilvaTAGreccoSSde SousaFSImmunomodulatory and antileishmanial activity of phenylpropanoid dimers isolated from Nectandra leucanthaJ Nat Prod201578465365725835647
- AnnangFPerez-MorenoGGarcia-HernandezRHigh-throughput screening platform for natural product-based drug discovery against 3 neglected tropical diseases: human African trypanosomiasis, leishmaniasis, and Chagas diseaseJ Biomol Screen2015201829125332350
- SenRGangulySSahaPChatterjeeMEfficacy of artemisinin in experimental visceral leishmaniasisInt J Antimicrob Agents2010361434920403680
- ChenYLinXParkHGreeverRStudy of artemisinin nanocapsules as anticancer drug delivery systemsNanomedicine20095331632219523432
- WantMYIslamuddinMChouhanGDasguptaAKChattopadhyayAPAfrinFA new approach for the delivery of artemisinin: formulation, characterization, and ex-vivo antileishmanial studiesJ Colloid Interface Sci201443225826925086720
- LetchmananKShenSCNgWKTanRBEnhanced dissolution and stability of artemisinin by nano-confinement in ordered mesoporous SBA-15 particlesJ Microencapsul201532439040026004369
- FaezizadehZGharibAGodarzeeMIn-vitro and in-vivo evaluation of silymarin nanoliposomes against isolated methicillin-resistant Staphylococcus aureusIran J Pharm Res201514262763325901172
- GasparMMCaladoSPereiraJTargeted delivery of paromomycin in murine infectious diseases through association to nano lipid systemsNanomedicine20151171851186026169150
- CarvalheiroMEstevesMASantos-MateusDHemisynthetic trifluralin analogues incorporated in liposomes for the treatment of leishmanial infectionsEur J Pharm Biopharm20159334635225936854
- AlvingCRSteckEAChapmanWLJrTherapy of leishmaniasis: superior efficacies of liposome-encapsulated drugsProc Natl Acad Sci U S A197875629592963208079
- AlvingCRSteckEAHansonWLLoizeauxPSChapmanWLJrWaitsVBImproved therapy of experimental leishmaniasis by use of a liposome-encapsulated antimonial drugLife Sci1978221210211026642712
- BlackCDWatsonGJWardRJThe use of Pentostam liposomes in the chemotherapy of experimental leishmaniasisTrans R Soc Trop Med Hyg1977716550552204085
- NewRRChanceMLThomasSCPetersWAntileishmanial activity of antimonials entrapped in liposomesNature197827256485556203863
- HunterCADolanTFCoombsGHBaillieAJVesicular systems (niosomes and liposomes) for delivery of sodium stibogluconate in experimental murine visceral leishmaniasisJ Pharm Pharmacol19884031611652899143
- RoychoudhuryJSinhaRAliNTherapy with sodium stibogluconate in stearylamine-bearing liposomes confers cure against SSG-resistant Leishmania donovani in BALB/c micePLoS One201163e1737621423750
- GharibAFaezizadehZMesbah-NaminSAIn vitro and in vivo antibacterial activities of cyanidinum chloride-loaded liposomes against a resistant strain of Pseudomonas aeruginosaPlanta Med2013791151923203413
- BalasegaramMRitmeijerKLimaMALiposomal amphotericin B as a treatment for human leishmaniasisExpert Opin Emerg Drugs201217449351023167833
- AllenTMCullisPRLiposomal drug delivery systems: from concept to clinical applicationsAdv Drug Deliv Rev2013651364823036225
- AfrinFAliNAdjuvanticity and protective immunity elicited by Leishmania donovani antigens encapsulated in positively charged liposomesInfect Immun1997656237123779169776
- MunasurAPPillayVChettyDJGovenderTStatistical optimisation of the mucoadhesivity and characterisation of multipolymeric propranolol matrices for buccal therapyInternational journal of pharmaceutics20063231–2435116863686
- YangCRZhaoXLHuHYPreparation, optimization and characteristic of huperzine a loaded nanostructured lipid carriers. Chem Pharm BullMay2010585656661
- IsacchiBArrigucciSla MarcaGConventional and long-circulating liposomes of artemisinin: preparation, characterization, and pharmacokinetic profile in miceJ Liposome Res201121323724421158702
- BharatiASabatSCA spectrophotometric assay for quantification of artemisininTalanta20108231033103720678664
- NaharMJainNKPreparation, characterization and evaluation of targeting potential of amphotericin B-loaded engineered PLGA nanoparticlesPharm Res200926122588259819842021
- ManandharKDYadavTPPrajapatiVKAntileishmanial activity of nano-amphotericin B deoxycholateJ Antimicrob Chemother200862237638018453526
- DingAHNathanCFStuehrDJRelease of reactive nitrogen intermediates and reactive oxygen intermediates from mouse peritoneal macrophages. Comparison of activating cytokines and evidence for independent productionJ Immunol19881417240724123139757
- WantMYIslamuddinMChouhanGTherapeutic efficacy of artemisinin-loaded nanoparticles in experimental visceral leishmaniasisColloids Surf B Biointerfaces201513021522125936561
- FulcherDWongSCarboxyfluorescein succinimidyl ester-based proliferative assays for assessment of T cell function in the diagnostic laboratoryImmunol Cell Biol199977655956410571678
- McHughTMFlow microsphere immunoassay for the quantitative and simultaneous detection of multiple soluble analytesMethods Cell Biol199442pt B5755957877510
- BanduwardeneRMullenABCarterKCImmune responses of Leishmania donovani infected BALB/c mice following treatment with free and vesicular sodium stibogluconate formulationsInt J Immunopharmacol19971941952039373770
- ClogstonJDPatriAKZeta potential measurementMethods Mol Biol2011697637021116954
- RudraADeepaRMGhoshMKGhoshSMukherjeeBDoxorubicin-loaded phosphatidylethanolamine-conjugated nanoliposomes: in vitro characterization and their accumulation in liver, kidneys, and lungs in ratsInt J Nanomedicine2010581182321042545
- LinJYuYShigdarSEnhanced antitumor efficacy and reduced systemic toxicity of sulfatide-containing nanoliposomal doxorubicin in a xenograft model of colorectal cancerPLoS One2012711e4927723145140
- DrummondDCNobleCOGuoZHongKParkJWKirpotinDBDevelopment of a highly active nanoliposomal irinotecan using a novel intraliposomal stabilization strategyCancer Res20066663271327716540680
- RochaPNMacedoMNKobayashiCDRole of urine neutrophil gelatinase-associated lipocalin in the early diagnosis of amphotericin B-induced acute kidney injuryAntimicrob Agents Chemother201559116913692126303800
- GweeACranswickNConnellTGCurtisNMinimizing nephrotoxicity using continuous infusion of deoxycholate amphotericin BPediatr Infect Dis J201433101098
- VonarbourgAPassiraniCSaulnierPSimardPLerouxJCBenoitJPEvaluation of pegylated lipid nanocapsules versus complement system activation and macrophage uptakeJ Biomed Mater Res A200678362062816779767
- ProudfootLNikolaevAVFengGJRegulation of the expression of nitric oxide synthase and leishmanicidal activity by glycoconjugates of Leishmania lipophosphoglycan in murine macrophagesProc Natl Acad Sci U S A1996932010984109898855295
- ChenYLuYChenJEnhanced bioavailability of the poorly water-soluble drug fenofibrate by using liposomes containing a bile saltInt J Pharm20093761–215316019394416
- GuanPLuYQiJEnhanced oral bioavailability of cyclosporine A by liposomes containing a bile saltInt J Nanomedicine2011696597421720508
- BorboremaSESchwendenerRAOssoJAJrde AndradeHFJrdo NascimentoNUptake and antileishmanial activity of meglumine antimoniate-containing liposomes in Leishmania (Leishmania) major-infected macrophagesInt J Antimicrob Agents201138434134721783345
- JoshiJKaurSTo investigate the therapeutic potential of immunochemotherapy with cisplatin +78 kDa + MPL-A against Leishmania donovani in BALB/c miceParasite Immunol201436131223964700
- JoshiJMallaNKaurSA comparative evaluation of efficacy of chemotherapy, immunotherapy and immunochemotherapy in visceral leishmaniasis-an experimental studyParasitol Int201463461262024747611
- CarvalhoEMBacellarOBrownellCRegisTCoffmanRLReedSGRestoration of IFN-gamma production and lymphocyte proliferation in visceral leishmaniasisJ Immunol199415212594959568207220
- TaylorAPMurrayHWIntracellular antimicrobial activity in the absence of interferon-gamma: effect of interleukin-12 in experimental visceral leishmaniasis in interferon-gamma gene-disrupted miceJ Exp Med19971857123112399104810
- MirallesGDStoeckleMYMcDermottDFFinkelmanFDMurrayHWTh1 and Th2 cell-associated cytokines in experimental visceral leishmaniasisInfect Immun1994623105810638112840