
Abstract
The purpose of the study was to reveal the therapeutic effect of quercetin (QUE) nanoparticle complex on diabetic nephropathy (DN) by regulating the expression of intercellular adhesion molecular-1 (ICAM-1) on endothelium as compared to free QUE. QUE 10 mg/kg as a single abdominal subcutaneous injection daily for 8 weeks continuously in diabetic rats and 10 mg/kg QUE nanoparticle complex as a single abdominal subcutaneous injection every 5 days, continuously administered for 8 weeks to diabetic rats. Blood and left kidneys were collected; pathological change of kidney, renal function, oxidative stress level, blood glucose level, serum lipid, urine protein, and albumin/creatinine ratio were measured; and neutrophil adhesion, ICAM-1 expression, and CD11b+ cells infiltration were observed. Both QUE and QUE nanoparticle complex preconditioning ameliorated the pathological damage of kidney and improved renal function, alleviated renal oxidative stress injury, restricted inflammatory cells infiltration, and downregulated the ICAM-1 expression as compared to DN group, while QUE nanoparticle complex significantly alleviated this effect.
Introduction
Approximately one-third of long-standing diabetes leads to nephropathy.Citation1,Citation2 Diabetic nephropathy (DN) is a life-threatening complication in diabetes mellitus and is the biggest single cause of end-stage kidney diseases.Citation3–Citation7 The mechanism involved in DN ranges from oxidative stress, derangement of glucose metabolism, and the activation of abundant inflammatory mediators and cell factors to cellular death.Citation8–Citation10 In particular, constant hyperglycemia is the proegumenal cause of initiation, promotion, and sustentation of DN.Citation11 Quercetin (QUE) belongs to plant flavonoid and possesses potent anti-oxidant properties in vitro, and recent data have shown that QUE may have anti-cancer and anti-inflammatory functions in vivo.Citation12 In the current study, QUE can attenuate DN and is an effective treatment for DN; the result is consistent with previous documents.Citation12,Citation13 However, poor water solubility, low bioavailability, and short half-life of QUE restrict its use in vivo.Citation14 Recent researches affirm that drug delivery via nanoparticles can improve efficacy with decreasing side effects.Citation15 In this regard, poly(ethylene glycol)-block-(poly(ethylenediamine l-glutamate)-graft-poly(ε-benzyloxycarbonyl-l-lysine)) (PEG-b-(PELG-g-PZLL)) is synthesized and QUE/PEG-b-(PELG-g-PZLL) (QUE/P) nanoparticle complex is measured in vitro and vivo.
Several researches suggest that endothelial cells (ECs) are sensitive to DN and they might be a critical mediator of DN.Citation16,Citation17 Under normal condition, ECs offer a protective barrier between lumen and vascular smooth muscle of blood vessel, and the ECs are momentous players in modulating blood flow, neutrophil, complement activation, and renal function.Citation18–Citation21 The EC surface proteins involved in DN are known as cell adhesion molecules (CAMs), which are distributed at various time courses of activations and expressions.Citation22,Citation23 The original interactions between polymorphonuclear (PMN) cells and ECs are mediated via CAM expressed on the EC surface.Citation24 This CAM-mediated interaction leads to the rolling of PMNs along vessel walls and upregulation of intercellular adhesion molecule-1 (ICAM-1) on the PMNs.Citation23,Citation24 As a result, CD11b+ associates with its counter receptors on ECs, mainly ICAM-1, leading to their firm adhesion and transmigration by vascular wall.Citation25,Citation26 Substantial evidence indicates that expression of adhesion molecules via glomerular ECs is increased following DN.Citation17,Citation27,Citation28 Therefore, understanding discovery of ECs will improve the effective therapies, which can be applied in DN procedure.
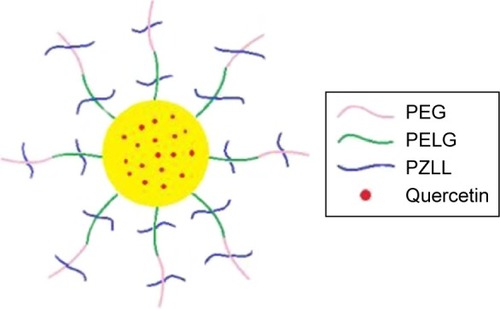
QUE is a representative flavonoid that alleviates DN.Citation29 Many documents have proved that treatment with QUE remarkably ameliorates renal dysfunction and oxidative stress injury in DN.Citation3 In addition, QUE acts as an anti-inflammatory factor (such as ICAM-1) and modulates CD11b+, which may have implications for strategies attenuating endothelial dysfunction.Citation30–Citation32 In this study, QUE regulates endothelial expression of ICAM-1 and attenuates inflammatory cell infiltration (CD11b+), and ameliorates glucose metabolism and lipid metabolism disorder in DN. As is well known, the in vivo solubility of QUE is very low and circulation time is extremely short.Citation14 Here, a PEG-b-(PELG-g-PZLL) carrier (; ) as a potential QUE nanoparticle () is reported. The PEG-b-(PELG-g-PZLL) and QUE form a compound via hydrophobic interaction (). The loaded QUE confirms stable and sustained release, which can develop the study on the protective effect of QUE. QUE encapsulation and in vitro release are affirmed. In vivo study is implemented by the hypodermic injection of QUE/P nanoparticle to DN in diabetic rats, followed by the measurement of blood urine nitrogen (BUN), serum creatinine (Scr), blood glucose, and serum lipid; detections of superoxide dismutase (SOD) activity and methane dicarboxylic aldehyde content in renal tissues; inspection of urine protein and albumin/creatinine ratio; and finally neutrophil adhesion, ICAM-1 expression, and CD11b+ cells infiltration.
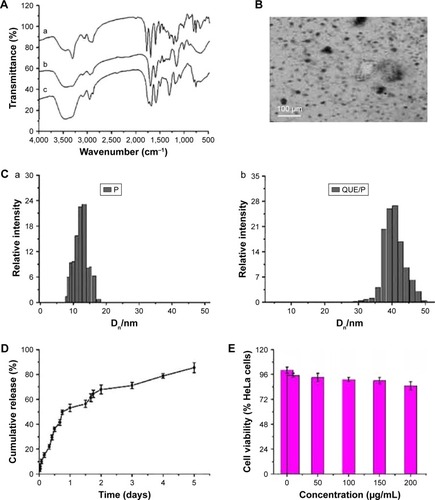
Figure 1 Characterization of PEG-b-(PELG-g-PZLL) and QUE/P.
Notes: (A) a, PEG-b-PBLG; b, PEG-b-PELG; c, PEG-b-(PELG-G-PZLL). FTIS of PEG-b-(PELG-g-PZLL); (B) TEM image of QUE/P; (C) a, particle size of P; b, particle size of QUE/P; (D) cumulative release profile of QUE/P; (E) cellular viability of HeLa cells cultured with different concentrations of PEG-b-(PELG-g-PZLL); (F) blood concentration of free QUE and QUE from QUE/P; (G) solution color of QUE and QUE/P.
Abbreviations: PEG-b-(PELG-g-PZLL), poly(ethylene glycol)-b-(poly(ethylenediamine l-glutamate)-g-poly(ε-benzyloxycarbonyl-l-lysine)); QUE/P, quercetin/PEG-b-(PELG-g-PZLL); FTIS, Fourier transform infrared spectroscopy; TEM, transmission electron microscopy.
Materials and methods
Materials
PEG-NH2 (molecular weight =5 kDa), BLG, and ε-benzyloxycarbonyl-l-lysine were purchased from Aladdin (Shanghai, People’s Republic of China); QUE was purchased from Shanghai excellent Biotechnology Co., Ltd; HeLa cell was purchased from Shanghai Hao Ran Biological Technology Co., Ltd; human umbilical vein endothelial cells (HUVECs) were purchased from Shanghai Bioleaf Biotech Co., Ltd; streptozotocin and other reagents were purchased from Nanjing Built Biological Technology Co., Ltd and Sigma.
Methods
Synthesis of PEG-b-(PELG-g-PZLL)
Synthesis of PEG-b-(PELG-g-PZLL) was elaborated in our previous works.Citation33
Cytotoxicity evaluation of PEG-b-(PELG-g-PZLL)
Cytotoxicity evaluation of PEG-b-(PELG-g-PZLL) mainly referred to our previous works.Citation33
Loading of QUE through PEG-b-(PELG-g-PZLL)
To investigate the encapsulation of QUE through PEG-b-(PELG-g-PZLL), a fixed amount of QUE (5 mg/mL) in PBS was associated with PEG-b-(PELG-g-PZLL) in PBS and then dialyzed via dialysis bag (MWCO =7 kDa). The PEG-b-(PELG-g-PZLL)-encapsulated QUE was measured by high-performance liquid chromatography (HPLC) and transmission electron microscopy (TEM).
In vitro release
QUE release from PEG-b-(PELG-g-PZLL) was assessed via dialysis (MWCO =7 kDa) at 37°C with 5 mL of QUE/P compound against 80 mL of 0.02 mol/L PB. At (0.02–5) day time interval, a fixed amount of release medium was extracted and replenished with a proper amount of fresh release medium. The quantity of released QUE remaining in the dialysis bag was assessed via HPLC. The free QUE release in the absence of polymeric compound was also implemented as a control.
Animals
Male Sprague Dawley rats (170–230 g) were obtained from Jiaxing University, Medical College, Jiaxing, People’s Republic of China. The procedures and care of the Sprague Dawley rats were authorized by the Institutional Ethics Committee of Jiaxing University, Medical College, Jiaxing, People’s Republic of China. The expedition conformed to the guide for the care and use of laboratory animal published by the US National Institutes of Health (NIH Publication updated in 2011).
Blood QUE concentration assessment
Sprague Dawley rats were administrated a dose of 10 mg/kg QUE or QUE/P via abdominal subcutaneous injection. A volume of 0.2 mL blood was extracted at a fixed time interval from aorta abdominalis and then separated promptly via centrifugation (12,000× g for 20 min), and immediately stored at −80°C for the following analyses. The concentrations of QUE and QUE/P were evaluated via HPLC following the previous reports.Citation34
Distribution of QUE/P compound in Sprague Dawley rats
Sprague Dawley male rats were administrated a dose of 10 mg/kg QUE/P via abdominal subcutaneous injection. To extract left kidneys into test tubes, miscible liquids including 0.2 mL 60% perchloric acid and 0.2 mL 30% hydrogen peroxide were added. The sample was kept in a 80°C water bath for 50 min and then color of the sample changed to faint yellow. To extract 0.2 mL of tissue liquid, 1 mL of scintillation solution and 3 mL of absolute ethyl alcohol were added, and then radioactivity of the left kidney was measured via TRI-CARB2900 TR liquid scintillation counter (PACKARB) following previous methods.Citation35
Diabetic animal procedure
Male Sprague Dawley rats were administrated a high-fat diet (fat content 40%) for 10 weeks and then streptozotocin was injected only once at a dose of 35 mg/kg through abdomina. After 3 days, diabetes was evaluated by checking blood glucose content using glucose oxidase-peroxidase (GOD-POD) methods.Citation36 Animals with blood glucose content >16.7 mmol/L were used in the study.
Therapeutic assessment of QUE/P compound in diabetic rats
Thirty diabetic rats were randomly assigned to three groups (n=10, each group): 1) control group; 2) QUE group: 10 mg/kg as a single abdominal subcutaneous injection; 3) QUE/P group: 10 mg/kg as a single abdominal subcutaneous injection. At a fixed time, blood glucose contents were checked by GOD-POD ways.Citation36
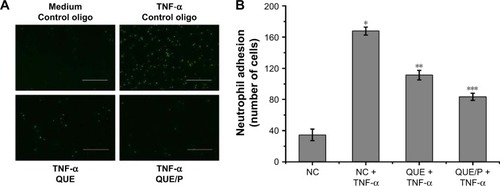
QUE/P suppresses neutrophil adhesion in vivo
To study the functional relevance of QUE/P, we checked the effect of QUE/P on leukocyte adhesion to ECs. The detailed process mainly referred to previous documents.Citation25 To measure the change, we added QUE and QUE/P in HUVECs, and treated by tumor necrosis factor-α (TNF-α), added carboxyfluorescein diacetate succinimidyl ester-labeled acute promyelocytic leukemia (HL-60) leukocytes, washed the mixtures, and checked leukocyte binding to the ECs. Neutrophil adhesion in vivo was observed by immunofluorescence microscopy method.
Therapeutic assessment of QUE/P compound in DN
Eight normal Sprague Dawley rats and 24 diabetic rats were assigned to four groups (n=8, each group): 1) Sham group: normal Sprague Dawley rats were administrated a standard diet; 2) DN group: equal volume of normal saline was subcutaneously injected for 8 weeks in diabetic rats; 3) QUE group: 10 mg/kg as a single abdominal subcutaneous injection daily for 8 weeks continually in diabetic rats; and 4) QUE/P group: 10 mg/kg as a single abdominal subcutaneous injection every 5 days, continually injected for 8 weeks to diabetic rats. At a fixed time, blood and left kidneys were collected. Renal pathological damage, BUN, Scr, SOD: the kidneys were collected and the blood was purged drastically, homogenized (100 mg), and centrifuged at 3,600× g for 20 min to gain the liquid supernatant. SOD activity was checked using xanthine oxidase method. The absorbances were checked at 550 nm. Lipid peroxide contents were shown by “U” of SOD/mg protein in tissues, malonyldialdehyde (MDA, the kidneys were collected and the blood was purged drastically, homogenized (100 mg), and centrifuged at 3,600× g for 20 min to gain the liquid supernatant. MDA level was measured through thiobarbituric acid method. The absorbances were checked at 532 nm. Lipid peroxide contents are shown by “nmol” of MDA/mg protein in tissues.), serum lipid, urine protein (after 8 weeks, 24 h urine was collected with a metabolic cage for diabetic rats and urine protein was measured by Hitachi 7170 automatic biochemical analyzer.), albumin/creatinine ratio (after 8 weeks, 24-h urine was collected with a metabolic cage for diabetic rats, and albumin and creatinine were measured by Hitachi 7170 automatic biochemical analyzer, then albumin/creatinine ratio was calculated.), CD11b+ cells infiltration (referred to previous literatureCitation25), and expression of ICAM-1 (referred to previous literatureCitation25) were evaluated.
Statistical analyses
The analysis was actualized via SPSS. Data were expressed as the mean ± standard deviation. Statistical analysis was actualized by unpaired Student’s t-tests or ANOVA. Value of p<0.01 was considered statistically remarkable.
Results
Synthesis and characterization of PEG-b-(PELG-g-PZLL)
The PEG-b-(PELG-g-PZLL) contained a PEG block and a brush-like PZLL block (Figures S1 and S2); they were characterized via Fourier transform infrared spectroscopy, as depicted in .
Cellular viability assessment
The assessment of cell toxicity from PEG-b-(PELG-g-PZLL) on HeLa cells was measured in 24-h culture and the result is shown in . PEG-b-(PELG-g-PZLL) maintained low cell toxicity even below a concentration as high as 200 μg/mL.
Encapsulation capacity of QUE in PEG-b-(PELG-g-PZLL)
QUE was efficiently encapsulated by PEG-b-(PELG-g-PZLL) at physiological pH via hydrophobic interaction. To add QUE in PEG-b-(PELG-g-PZLL) (mass ratio =1:5) and dialyze against PB solution. The dialysis of free QUE as a control was also actualized at the same condition. To decide the encapsulation of QUE in PEG-b-(PELG-g-PZLL), the quantity of QUE was measured via HPLC. The encapsulation of QUE was found to be 53.2%, as depicted in .
Table 1 Molecular weight, PDI, TEM, particle size, and QUE-loading capacity of P
Characterization assessment of QUE/P compound
The QUE/P compound was evaluated via TEM. The image of TEM is shown in . The QUE/P compound displayed an orbicular structure and the diameter was 64 nm (). The QUE/P compound was further characterized by a granulometer. The average particle size distributions of PEG-b-(PELG-g-PZLL) and QUE/P are evaluated in and . The average diameters of PEG-b-(PELG-g-PZLL) and QUE/P were about 9 and 32 nm, respectively.
In vitro release of QUE
The QUE release from PEG-b-(PELG-g-PZLL) was evaluated via dialysis method (MWCO =7 kDa) at 37°C, with 5 mL of QUE/P against a PB solution of 0.02 mol/L (physiological condition). The release curve of QUE/P is described in . After 4 h, 15.23% of QUE was released from QUE/P, showing the beginning of a burst release of QUE. About 71.15% of QUE was released after 3 days and 85.43% after 5 days, showing biphase release profile from QUE/P.
Serum QUE content
The contents of QUE in serum of Sprague Dawley rats following a single subcutaneous injection in QUE group at a dose of 10 mg/kg rapidly attained Cmax of 26.78 μg/mL at Tmax of 2 h, and decreased to baseline content within 10 h of administration. The serum content of Sprague Dawley rats following a single subcutaneous injection in QUE/P group at a dose of 10 mg/kg attained Cmax of 17.85 μg/mL at Tmax of 8 h, and decreased to baseline content within 5 days of administration. The results affirmed that the release of QUE from QUE/P group was substantially sustained compared to QUE group ().
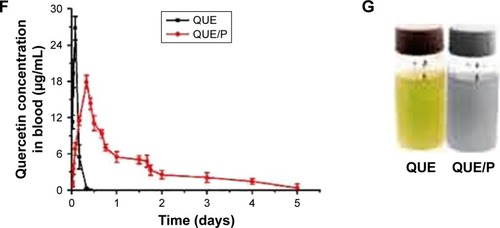
In vivo distribution assessment
The disintegrations per minute of kidney ranged from 89±23 to 1,875±34 within 0.05–5 days through QUE/P of administration. The result affirmed that QUE/P could be metabolized through the kidneys ().
Figure 2 The distribution of quercetin/PEG-b-(PELG-g-PZLL) compound in rats.
Note: The distribution of quercetin/PEG-b-(PELG-g-PZLL) in rats and results expressed as mean ± standard deviation.
Abbreviations: PEG-b-(PELG-g-PZLL), poly(ethylene glycol)-b-(poly(ethylenediamine l-glutamate)-g-poly(ε-benzyloxycarbonyl-l-lysine)); DPM, disintegrations per minute.
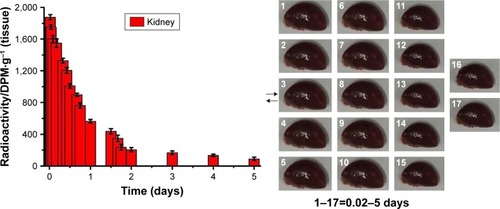
Histopathologic evaluation
Light microscopy images of kidney sections are evaluated in . Glomerular volume increase and swelling, tubulointerstitial fibrosis, infiltration of local lymphocytes in the renal cortex, and basement membrane hyperplasia were observed in histological specimens from DN group but were absent in Sham group (). Histological changes were reduced in QUE and QUE/P groups () compared to DN group. Histological changes were remarkably reduced in QUE/P group () compared to DN group. Gross appearance of kidney is evaluated in . Glomerular volume increase and swelling were observed through naked eye examination in DN group but Sham group was generally normal (). Naked eye examination was reduced in QUE and QUE/P groups () compared to DN group. Naked eye examination was remarkably reduced in QUE/P group () com-pared to DN group.
Figure 3 Histopathologic assessment of kidney damage.
Notes: Light microscope images (×400) in Sham group, DN group, QUE group, QUE/P group, respectively (A); quantitative injury scores, expressed as mean ± SD, are shown in (B); gross appearance in Sham group, DN group, QUE group, QUE/P group, respectively (C). A remarkable augment relative to Sham group is denoted by “*” (p<0.01), a remarkable decrease relative to DN group is denoted by “**” (p<0.01), and a remarkable decrease relative to DN group is denoted by “***” (p<0.01).
Abbreviations: DN, diabetic nephropathy; QUE/P, quercetin/poly(ethylene glycol)-b-(poly(ethylenediamine l-glutamate)-g-poly(ε-benzyloxycarbonyl-l-lysine)); SD, standard deviation.
Blood glucose content
To evaluate the blood glucose contents in a fixed time for diabetic rats administered QUE and QUE/P, and compared with control group, the result showed that diabetic rats injected with QUE maintained blood glucose contents in normal change for about 8 h, after which glycemia slowly augmented. By contrast, QUE/P compound decreased blood glucose contents to 5.1 mmol/L at 2 h after administration. Over the following 5 days, blood glucose contents increased to 4.4 mmol/L and were then maintained at about 4.1–6.2 mmol/L for 5 days ().
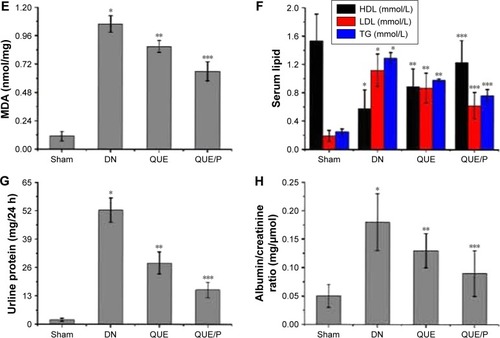
Figure 4 The activity of SOD and the levels of blood glucose, BUN, Scr, MDA, HDL, LDL, TG, urine protein, and albumin/creatinine ratio.
Notes: (A) Level of blood glucose in control group, QUE group, QUE/P group, respectively; (B) level of BUN in Sham group, DN group, QUE group, QUE/P group, respectively; (C) level of Scr in Sham group, DN group, QUE group, QUE/P group, respectively; (D) activity of SOD in Sham group, DN group, QUE group, QUE/P group, respectively; (E) level of MDA in Sham group, DN group, QUE group, QUE/P group, respectively; (F) level of HDL, LDL, and TG in Sham group, DN group, QUE group, QUE/P group, respectively; (G) level of urine protein in Sham group, DN group, QUE group, QUE/P group, respectively; (H) albumin/creatinine ratio. (B, C, E, F-LDL and TG, G, H) A remarkable augment relative to the Sham group is denoted by “*” (p<0.01), a remarkable decrease relative to DN group is denoted by “**” (p<0.01), and a remarkable decrease relative to DN group is denoted by “***” (p<0.01); (D, F-HDL) a remarkable decrease relative to the Sham group is denoted by “*” (p<0.01), a remarkable increase relative to DN group is denoted by “**” (p<0.01), and a remarkable increase relative to DN group is denoted by “***” (p<0.01).
Abbreviations: SOD, superoxide dismutase; BUN, blood urea nitrogen; Scr, serum creatinine; MDA, malonyldialdehyde; HDL, high-density lipoprotein; LDL, low-density lipoprotein; TG, triglyceride; QUE/P, quercetin/poly(ethylene glycol)-b-(poly(ethylenediamine l-glutamate)-g-poly(ε-benzyloxycarbonyl-l-lysine)); DN, diabetic nephropathy.
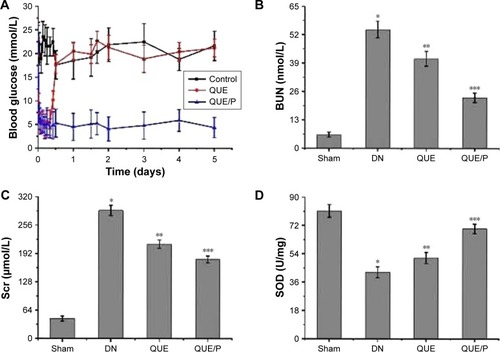
BUN and Scr contents
Level of BUN was evaluated in DN group (), and was found to be higher in DN group than in Sham group (p<0.01; BUN: Sham group 6.23±1.13 mmol/L, DN group 54.37±3.79 mmol/L). Administration of QUE reduced BUN (41.05±3.38 mmol/L) compared with BUN in DN group (p<0.01). Administration of QUE/P remarkably reduced BUN (23.18±2.17 mmol/L) compared with BUN in DN group (p<0.01).
Level of Scr was evaluated in DN group (), and was found to be higher in DN group than in Sham group (p<0.01; Scr: Sham group 45.26±5.78 μmol/L, DN group 289.16±11.27 μmol/L). Administration of QUE reduced Scr (213.56±9.37 μmol/L) compared with Scr in DN group (p<0.01). Administration of QUE/P remarkably reduced Scr (178.93±8.03 μmol/L) compared with Scr in DN group (p<0.01).
SOD activity and MDA level
Activity of SOD was evaluated in DN group (), and was found to be lower in DN group than in Sham group (p<0.01; SOD: Sham group 81.26±4.06 U/mg, DN group 42.36±3.49 U/mg). Administration of QUE increased SOD (51.37±3.57 U/mg) compared with SOD in DN group (p<0.01). Administration of QUE/P remarkably increased SOD (69.84±3.02 U/mg) compared with SOD in DN group (p<0.01).
Level of MDA was evaluated in DN group (), and was found to be higher in DN group than in Sham group (p<0.01; MDA: Sham group 0.11±0.04 nmol/mg, DN group 1.06±0.07 nmol/mg). Administration of QUE reduced MDA (0.87±0.05 nmol/mg) compared with MDA in DN group (p<0.01). Administration of QUE/P remarkably reduced MDA (0.66±0.08 nmol/mg) compared with MDA in DN group (p<0.01).
Serum lipid content
Level of high-density lipoprotein (HDL) was evaluated in DN group (), and was found to be lower in DN group than in Sham group (p<0.01; HDL: Sham group 1.53±0.38 mmol/L, DN group 0.58±0.26 mmol/L). Administration of QUE increased HDL (0.89±0.25 mmol/L) compared with HDL in DN group (p<0.01). Administration of QUE/P remarkably increased HDL (1.23±0.31 mmol/L) compared with HDL in DN group (p<0.01).
Level of low-density lipoprotein (LDL) was evaluated in DN group (), and was found to be higher in DN group than in Sham group (p<0.01; LDL: Sham group 0.19±0.08 mmol/L, DN group 1.12±0.23 mmol/L). Administration of QUE decreased LDL (0.87±0.21 mmol/L) compared with LDL in DN group (p<0.01). Administration of QUE/P remarkably decreased LDL (0.62±0.19 mmol/L) compared with LDL in DN group (p<0.01).
Level of triglyceride (TG) was evaluated in DN group (), and was found to be higher in DN group than in Sham group (p<0.01; TG: Sham group 0.25±0.04 mmol/L, DN group 1.29±0.08 mmol/L). Administration of QUE decreased TG (0.98±0.02 mmol/L) compared with TG in DN group (p<0.01). Administration of QUE/P demarkably decreased TG (0.76±0.09 mmol/L) compared with TG in DN group (p<0.01).
Urine protein
Level of urine protein was evaluated in DN group (), and was found to be higher in DN group than in Sham group (p<0.01; urine protein: Sham group 2.14±0.67 mg/24 h, DN group 52.29±5.59 mg/24 h). Administration of QUE decreased urine protein (28.15±5.07 mg/24 h) compared with urine protein in DN group (p<0.01). Administration of QUE/P demarkably decreased urine protein (15.79±3.49 mg/24 h) compared with urine protein in DN group (p<0.01).
Albumin/creatinine ratio
Level of albumin/creatinine ratio was evaluated in DN group (), and was found to be higher in DN group than in Sham group (p<0.01; albumin/creatinine ratio: Sham group 0.05±0.02 mg/μmol, DN group 0.18±0.05 mg/μmol). Administration of QUE decreased albumin/creatinine ratio (0.13±0.03 mg/μmol) compared with albumin/creatinine ratio in DN group (p<0.01). Administration of QUE/P demarkably decreased albumin/creatinine ratio (0.09±0.04 mg/μmol) compared with albumin/creatinine ratio in DN group (p<0.01).
QUE/P suppressed neutrophil adhesion
To evaluate neutrophil adhesion in HUVECs (). TNF-α stimulation remarkably enhanced leukocyte adhesion to ECs. QUE reduced leukocyte binding to TNF-α-challenged HUVECs and QUE/P remarkably reduced leukocyte binding to TNF-α-challenged HUVECs (). Our result affirmed that QUE or QUE/P modulated leukocyte adherence to the TNF-α-challenged HUVECs.
Figure 5 QUE/P inhibits neutrophil adhesion in vivo (immunofluorescence photomicrographs).
Notes: (A) The image displaying CFSE-labeled HL-60 adhesion to HUVECs. HUVECs are administrated with QUE, QUE/P, and control oligonucleotide for 24 h and then administrated with or without TNF-α for 6 h. CFSE-labeled HL-60 are put into the HUVECs and incubated at 37°C for 45 min, and then the mixtures were washed. (B) Amount of neutrophil (CFSE-labeled HL-60) adhering to HUVECs in NC group, NC + TNF-α group, QUE + TNF-α group, QUE/P + TNF-α group, respectively. Data are shown as mean ± SD. A remarkable augment relative to the NC group is denoted by “*” (p<0.01), a remarkable decrease relative to NC + TNF-α group is denoted by “**” (p<0.01), and a remarkable decrease relative to NC + TNF-α group is denoted by “***” (p<0.01).
Abbreviations: QUE/P, quercetin/poly(ethylene glycol)-b-(poly(ethylenediamine l-glutamate)-g-poly(ε-benzyloxycarbonyl-l-lysine)); CFSE, carboxyfluorescein diacetate succinimidyl ester; HL-60, acute promyelocytic leukemia; HUVECs, human umbilical vein endothelial cells; TNF-α, tumor necrosis factor-α; SD, standard deviation; NC, normal control.
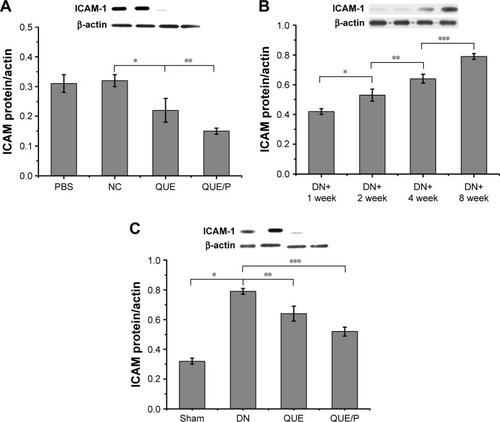
Expression of ICAM-1
Expression of ICAM-1 was higher in NC group than in QUE and QUE/P groups (p<0.01). Administration of QUE decreased ICAM-1 expression compared with ICAM-1 expression in NC group (p<0.01). Administration of QUE/P demarkably decreased ICAM-1 expression compared with ICAM-1 expression in NC group (p<0.01) (). Expression of ICAM-1 was higher in DN+2 week group than in DN+1 week group (p<0.01). Expression of ICAM-1 was higher in DN+4 week group than in DN+2 week group (p<0.01). Expression of ICAM-1 was higher in DN+8 week group than in DN+4 week group (p<0.01) (). Expression of ICAM-1 was higher in DN group than in Sham group (p<0.01). Administration of QUE decreased ICAM-1 expression compared with ICAM-1 expression in DN group (p<0.01). Administration of QUE/P demarkably decreased ICAM-1 expression compared with ICAM-1 expression in DN group (p<0.01) ().
Figure 6 QUE/P downregulates ICAM-1 expression in vivo.
Notes: (A) Expression of ICAM-1 in PBS group, NC group, QUE group, QUE/P group, respectively. (B) Expression of ICAM-1 in DN+1 week group, DN+2 week group, DN+4 week group, DN+8 week group, respectively. (C) Expression of ICAM-1 in Sham group, DN group, QUE group, QUE/P group, respectively. A remarkable decrease relative to the NC group is denoted by “*” (p<0.01), a remarkable decrease relative to NC group is denoted by “**” (p<0.01) (A); a remarkable augment relative to the DN+1 week group is denoted by “*” (p<0.01), a remarkable increase relative to DN+2 week group is denoted by “**” (p<0.01), and a remarkable increase relative to DN+4 week group is denoted by “***” (p<0.01) (B); a remarkable augment relative to the DN group is denoted by “*” (p<0.01), a remarkable decrease relative to DN group is denoted by “**” (p<0.01), and a remarkable decrease relative to DN group is denoted by “***” (p<0.01) (C).
Abbreviations: QUE/P, quercetin/poly(ethylene glycol)-b-(poly(ethylenediamine l-glutamate)-g-poly(ε-benzyloxycarbonyl-l-lysine)); ICAM-1, intercellular adhesion molecular-1; PBS, phosphate-buffered saline; DN, diabetic nephropathy; NC, normal control.
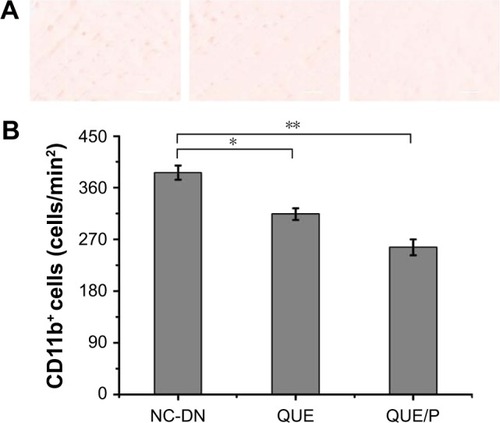
QUE/P attenuated inflammatory cells infiltration to the kidney tissue following DN
Infiltration of CD11b+ was evaluated in NC-DN group (). Administration of QUE decreased CD11b+ infiltration compared with CD11b+ infiltration in NC-DN group (p<0.01). Administration of QUE/P demarkably decreased CD11b+ infiltration compared with CD11b+ infiltration in NC-DN group (p<0.01).
Figure 7 QUE/P decreases inflammatory cell infiltration to the DN.
Notes: (A) Image of immunohistochemical staining for CD11b+ myeloid cells in NC-DN group, QUE group, QUE/P group, respectively; (B) quantitative value in NC-DN group, QUE group, QUE/P group, respectively. A remarkable decrease relative to the NC-DN group is denoted by “*” (p<0.01) and a remarkable decrease relative to NC-DN group is denoted by “**” (p<0.01).
Abbreviations: QUE/P, quercetin/poly(ethylene glycol)-b-(poly(ethylenediamine l-glutamate)-g-poly(ε-benzyloxycarbonyl-l-lysine)); DN, diabetic nephropathy; NC, normal control.
Scheme 1 The structure of quercetin/PEG-b-(PELG-g-PZLL).
Abbreviation: PEG-b-(PELG-g-PZLL), poly(ethylene glycol)-b-(poly(ethylenediamine l-glutamate)-g-poly(ε-benzyloxycarbonyl-l-lysine)).
Discussion
Diabetes mellitus contributed to pathology in a wide change of conditions, containing large vessels and microvascular damage, and was also a major challenge during heart, brain, peripheral nerves, eyes, feet and kidney injury. In this study, diabetes mellitus involved in kidney damage was a life-threatening complication.Citation37 Currently, innovative curative methods for DN make use of traditional antidiabetic drugs (such as insulin and exenatide), metabolic modulation, cell factors, therapeutic gases like hydrogen sulfide, nucleotide, and QUE.Citation10,Citation38–Citation44 QUE belongs to plant flavonoid and modulates oxidative stress and inflammatory injury in vivo.Citation12 A growing number of researches have suggested that QUE is involved in the modulation of DN.Citation44 However, since QUE possesses the shortcoming of low solubility and short circulation time in vivo, we therefore synthesized PEG-b-(PELG-g-PZLL) carrier to load QUE through hydrophobic interaction for improving its bioactivity in vivo. In this research, PEG-b-(PELG-g-PZLL) really promoted the therapeutic effect of QUE in DN. In the rat model of DN, QUE or QUE/P ameliorated renal pathological damage, enhanced renal function recovery, promoted metabolic modulation, and alleviated oxidative stress and inflammatory injury.
The extensive change of pathological procedure contributed to DN, within which leukocyte-EC adhesion and EC inflammation exacerbated glomerular EC injury.Citation45–Citation49 Hence, reducing leukocyte-EC adhesion and EC inflammation are promising therapeutic tactics to alleviate DN. ICAM-1 is a member of the CAM superfamily and plays an important effect in mediating the migration of leukocytes to pass through the endothelium and enter the kidneys. In the current study, a wide range of pathological process contributed to DN, among which leukocyte-EC adhesion and EC inflammation exacerbated renal dysfunction in DN. There was a growing appreciation that ECs were vulnerable to DN and they could be the critical determinants for the extent of DN and the recovery time. Consequently, reducing microvascular permeability and restraining leukocyte-EC adhesion improved therapeutic effects to decrease DN. ICAM-1, a member of cells adhesion molecule superfamily expressed via ECs, played a important function in mediating the migration of leukocyte across the endothelium and into the kidney. QUE or QUE/P ameliorated leukocyte-EC adhesion and EC inflammation through modulating ICAM-1 expression. On the other hand, TNF-α-stimulated HUVEC was regarded as a model of EC inflammation, and QUE or QUE/P downregulated EC inflammation in TNF-α-stimulated HUVECs. The result showed that QUE or QUE/P decreased leukocyte-EC adhesion and EC inflammation to ameliorate tissue injury. Moreover, in vivo research using DN model affirmed that QUE or QUE/P restrained the enhancement of CD11b+ myeloid cells in DN. The findings showed that QUE or QUE/P attenuated DN through suppressing ICAM-1 expression and inflammatory cell infiltration (CD11b+). These results were consistent with previous documents.Citation50–Citation53 Furthermore, in vivo study using DN model showed that QUE or QUE/P suppressed expression of ICAM-1, thereby decreasing the accumulation of CD11b+ myeloid cells in the DN, which may account for the decreased DN as evidenced by decreased MDA level and increased SOD activity.
In conclusion, we found that PEG-b-(PELG-g-PZLL) could improve the serum content of QUE in Sprague Dawley rats and increase the circulation time of QUE. In addition, PEG-b-(PELG-g-PZLL) could maintain a normal glucose level for up to 5 days, compared to free QUE in diabetic rats, and remarkably alleviate DN through suppressing ICAM-1 expression. These researches amplified our understanding of the interaction between QUE or QUE/P and ECs and its effect in DN. Hence, QUE or QUE/P may act as a valuable therapeutic drug in the setting of DN.
Conclusion
Synthesized PEG-b-(PELG-g-PZLL) remarkably augmented the bioactivity of QUE. Administration of QUE/P remark-ably improved the serum content of QUE in Sprague Dawley rats, and also remarkably inhibited the hyperglycemia and decreased DN.
Acknowledgments
The authors appreciated the support from the Science and Technology Planning Project of Jiaxing (2017AY33076).
Disclosure
The authors report no conflicts of interest in this work.
Supplementary materials
Synthesis of PEG-b-(PELG-g-PZLL)
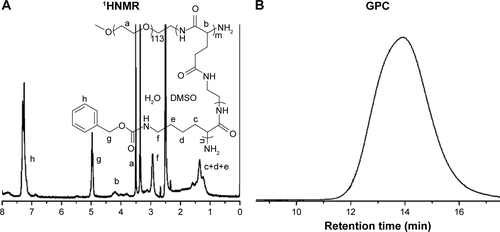
Poly(ethylene glycol)-b-(poly(ethylenediamine l-glutamate)-g-poly(ε-benzyloxycarbonyl-l-lysine)) (PEG-b-(PELG-g-PZLL)) was synthesized by the following method: PEG-b-PBLG was prepared via ring-opening polymerization of BLG-N-carboxyanhydride (NCA), with PEG-NH2 as the macroinitiator, followed via aminolysis with ethanediamine to get PEG-b-PELG. PEG-b-PELG was used as the macroinitiator to initiate the ring-opening polymerization of ZLL-NCA to obtain PEG-b-(PELG-g-PZLL), as depicted in Figure S1. The degree of polymerization of PELG was 50 and the degree of polymerization of PZLL was 3, and they were characterized via 1H-nuclear magnetic resonance and gel permeation chromatogram, as depicted in Figure S2.
Figure S1 Synthesis of PEG-b-(PELG-g-PZLL).
Abbreviations: PEG-NH2, poly(ethylene glycol) amine; PEG-b-PBLG, poly(ethylene glycol)-b-poly(γ-benzyl l-glutamate); PEG-b-PELG, poly(ethylene glycol)-b-poly(ethylen-ediamine l-glutamate); PEG-b-(PELG-g-PZLL), poly(ethylene glycol)-b-(poly(ethylenediamine l-glutamate)-g-poly(ε-benzyloxycarbonyl-l-lysine)).
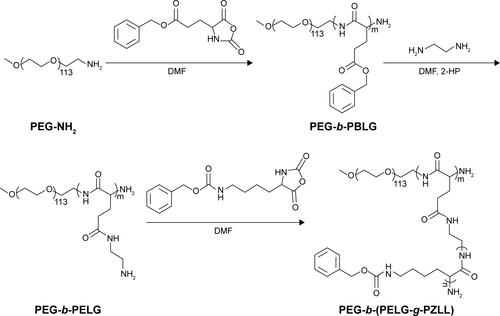
Figure S2 Characterization of PEG-b-(PELG-g-PZLL).
Notes: (A) 1HNMR of PEG-b-(PELG-g-PZLL); (B) GPCs of PEG-b-(PELG-g-PZLL).
Abbreviations: PEG-b-(PELG-g-PZLL), poly(ethylene glycol)-b-(poly(ethylenediamine l-glutamate)-g-poly(ε-benzyloxycarbonyl-l-lysine)); 1HNMR, 1H-nuclear magnetic resonance; GPC, gel permeation chromatogram.
References
- AndersenARChristiansenJSAndersenJKKreinerSDeckertTDiabetic nephropathy in Type 1 (insulin-dependent) diabetes: an epidemiological studyDiabetologia19832564965016363177
- RossingPRossingKJacobsenPParvingHHUnchanged incidence of diabetic nephropathy in IDDM patientsDiabetes19954477397437789641
- AnjaneyuluMChopraKQuercetin, an anti-oxidant bioflavonoid, attenuates diabetic nephropathy in ratsClin Exp Pharmacol Physiol200431424424815053821
- LinCYYinMCRenal protective effects of extracts from guava fruit (Psidium guajava L.) in diabetic micePlant Foods Hum Nutr201267330330822581156
- Aires NetoPGomesHVCamposMManagement of hyperglycemia in patients with chronic kidney diseaseJ Nephrol201326462963523807643
- VallonVRoseMGerasimovaMKnockout of Na-glucose transporter SGLT2 attenuates hyperglycemia and glomerular hyperfiltration but not kidney growth or injury in diabetes mellitusAm J Physiol Renal Physiol20133042F156F16723152292
- PowellDWKenagyDNZhengSAssociations between structural and functional changes to the kidney in diabetic humans and miceLife Sci201393725726423800643
- HongJNLiWWWangLLJiangtang decoction ameliorate diabetic nephropathy through the regulation of PI3K/Akt-mediated NF-κB pathways in KK-Ay miceChin Med2017121328529539
- GomesIBPortoMLSantosMCRenoprotective, anti-oxidative and anti-apoptotic effects of oral low-dose quercetin in the C57BL/6J model of diabetic nephropathyLipids Health Dis20141318425481305
- TongFPreparation of exenatide-loaded linear poly(ethylene glycol)-brush poly(l-lysine) block copolymer: potential implications on diabetic nephropathyInt J Nanomedicine2017124663467828721043
- BrownleeMBiochemistry and molecular cell biology of diabetic complicationsNature2001414686581382011742414
- StewartLKSoileauJLRibnickyDQuercetin transiently increases energy expenditure but persistently decreases circulating markers of inflammation in C57BL/6J mice fed a high-fat dietMetabolism2008577 Suppl 1S39S4618555853
- XieWDuLDiabetes is an inflammatory disease: evidence from traditional Chinese medicinesDiabetes Obes Metab201113428930121205111
- CsokayBPrajdaNWeberGOlahEMolecular mechanisms in the antiproliferative action of quercetinLife Sci19976024215721639188758
- LouMZhangLNJiPGQuercetin nanoparticles induced autophagy and apoptosis through AKT/ERK/Caspase-3 signaling pathway in human neuroglioma cells: in vitro and in vivoBiomed Pharmacother2016841927621033
- WuXMGaoYBXuLPTongxinluo inhibits renal fibrosis in diabetic nephropathy: involvement of the suppression of intercellular transfer of TGF-[formula: see text]1-containing exosomes from GECs to GMCsAm J Chin Med20174551075109228659030
- WangZBZhangSLiYLY333531, a PKCβ inhibitor, attenuates glomerular endothelial cell apoptosis in the early stage of mouse diabetic nephropathy via down-regulating swiprosin-1Acta Pharmacol Sin20173871009102328414198
- DavidsonSMDuchenMREndothelial mitochondria: contributing to vascular function and diseaseCirc Res200710081128114117463328
- KharbandaRKPetersMWaltonBIschemic preconditioning prevents endothelial injury and systemic neutrophil activation during ischemia-reperfusion in humans in vivoCirculation2001103121624163011273988
- YamagataKTagamiMYamoriYDietary polyphenols regulate endothelial function and prevent cardiovascular diseaseNutrition2015311283725466651
- RebholzCMHarmanJLGramsMEAssociation between Endothelin-1 Levels and Kidney Disease among BlacksJ Am Soc Nephrol Epub2017711
- HaraTIshidaTCangaraHMHirataKEndothelial cell-selective adhesion molecule regulates albuminuria in diabetic nephropathyMicrovasc Res200977334835519323980
- SugimotoHShikataKHirataKIncreased expression of intercellular adhesion molecule-1 (ICAM-1) in diabetic rat glomeruli: glomerular hyperfiltration is a potential mechanism of ICAM-1 upregulationDiabetes19974612207520819392499
- LiZYangZLuoXEffects of burn serum on expression of CD11/CD18 on polymorphonuclear neutrophils and ICAM-1 on endothelial cellsActa Academiae Medicinae Militaris Tertiae199719101104
- LiuRRLiJGongJYMicroRNA-141 regulates the expression level of ICAM-1 on endothelium to decrease myocardial ischemia-reperfusion injuryAm J Physiol Heart Circ Physiol20153098H1303H131326371161
- BehrJGaskinBFuCDongCKunzRLocalized modeling of biochemical and flow interactions during cancer cell adhesionPLoS One2015109e013692626366568
- TianSTangJLiuHPropyl gallate plays a nephroprotective role in early stage of diabetic nephropathy associated with suppression of glomerular endothelial cell proliferation and angiogenesisExp Diabetes Res2012201220956722988451
- SugimotoHShikataKMatsudaMIncreased expression of endothelial cell nitric oxide synthase (ecNOS) in afferent and glomerular endothelial cells is involved in glomerular hyperfiltration of diabetic nephropathyDiabetologia19984112142614349867209
- LuQJiXJZhouYXQuercetin inhibits the mTORC1/p70S6K signaling-mediated renal tubular epithelial-mesenchymal transition and renal fibrosis in diabetic nephropathyPharmacol Res20159923724726151815
- LiCZhangWJFreiBQuercetin inhibits LPS-induced adhesion molecule expression and oxidant production in human aortic endothelial cells by p38-mediated Nrf2 activation and antioxidant enzyme inductionRedox Biol2016910411327454768
- BhaskarSSudhakaranPRHelenAQuercetin attenuates atherosclerotic inflammation and adhesion molecule expression by modulating TLR-NF-κB signaling pathwayCell Immunol201631013114027585526
- ChakrabortyJSinghRDuttaDNaskarARajammaUMohanakumarKPQuercetin improves behavioral deficiencies, restores astrocytes and microglia, and reduces serotonin metabolism in 3-nitropropionic acid-induced rat model of Huntington’s DiseaseCNS Neurosci Ther2014201101924188794
- TongFTangXLiXXiaWLiuDThe effect of insulin-loaded linear poly(ethylene glycol)-brush-like poly(l-lysine) block copolymer on renal ischemia/reperfusion-induced lung injury through downregulating hypoxia-inducible factorInt J Nanomedicine2016111717173027175073
- FengXZDingYFLiXHPLC determination of quercetin and its entrapment efficiency in nanoliposomeChin J Pharm Anal2008284556558
- LiSJiangWQWangAXGuanZZZhangLPanSRReleasing characterization, pharmacokinetics and distribution of PEG-PBLG copolymer micelles in vitro and in vivoChinese Pharm J2005409699702
- DingYVaziriNDCoulsonRKamannaVSRohDDEffects of simulated hyperglycemia, insulin, and glucagon on endothelial nitric oxide synthase expressionAm J Physiol Endocrinol Metab20002791E11E1710893317
- AbouzedTKMunesueSHarashimaAPreventive effect of salicylate and pyridoxamine on diabetic nephropathyJ Diabetes Res20162016178678928042580
- SafarMMAbdelsalamRMH2S donors attenuate diabetic nephropathy in rats: modulation of oxidant status and polyol pathwayPharmacol Rep2015671172325560570
- ZhangYJiaNHuFAssociation of single-nucleotide polymorphisms in the RAGE gene and its gene-environment interactions with diabetic nephropathy in Chinese patients with type 2 diabetesOncotarget Epub2017628
- DhamodharanUEzhilarasiKPonjayanthiBSireeshDRamkumarKMViswanathanVAssociation of A1538G and C2437T single nucleotide polymorphisms in heat shock protein-70 genes with diabetic nephropathy among South Indian populationBiosci Rep2017372 pii: BSR20160605
- TianWChenLZhangLEffects of ginsenoside Rg1 on glucose metabolism and liver injury in streptozotocin-induced type 2 diabetic ratsGenet Mol Res2017161
- NgubanePSHadebeSISerumulaMRMusabayaneCTThe effects of transdermal insulin treatment of streptozotocin-induced diabetic rats on kidney function and renal expression of glucose transportersRen Fail201537115115925300909
- SiddiqiFSChenLHAdvaniSLCXCR4 promotes renal tubular cell survival in male diabetic rats: implications for ligand inactivation in the human kidneyEndocrinology201515631121113225549045
- GomesIBPortoMLSantosMCThe protective effects of oral low-dose quercetin on diabetic nephropathy in hypercholesterolemic miceFront Physiol2015624726388784
- BonventreJVYangLCellular pathophysiology of ischemic acute kidney injuryJ Clin Invest2011121114210422122045571
- RopsALJacobsCWLinssenPCHeparan sulfate on activated glomerular endothelial cells and exogenous heparinoids influence the rolling and adhesion of leucocytesNephrol Dial Transplant20072241070107717255131
- YasudaMOhbayashiMShimizuSYamamotoTAngiogenesis induced by adhesion between polymorphonuclear leukocyte and endothelial cell via intercellular adhesion molecule-1New Frontiers in Regenerative Medicine20078393 Conference paper
- XuGQinQYangMQiaoZGuYNiuJHeparanase-driven inflammation from the AGEs-stimulated macrophages changes the functions of glomerular endothelial cellsDiabetes Res Clin Pract2017124304028081450
- YinQHZhangRLiLExendin-4 ameliorates lipotoxicity-induced glomerular endothelial cell injury by improving ABC transporter A1-mediated cholesterol efflux in diabetic apoE knockout miceJ Biol Chem201629151264872650127784780
- Høj ThomsenLFog-TonnesenMNielsen FinkLSmad2 phosphorylation in diabetic kidney tubule epithelial cells is associated with modulation of several transforming growth factor-β family membersNephron2017135429130628064277
- NamgungSYoonJJYoonCSPrunella vulgaris attenuates diabetic renal injury by suppressing glomerular fibrosis and inflammationAm J Chin Med201745347549528359196
- YuCSLaiKCYangJSQuercetin inhibited murine leukemia WEHI-3 cells in vivo and promoted immune responsePhytother Res201024216316819449452
- KobuchiHRoySSenCKNguyenHGPackerLQuercetin inhibits inducible ICAM-1 expression in human endothelial cells through the JNK pathwayAm J Physiol19992773 Pt 1C403C41110484327