
Abstract
Introduction
Nanoparticles (NPs) are used in numerous products in technical fields and biomedicine; their potential adverse effects have to be considered in order to achieve safe applications. Besides their distribution in tissues, organs, and cellular localization, their impact and penetration during the process of tissue formation occurring in vivo during liver regeneration are critical steps for establishment of safe nanomaterials.
Materials and methods
In this study, 3D cell culture of human hepatocarcinoma cells (HepG2) was used to generate cellular spheroids, serving as in vitro liver microtissues. In order to determine their differential distribution and penetration depth in HepG2 spheroids, SiO2 NPs were applied either during or after spheroid formation. The NP penetration was comprehensively studied using confocal laser scanning microscopy and scanning electron microscopy.
Results
Spheroids were exposed to 100 µg mL−1 SiO2 NPs either at the beginning of spheroid formation, or during or after formation of spheroids. Microscopy analyses revealed that NP penetration into the spheroid is limited. During and after spheroid formation, SiO2 NPs penetrated about 20 µm into the spheroids, corresponding to about three cell layers. In contrast, because of the addition of SiO2 NPs simultaneously to cell seeding, NP agglomerates were located also in the spheroid center. Application of SiO2 NPs during the process of spheroid formation had no impact on final spheroid size.
Conclusion
Understanding the distribution of NPs in tissues is essential for biomedical applications. The obtained results indicate that NPs show only limited penetration into already formed tissue, which is probably caused by the alteration of the tissue structure and cell packing density during the process of spheroid formation.
Introduction
Nanoparticles (NPs) as engineered nanomaterials (ENMs) are nowadays used for various applications in the fields of engineering, textiles, cosmetics, food, and medicine.Citation1–Citation4 Their altered physicochemical properties compared to bulk materials in terms of surface reactivity and quantum size effects raised the interest for novel applications.Citation4–Citation6 The increasing use of engineered nano-based products is accompanied with a growing probability of the unintended release of nanoobjects into the environment as well as human exposure to these materials.Citation7 In the last 15 years, various studies aimed to identify critical NP properties contributing to environmental and health effects of ENMs.Citation8–Citation10 For regulatory purposes, strategies for grouping of ENMs are actually discussed as a basis for safe-by-design of ENMs.Citation11 In biomedicine, ENMs are developed for biosensing, diagnostics, targeted drug delivery, and therapeutic purposes.Citation1,Citation12 Therefore, especially in the biomedical field, where the intention is to deliver NPs into the human body, their potential fate and adverse effects have to be considered in order to achieve safe applications.
Table S1 Size and cell number of HepG2 spheroids
The biokinetics of ENMs in terms of distribution and localization in organism is different from larger particles.Citation5 Inhalation, ingestion, dermal penetration, and injection are potential portals of entry of NPs into the organisms.Citation5 After entering the blood circulation, NPs are distributed over the organism reaching secondary organs such as liver and spleen.Citation5,Citation13,Citation14 Niidome et al observed that liver is the major recipient organ.Citation15 In mice, within 72 hours, 35% of the injected dose of polyethylene glycol-modified gold nanorods accumulated in the liver, while only small amounts were found in other organs. van Kesteren et al also observed an accumulation of synthetic amorphous SiO2 NPs mainly in the liver after intravenous administration to rats.Citation16 The highest accumulation of silicium (Si) in the liver with about 300 mg Si kg−1 tissue was determined at day 6 after repeated dosing, later the Si levels decreased again. The Si content of control tissue was about 0.4–0.7 Si mg−1 tissue. The fate of NPs in the liver is still unknown. Park et al reported that after injection of PLGA NPs in mice, the predominant fraction of NPs was taken up by Kupffer cells followed by liver sinusoidal endothelial cells and hepatic stellate cells, while only small fraction of NPs (7%) was found in hepatocytes.Citation17 Hepato-biliary NP clearance turned out to represent a potential excretion route.Citation18,Citation19
The effect of long-term accumulation in the liver is not clear due to the lack of appropriate investigations. Liver plays a central role in physiological processes in the organism to keep metabolic homeostasis and is the main organ for detoxifying xenobiotics and drugs.Citation20–Citation22 The high regenerative capacity of the liver enables the rapid initiation of its growth and mass to maintain basic metabolic function.Citation23–Citation25 Liver regeneration takes place after alterations of the liver mass by cell loss caused by surgical liver resection for removal of liver tumors, injury elicited by virus infection or chemical substances, and also by mass increase in hyperplasia.Citation23,Citation25,Citation26 Partial hepatectomy of about 70% liver mass (removal in a standard operation) initiates the regeneration process mediated by specific stimuli of growth factors and cytokines, resulting in the induction of proliferation (priming) and progression of normally quiescent hepatocytes.Citation22,Citation23,Citation25,Citation26 Hepatocytes, the main cell type responsible for liver growth, induce proliferation from sites around the portal triads to sites located around central veins of the liver.Citation25 The liver is restored to approximately ±10% of the original organ mass in about 1–2 months.Citation23
In vitro liver microtissues can be used as liver models to mimic the in vivo situation. Human hepatocarcinoma cell line HepG2 serves as an in vitro alternative for primary human hepatocytes to study hepatotoxicity and metabolism of drugs.Citation27–Citation29 The establishment of 3D cell culture improved the similarity in morphology and metabolic competence to the native tissue compared to that of 2D cell cultivation.Citation27,Citation30–Citation32 Liver-specific functions such as albumin secretion and cytochrome P450 gene expression are increased under 3D cultivation of HepG2 cells in Matrigel.Citation27,Citation33,Citation34 Besides scaffold-based 3D cell culture using hydrogel or inserts, matrix-free hanging drop method also exists for the formation of cell aggregates or so-called spheroids which allows low cost and high reproducible production of spheroids for use in high-throughput screening.Citation32,Citation35 In recent years, liver microtissues were used as a model for NP toxicity assessment.Citation34,Citation36–Citation39 Dubiak-Szepietowska et al observed a stronger cytotoxic effect of Ag, ZnO, and SiO2 NPs on HepG2 cells when grown in 2D compared to cells grown in 3D hydrogels.Citation34 The lower sensitivity to toxic concentrations of Ag NPs was also detected in HepaRG cell spheroids.Citation39 The reason for reduced cytotoxicity might be the limited penetration of NPs inside the spheroids. It was shown that penetration of NPs applied after spheroid formation is dependent on size, surface charge, and shape of NPs.Citation40–Citation42 Zhao et al observed the limited penetration of spherical NPs in MCF-7 spheroids which remain in the peripheral region of spheroids.Citation42 Theoretical models are developed to describe the NP diffusion in 3D cell spheroids.Citation43,Citation44 Currently, due to its complexity and various parameters affecting NP-diffusive transport, the prediction of NP penetration by these models is only limited.
In the present study, the penetration and distribution of SiO2 NPs was microscopically analyzed in 3D liver microtissues in detail. Previous studies mostly focused on the NP effects after exposure to constructed spheroids. Here, SiO2 NPs were also applied during the formation of HepG2 spheroids in order to model the effect and localization in reconstructing liver during liver regeneration. Therefore, HepG2 cells, a model for hepatocytes and the main cell type in the liver and for liver growth, were cultivated by the hanging drop method to form cell spheroids.Citation22 Spheroids were exposed to NPs 1) simultaneously to cell seeding, 2) during spheroid formation on the second day after cell seeding, or 3) after spheroid formation. SiO2 NPs were used in this study as they are produced at an industrial scale, are used as food additive, and have a high application potential in the field of biomedicine.Citation45–Citation47 In a recent study, it has been shown by a modeling approach that after oral uptake silicium accumulates in the liverCitation16 at a level causing adverse effects in animal studies. The effects of SiO2 NPs on HepG2 spheroids used as a liver model have not been described in the literature until now, while the biological impact on 2D cultivated HepG2 cells was analyzed. Therefore, this study for the first time investigates the distribution and penetration of SiO2 NPs in HepG2 spheroids at various time points of spheroid formation, which is of relevance for biomedical applications as well as for nanosafety. The NP penetration is comprehensively studied using confocal laser scanning microscopy (CLS microscopy) and scanning electron microscopy. The detailed microscopy analysis enables the study of the cellular localization of NPs in order to understand the mechanism and limitation of NP penetration in cellular spheroids.
Materials and methods
Synthesis of fluorescently labeled SiO2 NPs
All chemicals used for particle synthesis were supplied by Sigma-Aldrich Co. (St Louis, MO, USA) in the highest purity available. ATTO 647-NHS ester was purchased from ATTO-TEC (Siegen, Germany). For all synthesis and purification steps, ultrapure water (18.2 MΩ, Milli-Q water purification system type ELIX 20; EMD Millipore, Billerica, MA, USA) was used. All procedures that involved the active ATTO-NHS ester were performed without moisture and light.
Fluorescently labeled SiO2 NPs were prepared as described before.Citation48 ATTO 647N was covalently incorporated into the SiO2 NP matrix by the introduction of a cysteic acid spacer to the dye followed by aminosilane coupling. After synthesis, the particles were purified by dialysis against Milli-Q water for 24 hours followed by filtration through a sterile 0.2 µm membrane.
Particle characterization
Size, size distribution, and morphology of the SiO2 NPs were analyzed by transmission electron microscopy (TEM). A diluted SiO2 NP dispersion was dried on a holey carbon-coated copper grid (type S147-4; Plano, Wetzlar, Germany) and imaged by TEM (JEOL JEM-2100 LaB6; JEOL, Tokyo, Japan) at 200 kV accelerating voltage. Micrographs with 1,024Citation2 pixels were acquired using an Orius SC1000 CCD camera (Gatan, Pleasanton, CA, USA) with 2× binning and an acquisition time of 0.5 seconds. The average primary particle size and particle size distribution were calculated using ImageJ software (National Institute of Health, Version: 1.45a; http://rsbweb.nih.gov/ij/). Therefore, TEM images were converted to 8-bit binary images after background subtraction and adjustment of brightness and contrast. Particle size, diameter, and shape were counted automatically. Dynamic light scattering (DLS, Nanotrac NPA 250; Microtrac GmbH, Krefeld, Germany) was used to determine the average hydrodynamic of NPs dispersed in water. The hydrodynamic diameter was also analyzed in culture medium (RPMI-1640 medium supplemented with 10% (v/v) FBS). After incubation of NP dispersion for 60 minutes in culture medium, SiO2 NPs were pelleted by centrifugation and resuspended in water. Measurements were performed at room temperature. Each sample was measured in triplicate (3×60 seconds per measurement). The diameter was determined by calculating the volume distribution. This was converted from the intensity size distribution using Mie theory. The zeta potential of the NPs in water was measured with a Zetasizer NanoZSP (Malvern Panalytical, Worcestershire, UK) at 150 V, using 0.01 M KCl as background electrolyte. In culture medium, the zeta potential was measured at 20 V. The SiO2 concentration of the SiO2 NP stock dispersion was analyzed by inductively coupled plasma optical emission spectrometry (ULTIMA 2; Horiba Jobin Yvon GmbH, Unterhaching, Germany). Dye labeling of particles was confirmed by fluorescence spectroscopy (Spex FluoroMax-3; Horiba Scientific GmbH, Oberursel, Germany) and UV-vis spectroscopy (Cary 5,000 spectrophotometer; Varian Inc., Darmstadt, Germany).
Stability tests by particle size measurements were performed using the DLS technique on a Microtrac Nanotrac NPA 250 (Microtrac GmbH, Krefeld, Germany). Prior to measurements, the samples were diluted 1:100 in water or culture medium, respectively. Then the samples were filtered through a 200 nm membrane filter into glass vials. The temperature was set to 25°C. Samples were irradiated with a semiconductor laser (HeNe laser: λ=633 nm [λ=780 nm]), and the intensity fluctuations of the scattered light, detected at a backscattering angle of 180°, was analyzed in automatic mode to obtain the autocorrelation function. The instrument software (Microtrac Flex 10.6.2) provided the particle size by using the cumulant analysis. The size distribution was provided by using a regularization scheme of number. All measurements were performed in triplicate. In addition, the following assumptions were made: the suspension viscosity (0.887) and refractive index (1.330) were assumed to be that of ultrapure water, corrected for temperature. A calculated value of 1.420 was used for the refractive index of the silica NPs with absorption of 0.010.
Stability tests by leaching experiments (fluorescence measurements) were performed at room temperature under ambient conditions using a spectrofluorometer Spex FluoroMax-3 from HORIBA Jobin Yvon (Oberursel, Germany). A xenon lamp with an excitation wavelength of 645 nm was used. The spectrum was recorded in a spectral range of 658–800 nm. The NP suspensions were diluted 1:100 in water or culture medium, respectively. Samples were placed in an open-sided 1-cm-path-length cuvette for the fluorescence measurements to obtain a control value. The diluted samples were also ultrafiltered through modified polyether sulfone membranes (molecular weight cut-off =30 kDa; Pall, Dreieich, Germany) by centrifugation (16,000 ×g, 15 minutes) to measure the leaching of dye molecules. All measurements were performed in triplicate.
Cell culture
The human hepatocellular carcinoma line HepG2 was obtained from the German Collection of Microorganisms and Cell Cultures (DSMZ, Braunschweig, Germany). Cells were maintained in RPMI-1640 medium supplemented with 10% (v/v) FBS (PAN-Biotech GmbH, Aidenbach, Germany). The cells were kept at 37°C in an incubator under humidified atmosphere with 5% CO2 and dislodged using Cellstripper (Corning, Wiesbaden, Germany).
3D liver microtissues
HepG2 cells were used to form 3D liver microtissues by the hanging drop method. After seeding of 1,000 cells in 40 µL culture medium per well in GravityPLUS™ plates (inSphero GmbH, Waldshut, Germany), they were kept at 37°C in an incubator under humidified atmosphere with 5% CO2. After 3 days the emerging cell spheroids were harvested and transferred into GravityTRAP™ plates followed by cultivation for a further 4 days. The size and form of HepG2 spheroids were evaluated by light microscopy (Zeiss Axiovert 25; Carl Zeiss Meditec AG, Jena, Germany). The cell number of single HepG2 spheroids was determined after cell separation by incubation with 5 mg mL−1 collagenase (Sigma-Aldrich Co.) for 2 hours at 37°C using an automatic cell counter (CASY® Modell TT; OLS OMNI Life Sciences, Bremen, Germany).
Exposure of 3D liver microtissues to SiO2 NPs
SiO2 NP dispersions were freshly prepared in complete cell culture medium. For cytotoxicity experiments, HepG2 spheroids were incubated with particle dispersions at a concentration of 1, 10, 100, or 200 µg mL−1 SiO2 for 24 hours. Exposure concentration for all microscopy experiments was 100 µg mL−1 SiO2 NPs. In these experiments, the exposure time was varied. HepG2 spheroids were exposed to SiO2 NPs 1) simultaneously to cell seeding, 2) during spheroid formation at the second day after cell seeding, or 3) after spheroid formation. In the end, the exposure time was 1) 7 days, 2) 5 days, or 3) 24 hours. Control samples were not exposed to SiO2 NPs. Also the localization of ATTO 647N-APTES dye conjugate in spheroids was analyzed. For this purpose, HepG2 spheroids were exposed to 0.83 µM ATTO 647N-APTES dye conjugate, either simultaneously to cell seeding or after spheroid formation.
Preparation of fixed stained spheroid samples for confocal microscopy
After incubation with and without SiO2 NPs, spheroids were washed and fixed with 4% paraformaldehyde in Dulbecco’s phosphate-buffered saline (DPBS; Thermo Fisher Scientific, Waltham, MA, USA), followed by embedding in CryoGlue medium (SLEE Medical, Mainz, Germany). To achieve consistent staining, cryosections of HepG2 spheroids were prepared. For this purpose, the embedded spheroids were frozen at −80°C for 1 hour. Subsequently, 10-µm-thick cryoslices were cut using a cryostat (MNT; SLEE Medical) and transferred to object slides (Paul Marienfeld GmbH & Co. KG, Lauda-Königshofen, Germany). For staining, samples were first washed in DPBS to remove the water-soluble embedding medium. Then, samples were permeabilized with 0.2% triton X-100 (Carl Roth GmbH + Co. KG, Karlsruhe, Germany) for 1 hour, washed in DPBS and blocked with 5% BSA (Sigma-Aldrich Co.) for 1 hour. For staining of F-actin, samples were incubated with 5 units/mL Alexa Fluor 488 phalloidin (Thermo Fisher Scientific) for 6 hours at room temperature. Cell nuclei were stained using Hoechst 33342 (Thermo Fisher Scientific) for 6 hours at room temperature. Multidrug resistance-associated protein (MRP2) was immunostained by incubation with the primary anti-MRP2 mouse monoclonal antibody (Abcam, Cambridge, UK) in 1% BSA at 4°C overnight. After washing with DPBS, the samples were further incubated with the secondary antibody Alexa Fluor 594 goat anti-mouse IgG (Thermo Fisher Scientific) for 6 hours at room temperature. Finally, the samples were mounted onto glass slides with Mowiol/DABCO (Sigma-Aldrich Co.).
Preparation of unfixed stained spheroid samples for light sheet microscopy
The formation of bile canaliculi was analyzed by staining non-fixed 3D HepG2 spheroids with cholyl-lysyl-fluorescein (CLF; Corning BV, Amsterdam, the Netherlands). CLF is a fluorescently labeled bile acid, which is mainly secreted into bile canaliculi by MRP2 expressed in the hepatic canalicular membrane.Citation49,Citation50 3D HepG2 spheroids were washed two times with DPBS and incubated with 50 µM CLF in DPBS for 1 hour at 37°C. Finally, the samples were mounted in a glass capillary with 1% agarose (Thermo Fisher Scientific).
Cell viability analysis of 3D HepG2 spheroids
Cell viability was microscopically analyzed by LIVE/DEAD staining. 3D HepG2 spheroids were washed with DPBS and stained with 30 µg mL−1 fluorescein diacetate (Sigma-Aldrich Co.) as a viability marker and 20 µg mL−1 propidium iodide (Sigma-Aldrich Co.) as a necrosis marker for 5 minutes at room temperature. After washing in DPBS, spheroids were imaged by fluorescence microscopy using GFP filter for fluorescein diacetate and Cy5 filter for propidium iodide (BZ-9000; Keyence, Neu-Isenburg, Germany).
Furthermore, the cell viability was tested by analyzing the redox potential of cells using the Resazurin assay. After NP exposure, 3D HepG2 spheroids were stained with 450 µM resazurin (Sigma-Aldrich Co.) diluted in cell culture medium. After incubation for 3 hours at 37°C fluorescence was measured at 590 nm using an excitation wavelength of 560 nm with a plate reader (Victor 3; PerkinElmer Inc., Waltham, MA, USA).
ROS measurements
The cellular production of ROS was measured using a luminescence-based ROS Glo Assay (Promega Corporation, Fitchburg, WI, USA). Therefore, exposure of HepG2 spheroids to test substances (SiO2, menadione) occurred simultaneously with incubation of a ROS Glo substrate. Menadione, which generates ROS by redox cycling,Citation51 was used as a positive control. After 24 hours, ROS Glo detection reagent was added for detection of luciferin. After incubation for 20 minutes luminescence was measured with a plate reader (SpectraMax; Molecular Devices LLC, Sunnyvale, CA, USA).
Confocal and two-photon microscopy
A CLS microscope Leica TCS-SP5 STED (Leica Microsystems, Wetzlar, Germany) using a Leica HCX PLAN APO 63x/1.4 oil immersion objective was used to generate images and z-stacks. Hoechst 33342 was imaged using an infrared laser (MaiTai; Spectra-Physics, Santa Clara, CA, USA) running at 750 nm for two-photon excitation and using internal analog photomultiplier detectors. Alexa Fluor 488 was imaged using an argon laser with 488 nm excitation laser line, while Alexa Fluor 594 was imaged using 561 nm DPSS laser and ATTO 647N with 633 nm laser. The confocal pinhole was set to 1 a.u. to optimize z-sectioning in confocal mode. Images were generated with a frame resolution of 4,096Citation2 pixels and scanning frequency of 200 Hz and were recorded sequentially. For z-stack a series of images with a z-step size of 0.3 µm were measured across the z-plane of the spheroid. The pixel size was set to 60 nm to avoid under-sampling. Images were processed by using the image processing software ImageJ to generate maximum intensity projections by applying maximum intensity.
Light sheet microscopy
Stained 3D HepG2 spheroids were analyzed by light sheet microscopy (Lightsheet Z.1; Carl Zeiss Meditec AG). Samples were analyzed using W Plan-Apochromat 20x/1.0 objective. For z-stack a series of images with a z-step size of 0.5 µm and frame resolution of 1,036 × 1,388 pixels were measured across the z-plane of the spheroid. By using the image processing software ImageJ, a maximum intensity projection of the z-stack was obtained by applying maximum intensity.
Scanning electron microscopy
Cryosections of HepG2 spheroids on glass were investigated by scanning electron microscopy (Quanta 400 FEG; FEI; Hillsboro, OR, USA) using backscattered electrons and a solid state detector at 10 kV accelerating voltage. Samples were imaged both in low vacuum mode at 100 Pa water vapor pressure without further sample preparation and in high vacuum mode after carbon coating for 5 seconds (JEOL JEC-530 Carbon Coater; Akishima, Tokyo, Japan).
Results
Physicochemical properties of fluorescently labeled SiO2 NPs
In this study, 3D liver microtissues were exposed to highly monodisperse SiO2 NPs. In order to investigate their localization within these spheroids by microscopy, the NPs were fluorescently labeled with ATTO 647N. The physicochemical properties of the SiO2 NPs are summarized in . The mean particle diameter determined from TEM micrographs was 99.2±2.5 nm. The hydrodynamic diameter of particles dispersed in water was 106±22 nm. These values indicate that SiO2 NPs are well dispersed.
Figure 1 Physicochemical properties of SiO2 NPs.
Notes: (A) Transmission electron micrographs of SiO2 NPs. (B) Size histogram of SiO2 NPs derived from TEM images. Dispersity (p) is calculated with the formula p = σ/µ, σ = SD; µ = mean value. Primary particle size (dTEM) of SiO2 NPs was calculated as 99.2±2.5 nm (2.5% dispersity). (C) Stability test by analysis of the particle diameter in water (0, 7 days) or culture medium (0, 1, 5, and 7 days). The mean hydrodynamic diameter (dh) from three independent experiments is presented with dispersity (SD). (D) Stability test by leaching analysis. Release of dye molecules from fluorescent SiO2 NPs was determined by fluorescence measurements before and after ultrafiltration through 30 kDa membrane. Fluorescence intensity (%) after 7 days was measured in water and culture medium. (E) Hydrodynamic diameter and zeta potential of SiO2 NPs in water and culture medium (RPMI-1640 supplemented with 10% FBS). dh was determined by calculating the volume distribution.
Abbreviations: NP, nanoparticle; TEM, transmission electron microscopy.
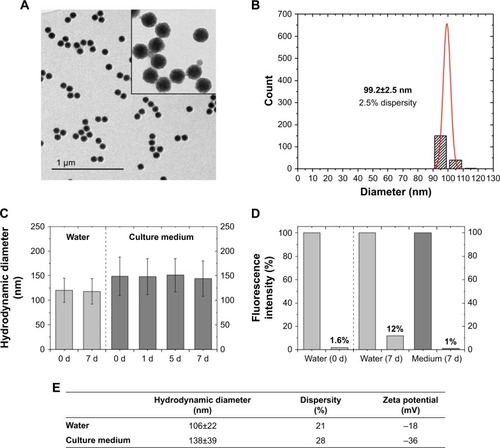
To study the agglomeration of particles under relevant biological conditions, the hydrodynamic diameter of SiO2 NPs was measured in culture medium. First, particles were dispersed in culture medium (RPMI-1640 medium supplemented with 10% [v/v] FBS) and later sedimented by centrifugation. After removal of the supernatant, the particles were suspended in water in order to remove free proteins, which would interfere with DLS and zeta potential measurements. It was observed that SiO2 NPs exhibited a slightly higher hydrodynamic diameter with 138±39 nm. The size increase can be assigned to the adsorption of serum proteins, for example, albumin, at the NP surface.Citation52–Citation54 The so-called protein corona suppresses agglomeration and stabilizes the NP dispersions.Citation55 Their dynamic composition potentially influences the cell–NP interaction affecting NP uptake and transport in cells.Citation52 Zeta potential measurements in water indicated that the NPs had a negative zeta potential of −18±1 mV. In the presence of culture medium, a lower absolute zeta potential value of −36±1 mV was determined. This value is indicative for an electrostatic stabilizing effect of medium containing serum proteins.
As the 3D liver microtissues were exposed to the fluorescently labeled SiO2 NPs for up to 7 days, the particle stability in water and culture medium was analyzed over the same period. The analysis comprised particle size measurements and dye leaching measurements. DLS measurements indicated that the particle dispersions were stable over 7 days, without exhibiting significant agglomeration.
Leaching experiments in water confirmed tight binding of the dye with only 1.6% of the total dye released at the start of the experiment (0 days). Within 7 days this amount increased to 12% at 7 days. After 7 days in cell culture medium, a leaching of 1% was detected.
Formation and characterization of 3D liver microtissues
Preformed three-dimensional liver microtissues can be used as an in vitro model to study NP toxicity and their tissue penetration. In order to gain insight into NP distribution during the process of tissue formation occurring in vivo during liver regeneration, the NP distribution was analyzed during the formation of microtissues. Therefore, HepG2 cells were exposed to NPs 1) at the beginning of spheroid formation simultaneously to cell seeding (day 0); 2) during spheroid formation on the second day after cell seeding (day 2); or 3) after the formation of spheroids (day 7). As a control, the formation of 3D liver microtissues in absence of NPs was studied.
For the formation of 3D liver microtissues, HepG2 cells (1,000 cells per well) were cultivated using the hanging drop method. The spheroid formation was analyzed at different times (day 1, 2, 4, and 7) after cell seeding (). Already at day 1 HepG2 spheroids with irregular shape were observed. At later times (day 4 and 7), the cell spheroids exhibited a round and more regular form. At day 4 the spheroid sizes were about 350 µm. The final spheroid size after 7 days of cultivation increased to about 390 µm. The cell number per spheroid, determined after cell separation by collagenase at day 3 and 7, indicated that cell proliferation continued until day 7 (). For further analysis the density of nuclei and packing density of the cells were studied using cross sections of HepG2 spheroids prepared at day 3 and 7. At day 3 spheroids exhibited a large number of holes with a size of 10–50 µm and lower density of nuclei compared to that at day 7, indicating spheroids at this early stage of spheroid formation are porous cell aggregates (). At day 7, the morphology of HepG2 spheroids was analyzed in more detail (). In order to test the formation of liver-specific bile canaliculi, tubular structures responsible for collecting bile from hepatocytes, HepG2 spheroids, were stained using CLF. This fluorescent bile acid derivative resembles naturally occurring cholylglycine and is mainly secreted into bile canaliculi by MRP2 expressed in the hepatic canalicular membrane.Citation49,Citation50 CLF staining was analyzed by lightsheet microscopy, revealing fluorescent patches over the entire HepG2 spheroid (). For further CLS microscopy analysis, slices of spheroids were prepared in order to perform efficient immunostaining of the whole cross section. Beside the nucleus and actin cytoskeleton, MRP2 was stained (). Transporter MRP2 was observed to co-localize with the actin cytoskeleton. It is known that actin filaments are associated with bile canaliculi membrane.Citation56 Furthermore, the spheroid possessed a dense structure with tightly packed cells indicated by a high density of nuclei (). Cell viability analysis showed viable cells over the whole spheroid, while dead cells were not detected (). In summary, 3D HepG2 spheroids formed by the hanging drop method are tightly packed cell aggregates that can serve as in vitro liver microtissues exhibiting liver-specific structures.
Figure 2 Spheroid morphology during formation.
Notes: The development of HepG2 spheroids was studied over time. After seeding of 1,000 HepG2 cells per well, images of spheroids were taken using bright-field microscopy at different days (day 1, 2, 4, and 7) after cell seeding. Scale bar indicates 100 µm.
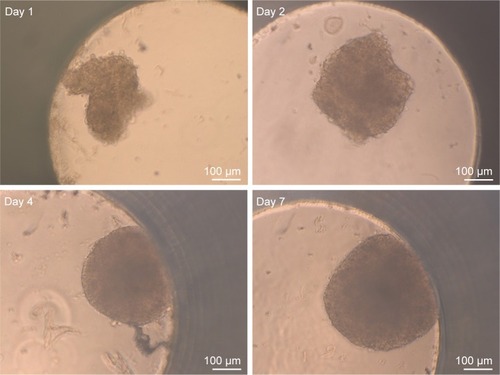
Figure 3 Morphology of HepG2 spheroids.
Notes: (A) Formation of bile canaliculi in HepG2 spheroids. Spheroids were stained for bile canaliculi at day 7 after cell seeding and analyzed by lightsheet microscopy. A maximum intensity projection was generated from a z-stack of representative spheroid. (B) CLS images of HepG2 spheroids. For imaging, spheroids were fixed, cut into 10-µm-thick cryoslices and stained for nucleus (yellow), actin cytoskeleton (green), and MRP-2 (gray), which is expressed in the canalicular membrane. One representative image of spheroid is shown. Red box indicates the detailed image position. A detailed image is shown on the right. Arrows indicate the localization of MRP2 (gray) in the micrograph.
Abbreviations: CLS, confocal laser scanning microscopy; MRP-2, multidrug resistance-associated protein2.
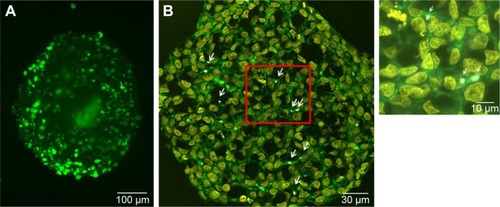
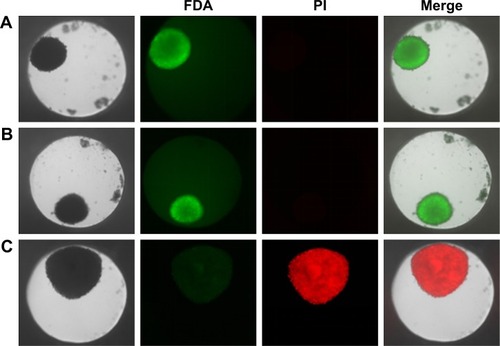
Figure 4 Cell viability of HepG2 spheroids.
Notes: Spheroids were stained with FDA (green) as viable marker and PI (red) as necrosis marker. Representative images of untreated cell spheroid (A), spheroid exposed to 100 µg mL−1 SiO2 NPs for 24 hours (B), and spheroid exposed to 1% triton X-100 for 1 hour (C) are shown. Beside the transmission image, the fluorescence images of the FDA and PI as well as the merged image of all channels are presented.
Abbreviations: FDA, fluorescein diacetate; NPs, nanoparticles; PI, propidium iodide.
Cytotoxicity of SiO2 NPs in 3D liver microtissues after their formation
Prior to the analysis of NP localization in 3D liver microtissues by microscopy, cytotoxicity studies served to exclude that the latter promoted or even enabled particle penetration. Therefore, cell viability and the formation of oxidative stress were analyzed using HepG2 spheroids exposed to SiO2 NPs after their formation. Viability was tested by LIVE/DEAD staining using fluorescein diacetate as a viability probe as well as propidium iodide as a probe for dead cells. In untreated spheroids dead cells were not observed (), indicating that cell viability is not influenced during that period of spheroid formation. Viability seemed to be not affected after exposure of spheroids to 100 µg mL−1 SiO2 NP for 24 hours ( and ). Viable cells stained by fluorescein were observed over the whole spheroid, while dead cells were not detected. To verify successful LIVE/DEAD staining, untreated spheroids were used as the negative control (LIVE) and triton X-100-exposed spheroids as the positive control (DEAD) ().
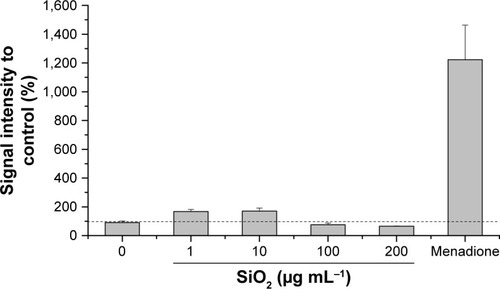
The oxidative stress level of HepG2 spheroids was measured using a luminescence-based ROS assay. Therefore, menadione was used as a positive control for ROS induction in cell experiments. Menadione is metabolized by cellular enzymes.Citation51 The resulting unstable product undergoes redox-cycling, which leads to ROS generation.Citation51,Citation57 The cellular oxidative stress was studied in the presence of varying SiO2 NP concentrations (). At lower SiO2 NP concentrations (1 and 10 µg mL−1 SiO2), the fluorescence intensity slightly increased to 167±15 a.u. (1 µg mL−1 SiO2) and 171±20 a.u. (10 µg mL−1 SiO2) in comparison with the untreated control (90±11 a.u.). Higher NP doses (100 and 200 µg mL−1 SiO2) did not affect fluorescence. Menadione, generating ROS by redox-cycling,Citation57 increased fluorescence to (1,222±214 a.u.).
Figure 5 Oxidative stress level of HepG2 spheroids.
Notes: Cellular oxidative stress of HepG2 spheroids was determined after exposure to varying concentrations of SiO2 NPs. Menadione was used as the positive control. Results are presented as mean ± SD from two independent experiments. Dashed line indicates control value (100%).
Abbreviation: NPs, nanoparticles.
Distribution of SiO2 NPs in 3D liver microtissues
In order to model penetration and distribution of SiO2 NPs in the already formed tissue, the localization of NPs was initially studied after formation of the spheroids. In this scenario, after seeding, HepG2 cells were cultivated using the hanging drop method for 7 days. Subsequently, the spheroids were exposed to 100 µg mL−1 SiO2 NPs for 24 hours. The samples were then prepared for microscopy. Preliminary experiments had shown that an efficient staining of the whole spheroid was only possible using low molecular probes. In contrast, staining of the whole spheroid, including the inner part, could not be achieved using fluorescently labeled antibodies. The antibodies only stained the outer few cell layers of the spheroids, even after permeabilization by triton X-100 (). In order to overcome this limitation, 10-µm-thick cryoslices of fixed spheroids were prepared and immunostained.
In order to determine the penetration of NPs, samples were stained using Hoechst 33342 (cell nuclei) and actin-cytoskeleton (phalloidin) and then analyzed by CLS microscopy (). SiO2 NPs were observed in the outer area, but not in the center of the spheroids. SiO2 NP agglomerates were detected up to a distance of 20 µm from the spheroid surfaces. In addition, at the surface of the cell spheroids, large accumulations of SiO2 NPs were localized, indicated by a strong fluorescence signal. In order to analyze the cellular localization of SiO2 NPs in the spheroids, the cell membranes were stained by wheat germ agglutinin. CLS imaging revealed that SiO2 NPs were present inside cells as well as membrane-associated (). As a control experiment, spheroids were exposed to the ATTO 647N-APTES dye conjugate after spheroid formation and localization and penetration depth was assessed (). The fluorescence of the dye conjugate was detected over the entire spheroid, indicating deep penetration of the dye conjugate. In contrast to the particles only weak and more widespread fluorescence was detected.
Figure 6 Distribution of SiO2 NPs in HepG2 spheroids after spheroid formation.
Notes: 100 µg mL−1 SiO2 NPs were applied 7 days after seeding for 24 hours. For imaging, spheroids were fixed and cut into 10-µm-thick cryoslices. Three independent experiments were performed. Representative images of the samples are shown. (A) CLS images of the spheroids. After preparation of cryoslices, samples were stained for CLS microscopy. The cell nucleus (yellow), cytoskeleton (green), and SiO2 NPs (magenta) are imaged. Red box indicates the detailed image position, which is derived from a maximum projection, shown on the right. (B) Back-scattered electron micrographs of the whole spheroid (left) and a detailed image (right) are shown. Red box indicates the detailed image position.
Abbreviations: CLS, confocal laser scanning microscopy; NPs, nanoparticles.
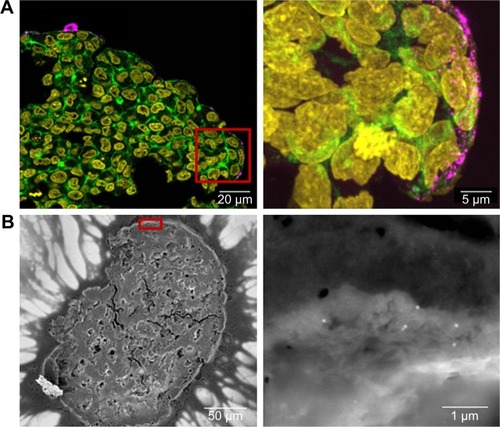
Through this analysis, it was found that due to the restricted resolution of conventional CLS microscopy, isolated NPs could not be differentiated from small NP agglomerates. For this reason, the NP distribution was further analyzed by scanning electron microscopy. This technique was also used to investigate whether the fluorescence signal could be attributed to labeled NPs instead of resulting from an artifact, for example, the presence of fluorophores released from the NPs. By scanning electron microscopy using cryoslices as samples, SiO2 NPs could be detected in HepG2 spheroids (). SiO2 NPs were observed in the outer region of the spheroids, but not in the center, corroborating the CLS microscopy results. Besides agglomerates, isolated SiO2 NPs were also detected at the spheroid border. The presence of SiO2 NPs in the spheroid could affect its composition and size, but the final spheroid size did not significantly change during exposure with SiO2 NPs ().
Distribution of SiO2 NPs applied during the formation of 3D liver microtissues
In order to analyze NP distribution during the formation of liver tissue as a model for liver regeneration, SiO2 NPs were applied at the beginning and during in vitro formation of 3D liver microtissues. In the first approach, HepG2 cells were seeded in the presence of 100 µg mL−1 SiO2 NPs (day 0). In the second scenario, HepG2 cells were first seeded and later 100 µg mL−1 SiO2 NPs were applied (day 2). In both the cases, the microscopy analysis was performed at day 7 after seeding. Accordingly, the cells were exposed to the NPs for 7 (day 0) or 5 (day 2) days, respectively. After fixation of the treated spheroids, cryoslices were prepared and stained as described above. The localization of NPs was analyzed by CLS microscopy and scanning electron microscopy.
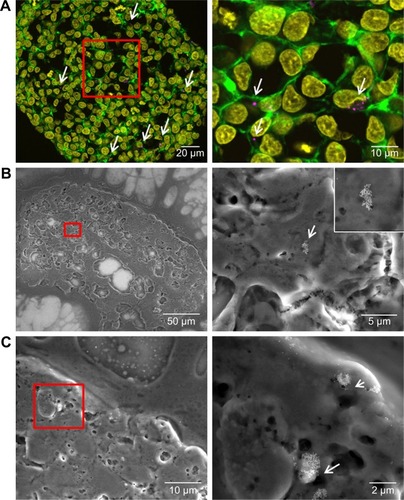
After the application of SiO2 NPs during cell seeding (day 0), at the beginning of microtissue formation, NPs were found to be distributed across the whole spheroid as revealed by CLS microscopy (). This finding was confirmed by SEM analysis, revealing separated NPs as well as micron-sized (up to 2–4 µm in size) SiO2 NP agglomerates in the spheroid center as well as attached to the outer rim of the spheroid ().
Figure 7 Distribution of SiO2 NPs in HepG2 spheroids added at the beginning of spheroid formation.
Notes: 100 µg mL−1 SiO2 NPs were applied at seeding day 0 for 7 days. For imaging, spheroids were fixed and cut into 10-µm-thick cryoslices. Representative images of the samples are shown. (A) CLS images of the spheroids. After preparation of cryoslices, samples were stained for CLS microscopy. The cell nucleus (yellow), cytoskeleton (green), and SiO2 NPs (magenta) are imaged. Red box indicates the detailed image position, which is derived from a maximum projection, shown on the right. (B, C) Backscattered electron micrographs of a spheroid overview (left) and a detailed image (right) are shown. Red box indicates the detailed image position. Arrows highlight the localization of SiO2 NPs in the spheroid.
Abbreviations: CLS, confocal laser scanning microscopy; NPs, nanoparticles.
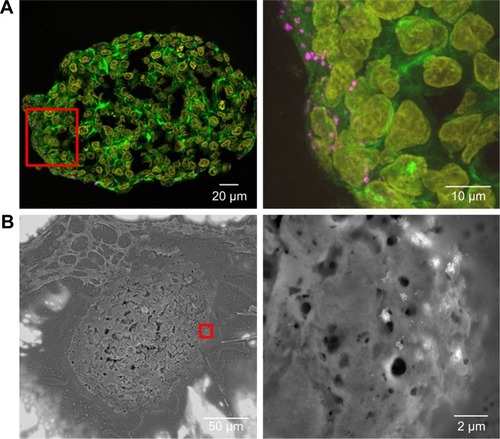
After the application of SiO2 NPs during more advanced spheroid formation at day 2 after cell seeding, NPs were not found in the center of HepG2 spheroids (). Under these conditions, SiO2 NPs were located in the outer rim of the spheroids. SiO2 NP agglomerates were located at a distance of up to 20 µm from the spheroid surfaces, corresponding to about three cell layers. Especially at the surface of the spheroids, SiO2 NP agglomerates of up to 2 µm were detected. Again, these results were confirmed by SEM, revealing the presence of 1–2 µm SiO2 NP agglomerates as well as separated SiO2 NPs in the outer rim of the spheroids but not in their center (). Analysis of the cellular localization of SiO2 NPs revealed that SiO2 NPs either resided inside of single cells or were membrane-associated (). Especially, the presence of SiO2 NPs during spheroid formation could alter the spheroid assembly. Here, the SiO2 NP administration did not affect the final spheroid size (). As control experiment spheroids were exposed to the ATTO 647N-APTES dye conjugate during spheroid formation at day 0 (). The dye penetration depth was investigated showing dye penetration into the spheroid center. Here, only weak and more widespread fluorescence was detected.
Figure 8 Distribution of SiO2 NPs in HepG2 spheroids during spheroid formation.
Notes: 100 µg mL−1 SiO2 NPs were applied at day 2 after seeding for 5 days. For imaging, spheroids were fixed and cut into 10-µm-thick cryoslices. Representative images of the samples are shown. (A) CLS images of the spheroids. After the preparation of cryoslices, samples were stained for CLS microscopy. The cell nucleus (yellow), cytoskeleton (green), and SiO2 NPs (magenta) are imaged. Red box indicates the detailed image position, which is derived from a maximum projection, shown on the right. (B) Back-scattered electron micrographs of a spheroid overview (left) and a detailed image (right) are shown. Red box indicates the detailed image position on the right.
Abbreviations: CLS, confocal laser scanning microscopy; NPs, nanoparticles.
Discussion
Development and characterization of 3D liver microtissues
For studying the NP penetration during and after tissue formation, 3D cultures of hepatocarcinoma cells (HepG2) were chosen as a model for 3D liver microtissues. HepG2 spheroids were produced using the hanging drop method. This scaffold-free 3D cell culture method enables the formation of homogenous reproducible spheroidsCitation32,Citation35 for use as in vitro model for hepatotoxicity screening. Furthermore the scaffold-free hanging drop technique is particularly suitable for studying direct NP–cell interactions in contrast to 3D cell culture methods by means of scaffolds or hydrogels where cells are embedded in a matrix.
The formation of HepG2 spheroids was studied for 7 days after cell seeding (). After initial formation of a loose cell aggregate a more tightly packed, round, and regular spheroid was formed. This conforms to other studies. For example, Kelm et al reported cell accumulation of HepG2 cells at the bottom of the drop after the first day, which ends up in a tightly packed spheroid by day 4.Citation58 Spheroid size increases from 400 µm (day 4) to 500 µm (day 7). Kelm et al also observed that the volume increase during spheroid formation reached a plateau with little or no growth after 10 days of cultivation.Citation58 Here, spheroid diameter increased only 40 µm from day 3 to day 7, resulting in a four times higher cell number of the spheroid (). The staining of cell nuclei in the HepG2 spheroid indicated its tight packing by high density of nuclei at day 7 (). At day 3 several micron-sized holes existed throughout the spheroid, indicating that the cell density with simultaneously low size increase during spheroid formation could be explained by the filling of the initial holes in the spheroids.
Due to their dense structure and micron scale size, spheroids exhibit an inherent gradient of nutrients, oxygen, and metabolites.Citation59 While nutrient levels (oxygen, ATP) decrease from the spheroid surface to its interior, the amount of catabolites (lactase, CO2) increases.Citation60 This influences cell physiology and cell proliferation activity differentially along the cross section of single spheroids. Accordingly, spheroids can be divided into regions of low and high proliferation activity. Spheroids consist of quiescent viable cells in the center and proliferating cells in the outer layers.Citation59 Däster et al even reported necrotic areas in large HT29 spheroids with diameters of ~500 µm.Citation61 Here, a necrotic core was not observed (), probably due to the smaller size of the spheroids and different cell type compared to the study of Däster et al.Citation61 It has also been described that cell seeding at high densities of up to 5–10,000 cells lowers cell proliferation, promoting loss of cell viability and formation of necrotic areas in HepG2 spheroids cultivated in the hanging drop system.Citation62 Here, lower cell numbers of HepG2 cells (1,000) were seeded, resulting in less diminution of the nutrient supply in the inner region of the spheroid.
For liver-specific characterization of liver microtissues, liver-like functions such as albumin secretion and CYP P450 activity or liver-specific structures are usually analyzed. Here, the final HepG2 spheroids were characterized morphologically, focusing on the liver-specific bile canaliculi. Hepatocytes secrete bile in these tubular structures located at their apical domain.Citation63 Transporter proteins such as MRP2 are located in the hepatic canalicular membrane.Citation49,Citation50 MRP2 mediates the secretion of dianionic conjugated bile salts into bile canaliculi.Citation64,Citation65 Here, bile canaliculi and the expression of the apical transporter MRP2 were detected (), indicating the formation of functional liver microtissues owing to liver-specific structures. These results are in accordance with the literature. Bile canalicular structures were also detected in HepG2 spheroids.Citation33,Citation58,Citation66 In contrast, formation of bile canaliculi and expression of the transporter MRP2 were not observed in 2D cultivated HepG2 cells,Citation33 revealing that 3D HepG2 cell cultures better serve as an in vitro liver model than their 2D cell culture.
Cytotoxicity of SiO2 NPs in 3D liver microtissues
SiO2 NPs can potentially be used for biosensing, drug delivery, and imaging.Citation45–Citation47 Besides their intended delivery into the human body, their potential adverse effects, fate, and distribution have to be considered. Therefore, this study analyzed the penetration of SiO2 NPs in HepG2 spheroids serving as an in vitro liver model. To exclude the potential toxicity of the particles to affect particle penetration, cell viability and formation of oxidative stress were studied. Although many in vitro studies focusing on NP-induced toxicity used 2D cultivated cells, recently 3D microtissues have been used in this context.Citation37,Citation39,Citation67 Nanosilica have been described to induce cellular oxidative stress and to cause inflammation and DNA damage leading to cell death in various 2D cell types.Citation68,Citation69 Landgraf et al reported only weak biological effects of SiO2 NPs on HepG2 cells.Citation70 In contrast, Schübbe et al and Peuschel et al described that SiO2 NPs, which were prepared by the same synthesis, cause neither damage of membrane integrity, reduction of metabolic activity nor DNA damage in A549 and Caco-2 cells.Citation71,Citation72 The contradictory results are due to differences in particle properties, cell type, and experimental conditions. SiO2 NPs that have been prepared by different synthesis methods vary in their shape, size, and porosity which might cause different biological effects.Citation73 Furthermore, the protein corona, consisting of proteins adsorbed at the NP surface, influences NP internalization and cytotoxicity.Citation71 The SiO2 NPs used in this study did not affect the viability of HepG2 spheroids (). Also Dubiak-Szepietowska et al reported no cytotoxicity of SiO2 NPs in HepG2 spheroids after 24 hours exposure.Citation34 Therefore, it can be concluded that in this study, cytotoxicity of SiO2 NPs did not affect particle penetration.
In a further cell experiment, the cellular oxidative stress was studied in the presence of varying SiO2 NP concentrations and ROS-induced menadione. At low SiO2 NP doses (1 and 10 µg mL−1), a slight increase was observed (), which might indicate induction of oxidative stress. Since higher SiO2 NP doses showed no effect, it can be reasoned that the applied SiO2 NPs for 24 hours do not cause cellular oxidative stress in HepG2 spheroids. While there is a lack of appropriate investigations in 3D culture systems, the cellular oxidative stress level of HepG2 cells grown in 2D monolayer after exposure of SiO2 NPs was studied. Lu et al reported a concentration-dependent increase of the ROS level and decrease of the glutathione level after incubation with amorphous SiO2 NPs with sizes of 7 and 20 nm for 24 hours.Citation74 Further investigations in 3D cell culture are necessary in order to prove the SiO2 NP potential for the induction of oxidative stress.
Penetration of SiO2 NPs in 3D liver microtissues
In order to investigate the NP distribution during and after the process of tissue formation, SiO2 NPs were exposed either after spheroid formation (day 7) or during spheroid formation (day 0, day 2). The NP localization was studied by confocal fluorescence microscopy and scanning electron microscopy. While in confocal fluorescence microscopy, cellular structures can specifically be identified by labeling, scanning electron microscopy enables the differentiation of single NPs.
When HepG2 spheroids were exposed to NPs after their formation, SiO2 NPs were found up to 20 µm from the border inside the spheroid occurring as single particles and particle agglomerates (). SiO2 NPs appeared internalized as well as membrane-associated (), indicating cellular uptake of SiO2 NPs. Until now, studies focused on the distribution of NPs in 3D cell spheroids, lacking investigation of their cellular localization. For the first time, the present study analyzed the penetration of SiO2 NPs in HepG2 spheroids. Other studies differ in applied particles, cell types, and applied detection techniques. Miyamoto et al reported the localization of positively charged magnetic iron oxide NPs in deeper layers inside HepG2 spheroids using TEM analysis.Citation38 In comparison with the present study, the spheroid size was considerably smaller with a diameter of about 50–100 µm. Internalized NPs were mainly localized in the lysosomes. Also Ulusoy et al studied NP interaction with spheroids after their formation.Citation75 Thereby, 3D cultivated human adipose-derived mesenchymal stem cells forming spheroids of 400–500 µm sizes were exposed to CdTe/CdS/ZnS quantum dots (Qdot) for 4 hours followed by the analysis of the NP adverse effects and localization. Fluorescence imaging showed that highest Qdot labeling occurred at peripheral regions.Citation75 Jarockyte et al observed that accumulation of Qdots does not depend on the size of NIH373 spheroids.Citation76 Qdots, applied for 24 hours after spheroid formation for 72 hours, only penetrated 3–4 cell layers into the spheroids with sizes of about 800 and 150 µm. This confirms our findings, localizing NPs only in the outer region of the spheroids.
For modeling of NP exposure during new tissue formation, SiO2 NPs were applied during HepG2 spheroid formation. In the case of SiO2 NPs applied at the initial cell seeding (day 0) for spheroid formation, NPs could be observed across the whole cross-section of spheroids (). Imaging by electron microscopy confirmed the NP distribution at the cell border as well as in the center of the HepG2 spheroids. In contrast, NPs applied at the beginning of spheroid formation (day 2) were localized only up to 20 µm from the border but not in the center of the HepG2 spheroids (). The differential distribution of SiO2 NPs in dependence of exposure time indicates that the presence of an extracellular matrix (ECM) affects NP localization in the spheroid. In contrast, spheroid formation and size are not significantly influenced in the presence of SiO2 NPs (). This could also result from the lacking cytotoxicity of SiO2 NPs ( and ). Other particle types were described to affect spheroid formation in dependence of their biological activity. Ulusoy et al studied the effect of Qdots after introduction at the beginning or after stem cell spheroid formation.Citation75 Morphological changes of spheroids were observed at Qdot doses .300 µg mL−1 when administered at the beginning of spheroid formation, but not after spheroid formation. Ulusoy et al suggested that NPs applied at the beginning of spheroid formation were not protected by ECM at toxic doses.Citation75 Impaired cell–cell/cell–ECM interactions and decreased cell viability caused loss of ability to form cell aggregates.Citation75 The distribution of NPs in the spheroid was not studied. Also Sambale et al investigated the morphology of spheroids during their formation in the presence of NPs.Citation77 In that study, the administration of increasing noncytotoxic concentrations of TiO2 NPs caused the formation of larger numbers of spheroids per well besides formation of smaller spheroids.Citation77 In contrast, after application of cytotoxic doses of ZnO NPs, the diameter of the spheroid was observed to increase due to lowered cell–cell interactions.Citation77 The present study is the first describing the distribution of NPs in liverlike spheroids after spheroid formation and at two different time points during spheroid formation. In both the exposure scenarios during spheroid formation, single NPs as well as µm-sized NP agglomerates were detected by CLS and electron microscopy. SiO2 NPs applied after spheroid formation were mainly detected as NP agglomerates near the spheroid border, and SiO2 NPs applied at cell seeding were observed as agglomerates even in the central region of the spheroid. NP agglomerates in the spheroid interior could result from embedding of NPs in the ECM during spheroid formation. Agglomeration of SiO2 NPs dispersed in the surrounding cell culture medium can be neglected because the zeta potential of SiO2 NPs in culture medium indicated very high particle stability and DLS measurements did not reveal a huge hydrodynamic particle size (). However, NP agglomeration due to adsorption on the cell surface or in the ECM could be possible. Furthermore, the penetration of NP agglomerates into the interior of the spheroids is unlikely due to their micron size. Agarwal et al reported that 500 nm polystyrene beads were less taken up by HEK spheroids compared to 100 and 200 nm polystyrene beads.Citation40 This size-dependent effect might indicate that penetration of micron-sized particle agglomerates into spheroids is excluded, because larger NPs and NP agglomerates encounter diffusion limitation in the ECM.
The limited NP penetration in preformed spheroids is the result of various barriers within the microtissues. The cell density and presence of tight junctions inside the spheroid can affect NP penetration into the cell spheroid. Higher cell density can limit NP distribution into central regions of the spheroids due to a smaller intercellular region. Besides that a high density of ECM can affect NP diffusion. It has been described that NP penetration in multicellular spheroids can be increased by collagenase treatment.Citation78 Fibrous collagen is a component of ECM. Goodman et al reported the transport of fluorescently labeled polystyrene beads into spheroids with human cervical carcinoma cells. In untreated spheroids the NPs remain in the outer layer, while collagenase treatment increased delivery efficiency of NPs.Citation78 Furthermore, the NP size affected their distribution in collagenase-treated spheroids, the transport in the inner spheroid core was low for 100 and 200 nm NPs compared to that for 20-and 40-nm-sized polystyrene beads.Citation78 This size-dependent NP penetration might be the reason for the restricted penetration of the SiO2 NPs with a primary particle size of about 100 nm in our study (). Another factor for limited penetration of NPs into the spheroid interior might be the varying cell proliferation activity across the spheroid structure. Due to an inherent gradient of nutrient, spheroids consist of quiescent viable cells in the center and proliferating cells in the outer layers of the spheroid.Citation59 Therefore, spheroid growth is mainly carried out by an increase in the cell number of proliferative cells in the outer rim of spheroids. Agarwal et al investigated whether NP distribution is caused by cell formation around the existing particles and are therefore included into the spheroids.Citation40 Uptake of polystyrene beads was studied in HEK 293 (human embryonic kidney) spheroids by treatment with mitomycin C which causes cell cycle arrest in the S phase.Citation79 The results indicated that NP penetration is not due to spheroid growth around particles.Citation40 Here, due to ongoing cell proliferation in HepG2 spheroids, the spheroid growth around particles could be possible. However, our study first observed an internalization of SiO2 NPs into HepG2 cells of spheroids (). Uptake of SiO2 NPs in 2D cultivated HepG2 cells is known.Citation70 Therefore, as a mechanism of NP penetration, uptake and transport between proliferation-active cells might be possible, which is diminished in the spheroid center where quiescent cells are present.
The knowledge about NP penetration and presence in tissues is important for understanding the adverse effects and mode of action of NPs. In biomedical applications, the distribution of drug-loaded NPs into target tissue is a relevant issue for their specific release and therapeutic efficiency. Especially for nanomedicines, biological barriers hinder effective penetration of NPs into the tumor tissue.Citation80 Therefore, several approaches have been developed to modulate the tumor microenvironment or alter the physicochemical properties of nanomedicines for enhancing their tumor penetration.Citation80,Citation81
For nanotoxicity assessment the 3D spheroids offer a promising tool since it mimics the in vivo tissue environment. Besides a study of the adverse effects of NPs, it enables the analysis of tissue penetration of NPs. Due to the limited NP penetration, the cellular impact of NPs is solely for small cell fraction at the outer rim of the cell spheroid. However, 3D spheroids provide a good in vitro cell model since limited penetration was also described in tumor tissue.
Conclusions
In conclusion, we demonstrate a comprehensive microscopic analysis of SiO2 NP penetration and cellular localization in HepG2 spheroids. We show that the time point of SiO2 NP exposure affects their penetration in HepG2 spheroids. SiO2 NPs applied after spheroid formation were distributed in the outer rim of the spheroid occurring as single NPs and particle agglomerates. The same penetration was observed for SiO2 NPs applied on day 2 at the beginning of spheroid formation. In contrast, application of NPs simultaneously with cell seeding led to the distribution of micron-sized particle agglomerates both in the center and the periphery of HepG2 spheroids.
This study provides new information on the effect and penetration of SiO2 NPs in HepG2 spheroids, the role of NP exposure in different phases of spheroid formation, and limitations of NP penetration in cellular spheroids.
Data sharing statement
The data sets supporting the conclusion of this article are included within the article and its additional files. Data will not be shared through a general repository due to the very large size of the microscopy data.
Author contributions
JF, HP, and AK designed the study. JF and HP performed microscopy imaging and analysis. JS carried out cell viability and oxidative stress experiments. MK performed electron microscopy investigations. IT participated in particle synthesis and characterization. All authors contributed to data analysis, drafting and revising the article, gave final approval of the version to be published, and agree to be accountable for all aspects of the work.
Acknowledgments
The authors would like to thank Anika Krieger for the particle synthesis and characterization as well as Dominique Piché for the review of the final paper. The authors thank Eduard Arzt for continuing support of their work at INM. The publication of this article was funded by the Open Access Fund of the Leibniz Association. The work was funded by the German Federal Ministry for Economic Affairs and Energy, in the framework of the Zentrale Innovationsprogramm Mittelstand (ZIM)-cooperation network NanoPharm in the project ‘MORPHEUS’.
Supplementary materials
Figure S1 Packing density of HepG2 spheroids at day 3 and 7.
Notes: Several HepG2 spheroids were analyzed at day 3 (left) or day 7 (right) after seeding of 1,000 cells per well. In representative confocal fluorescence micrographs the cell membrane (green) and cell nucleus (cyan) are presented. Exemplarily overview images of the whole spheroids are shown.
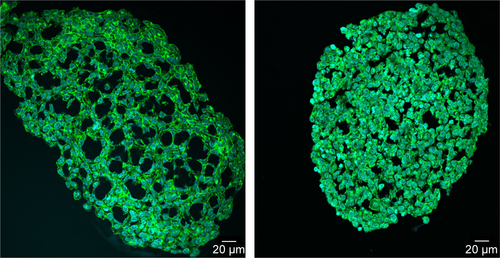
Figure S2 Cell viability of HepG2 spheroids in the presence of SiO2 NPs.
Notes: After their formation, HepG2 spheroids were incubated with varying SiO2 NP concentrations (1, 10, 100, 200 µg mL−1) for 24 hours. Cell viability was determined by Resazurin assay. Results are presented as mean ± SD from three independent experiments. Dashed line indicates control value (100%).
Abbreviation: NPs, nanoparticles.
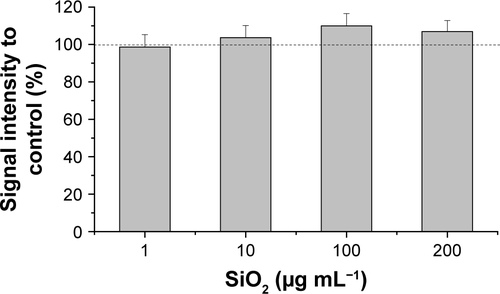
Figure S3 Immunostaining of whole HepG2 spheroid.
Notes: Prior to staining, HepG2 spheroid was permeabilized with triton X-100 for 30 minutes at room temperature. After blocking with 5% BSA, the sample was immunostained for nuclear lamina (Lamin B). Embedding of the spheroid under a cover slide resulted in a flattened form. Confocal image of HepG2 spheroid immunostained for nuclear lamina is depicted in yellow. Orthogonal views (xy, xz, and yz) showing the intersection planes at the position of the green cross-hair.
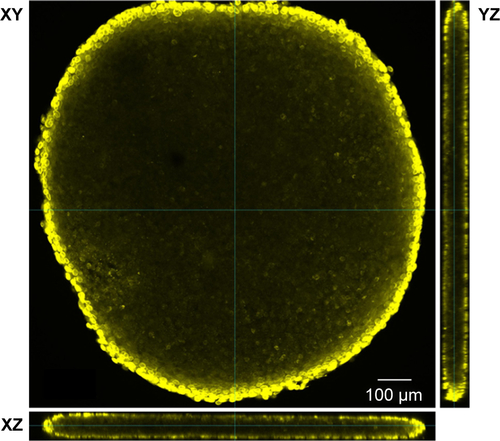
Figure S4 Nanoparticle localization in spheroids.
Notes: HepG2 spheroids were exposed to 100 µg mL−1 SiO2 NPs either after spheroid formation (A) or during spheroid formation at day 0 (B) or day 2 (C). In representative confocal fluorescence micrographs, the cell membrane (green) and SiO2 NPs (magenta) are presented. Overview images of the whole spheroid (left) are shown. White frame indicates the position of the detailed z-stacks. Exemplary, orthogonal views (xy, xz, yz) were derived from z-stacks at a selected layer. Arrows highlight the localization of SiO2 NPs in the spheroid.
Abbreviation: NPs, nanoparticles.
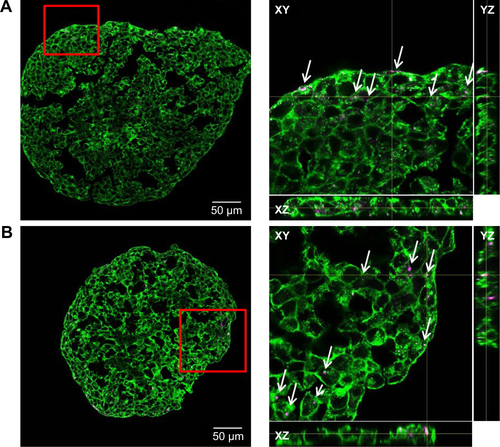
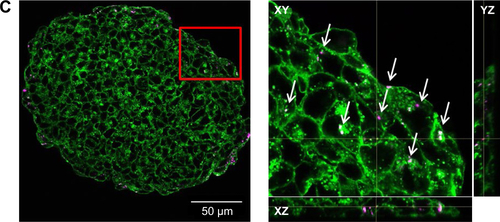
Figure S5 Localization of ATTO 647N-APTES dye conjugate in spheroids.
Notes: HepG2 spheroids were exposed to 0.83 µM ATTO 647N-APTES dye conjugate after spheroid formation (A) or during spheroid formation at day 0 (B). In representative confocal fluorescence micrographs, the actin cytoskeleton (green, left) or ATTO 647N-APTES dye conjugate (magenta, right) are presented.
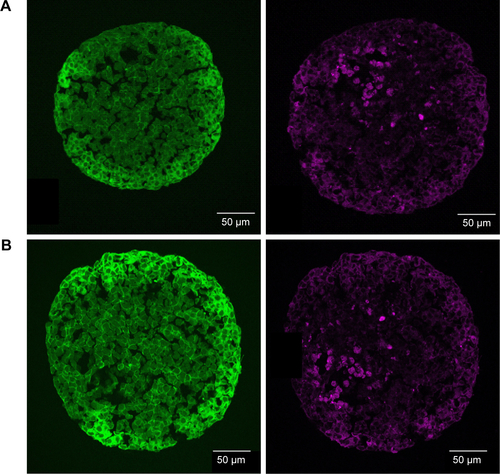
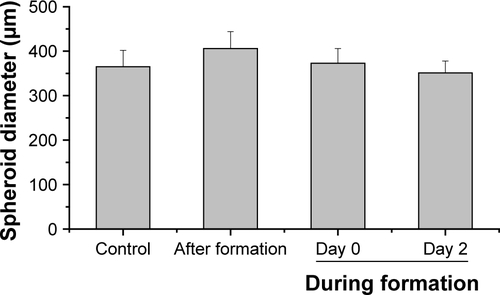
Figure S6 Spheroid diameter in dependence of the silica nanoparticle exposure scenario.
Notes: HepG2 spheroids were either untreated or exposed to 100 µg mL−1 SiO2 NPs either after spheroid formation or during spheroid formation (day 0, day 2). Spheroid diameter was determined for five spheroids (n=5). Results are presented as mean + SD.
Abbreviation: NPs, nanoparticles.
Disclosure
The authors report no conflicts of interest in this work.
References
- MoutRMoyanoDFRanaSRotelloVMSurface functionalization of nanoparticles for nanomedicineChem Soc Rev20124172539254422310807
- SmijsTGPavelSTitanium dioxide and zinc oxide nanoparticles in sunscreens: focus on their safety and effectivenessNanotechnol Sci Appl201149511224198489
- DekkersSKrystekPPetersRJPresence and risks of nanosilica in food productsNanotoxicology20115339340520868236
- NelAXiaTMädlerLLiNToxic potential of materials at the nano-levelScience2006311576162262716456071
- OberdörsterGOberdörsterEOberdörsterJNanotoxicology: an emerging discipline evolving from studies of ultrafine particlesEnviron Health Perspect2005113782383916002369
- StrizhakPENanosize effects in heterogeneous catalysisTheor Exp Chem2013491221
- GottschalkFNowackBThe release of engineered nanomaterials to the environmentJ Environ Monit20111351145115521387066
- KrugHFNanosafety research – are we on the right track?Angew Chem Int Ed Engl20145346123041231925302857
- LewinskiNColvinVDrezekRCytotoxicity of nanoparticlesSmall200841264918165959
- NelAEMädlerLVelegolDUnderstanding biophysicochemical interactions at the nano-bio interfaceNat Mater20098754355719525947
- LynchIWeissCValsami-JonesEA strategy for grouping of nanomaterials based on key physico-chemical descriptors as a basis for safer-by-design NMSNano Today201493266270
- KimJPiaoYHyeonTMultifunctional nanostructured materials for multimodal imaging, and simultaneous imaging and therapyChem Soc Rev200938237239019169455
- De JongWHHagensWIKrystekPBurgerMCSipsAJGeertsmaREParticle size-dependent organ distribution of gold nanoparticles after intravenous administrationBiomaterials200829121912191918242692
- Garza-OcañasLFerrerDABurtJBiodistribution and long-term fate of silver nanoparticles functionalized with bovine serum albumin in ratsMetallomics20102320421021069158
- NiidomeTYamagataMOkamotoYPEG-modified gold nanorods with a stealth character for in vivo applicationsJ Control Release2006114334334716876898
- van KesterenPCCubaddaFBouwmeesterHNovel insights into the risk assessment of the nanomaterial synthetic amorphous silica, additive E551, in foodNanotoxicology20159444245225033893
- ParkJKUtsumiTSeoYECellular distribution of injected PLGA-nanoparticles in the liverNanomedicine20161251365137426961463
- KreylingWGHolzwarthUHaberlNQuantitative biokinetics of titanium dioxide nanoparticles after intravenous injection in rats: Part 1Nanotoxicology201711443444228290717
- ZhangYNPoonWTavaresAJMcgilvrayIDChanWCNanoparticle-liver interactions: cellular uptake and hepatobiliary eliminationJ Control Release201624033234826774224
- TreftsEGannonMWassermanDHThe liverCurr Biol20172721R1147R115129112863
- AnzenbacherPAnzenbacherováECytochromes P450 and metabolism of xenobioticsCell Mol Life Sci2001585–673774711437235
- TaubRLiver regeneration: from myth to mechanismNat Rev Mol Cell Biol200451083684715459664
- FaustoNLiver regenerationJ Hepatol2000321 Suppl1931
- MichalopoulosGKLiver regenerationJ Cell Physiol2007213228630017559071
- MichalopoulosGKDefrancesMLiver regenerationAdv Biochem Eng Biotechnol20059310113415791946
- PawlowskiRJuraJALR and liver regenerationMol Cell Biochem20062881–215916916691313
- LuckertCSchulzCLehmannNComparative analysis of 3D culture methods on human HepG2 cellsArch Toxicol201791139340626872951
- GodoyPHewittNJAlbrechtURecent advances in 2D and 3D in vitro systems using primary hepatocytes, alternative hepatocyte sources and non-parenchymal liver cells and their use in investigating mechanisms of hepatotoxicity, cell signaling and ADMEArch Toxicol20138781315153023974980
- MessnerSAgarkovaIMoritzWKelmJMMulti-cell type human liver microtissues for hepatotoxicity testingArch Toxicol201387120921323143619
- PampaloniFReynaudEGStelzerEHThe third dimension bridges the gap between cell culture and live tissueNat Rev Mol Cell Biol200781083984517684528
- LoessnerDStokKSLutolfMPHutmacherDWClementsJARizziSCBioengineered 3D platform to explore cell-ECM interactions and drug resistance of epithelial ovarian cancer cellsBiomaterials201031328494850620709389
- CostaECMoreiraAFde Melo-DiogoDGasparVMCarvalhoMPCorreiaIJ3D tumor spheroids: an overview on the tools and techniques used for their analysisBiotechnol Adv20163481427144127845258
- RamaiahgariSCden BraverMWHerpersBA 3D in vitro model of differentiated HepG2 cell spheroids with improved liver-like properties for repeated dose high-throughput toxicity studiesArch Toxicol20148851083109524599296
- Dubiak-SzepietowskaMKarczmarczykAJönsson-NiedziółkaMWincklerTFellerKHDevelopment of complex-shaped liver multicellular spheroids as a human-based model for nanoparticle toxicity assessment in vitroToxicol Appl Pharmacol2016294788526825373
- TimminsNEHardingFJSmartCBrownMANielsenLKMethod for the generation and cultivation of functional three-dimensional mammary constructs without exogenous extracellular matrixCell Tissue Res2005320120721015714278
- KermanizadehALøhrMRoursgaardMHepatic toxicology following single and multiple exposure of engineered nanomaterials utilising a novel primary human 3D liver microtissue modelPart Fibre Toxicol201411111524382024
- LeeJLillyGDDotyRCPodsiadloPKotovNAIn vitro toxicity testing of nanoparticles in 3D cell cultureSmall20095101213122119263430
- MiyamotoYKoshidakaYNoguchiHObservation of positively charged magnetic nanoparticles inside HepG2 spheroids using electron microscopyCell Med201352–3899626858871
- SenyavinaNVGerasimenkoTNPulkovaNVMaltsevaDVTransport and toxicity of silver nanoparticles in HepaRG cell spheroidsBull Exp Biol Med2016160683183427160885
- AgarwalRJurneyPRaythathaMEffect of shape, size, and aspect ratio on nanoparticle penetration and distribution inside solid tissues using 3D spheroid modelsAdv Healthc Mater20154152269228026376024
- HuangKMaHLiuJSize-dependent localization and penetration of ultrasmall gold nanoparticles in cancer cells, multicellular spheroids, and tumors in vivoACS Nano2012654483449322540892
- ZhaoJLuHWongSLuMXiaoPStenzelMHInfluence of nanoparticle shapes on cellular uptake of paclitaxel loaded nanoparticles in 2D and 3D cancer modelsPolym Chem201782133173326
- GaoYLiMChenBPredictive models of diffusive nanoparticle transport in 3-dimensional tumor cell spheroidsAAPS J201315381683123605950
- GoodmanTTChenJMatveevKPunSHSpatio-temporal modeling of nanoparticle delivery to multicellular tumor spheroidsBiotechnol Bioeng2008101238839918500767
- ChenNTChengSHLiuCPRecent advances in nanoparticle-based Förster resonance energy transfer for biosensing, molecular imaging and drug release profilingInt J Mol Sci20121312165981662323443121
- CaiZYeZYangXEncapsulated enhanced green fluorescence protein in silica nanoparticle for cellular imagingNanoscale2011351974197621369623
- YagüeCMorosMGrazúVArrueboMSantamaríaJSynthesis and stealthing study of bare and PEGylated silica micro-and nanoparticles as potential drug-delivery vectorsChem Eng J200813714553
- TavernaroICaveliusCPeuschelHKraegelohABright fluorescent silica-nanoparticle probes for high-resolution STED and confocal microscopyBeilstein J Nanotechnol201781283129628690964
- BarberJAStahlSHSummersCQuantification of drug-induced inhibition of canalicular Cholyl-l-Lysyl-Fluorescein excretion from hepatocytes by high content cell imagingToxicol Sci20151481485926220638
- KönigJNiesATCuiYLeierIKepplerDConjugate export pumps of the multidrug resistance protein (MRP) family: Localization, substrate specificity, and MRP2-mediated drug resistanceBiochim Biophys Acta19991461237739410581368
- CriddleDNGilliesSBaumgartner-WilsonHKMenadione-induced reactive oxygen species generation via redox cycling promotes apoptosis of murine pancreatic acinar cellsJ Biol Chem200628152404854049217088248
- LynchIDawsonKAProtein-nanoparticle interactionsNano Today200831–24047
- LundqvistMStiglerJEliaGLynchICedervallTDawsonKANanoparticle size and surface properties determine the protein corona with possible implications for biological impactsProc Natl Acad Sci U S A200810538142651427018809927
- CedervallTLynchILindmanSUnderstanding the nanoparticle-protein corona using methods to quantify exchange rates and affinities of proteins for nanoparticlesProc Natl Acad Sci U S A200710472050205517267609
- JiangJOberdörsterGBiswasPCharacterization of size, surface charge, and agglomeration state of nanoparticle dispersions for toxicological studiesJ Nanoparticle Res20091117789
- TsukadaNAckerleyCAPhillipsMJThe structure and organization of the bile canalicular cytoskeleton with special reference to actin and actin-binding proteinsHepatology1995214110611137705786
- BellomoGMirabelliFVairettiMIosiFMalorniWCytoskeleton as a target in menadione-induced oxidative stress in cultured mammalian cells. I. Biochemical and immunocytochemical featuresJ Cell Physiol199014311181282318902
- KelmJMTimminsNEBrownCJFusseneggerMNielsenLKMethod for generation of homogeneous multicellular tumor spheroids applicable to a wide variety of cell typesBiotechnol Bioeng200383217318012768623
- MehtaGHsiaoAYIngramMLukerGDTakayamaSOpportunities and challenges for use of tumor spheroids as models to test drug delivery and efficacyJ Control Release2012164219220422613880
- WareMJColbertKKeshishianVGeneration of homogenous three-dimensional pancreatic cancer cell spheroids using an improved hanging drop techniqueTissue Eng Part C Methods201622431232126830354
- DästerSAmatrudaNCalabreseDInduction of hypoxia and necrosis in multicellular tumor spheroids is associated with resistance to chemotherapy treatmentOncotarget2017811725173627965457
- ShahUKMalliaJOSinghNChapmanKEDoakSHJenkinsGJSA three-dimensional in vitro HepG2 cells liver spheroid model for genotoxicity studiesMutat Res2018825515829307375
- AriasIMCheMGatmaitanZLeveilleCNishidaTSt PierreMThe biology of the bile canaliculusHepatology19931723183298428731
- CantzTNiesATBromMHofmannAFKepplerDMRP2, a human conjugate export pump, is present and transports fluo 3 into apical vacuoles of HepG2 cellsAm J Physiol Gastrointest Liver Physiol20002784G522G53110762605
- MeierPJStiegerBBile salt transportersAnnu Rev Physiol200264163566111826283
- MuellerDKoetemannANoorFOrganotypic cultures of HepG2 cells for in vitro toxicity studiesJ Bioeng Biomed Sci20111S2110
- LuoYWangCHossainMThree-dimensional microtissue assay for high-throughput cytotoxicity of nanoparticlesAnal Chem201284156731673822747067
- LuXQianJZhouHIn vitro cytotoxicity and induction of apoptosis by silica nanoparticles in human HepG2 hepatoma cellsInt J Nanomedicine201161889190121931484
- SahuDVijayaraghavanRKannanGMSilica nanoparticle induces oxidative stress and provokes inflammation in human lung cellsJ Exp Nanosci201510139831000
- LandgrafLNordmeyerDSchmielPValidation of weak biological effects by round Robin experiments: cytotoxicity/biocompatibility of SiO2 and polymer nanoparticles in HepG2 cellsSci Rep20177111028127051
- PeuschelHRuckelshausenTCaveliusCKraegelohAQuantification of internalized silica nanoparticles via STED microscopyBiomed Res Int201520151116
- SchübbeSCaveliusCSchumannCKochMKraegelohASTED microscopy to monitor agglomeration of silica particles inside A549 cellsAdv Eng Mater2010125417422
- NapierskaDThomassenLCLisonDMartensJAHoetPHThe nanosilica hazard: another variable entityPart Fibre Toxicol2010713921126379
- LuXQianJZhouHIn vitro cytotoxicity and induction of apoptosis by silica nanoparticles in human HepG2 hepatoma cellsInt J Nanomedicine201161889190121931484
- UlusoyMLavrentievaAWalterJGEvaluation of CdTe/CdS/ZnS core/shell/shell quantum dot toxicity on three-dimensional spheroid culturesToxicol Res201651126135
- JarockyteGDapkuteDKarabanovasVDaugmaudisJVIvanauskasFRotomskisR3D cellular spheroids as tools for understanding carboxylated quantum dot behavior in tumorsBiochim Biophys Acta Gen Subj20181862491492329288773
- SambaleFLavrentievaAStahlFThree dimensional spheroid cell culture for nanoparticle safety testingJ Biotechnol201520512012925595712
- GoodmanTTOlivePLPunSHIncreased nanoparticle penetration in collagenase-treated multicellular spheroidsInt J Nanomedicine20072226527417722554
- SekiYTobaKFuseIIn vitro effect of cyclosporin A, mitomycin C and prednisolone on cell kinetics in cultured human umbilical vein endothelial cellsThromb Res2005115321922815617745
- SunQOjhaTKiesslingFLammersTShiYEnhancing tumor penetration of nanomedicinesBiomacromolecules20171851449145928328191
- TongRLangerRNanomedicines targeting the tumor microenvironmentCancer J201521431432126222084