
Abstract
Background
Yttria-stabilized zirconia (Y2O3/ZrO2) nanoparticles are one of the important nanoparticles extensively used in manufacturing of plastics, textiles, catalyst, etc. Still, the cytotoxic and apoptotic effects of yttria-stabilized zirconia nanoparticles have not been well identified on human skin keratinocyte (HaCaT) cells. Therefore, in this study, we have designed to examine the cytotoxic potential of yttria-stabilized zirconia nanoparticles in HaCaT cells.
Methods
Prior to treatment, the yttria-stabilized zirconia nanoparticles were characterized by using different advanced instruments viz. dynamic light scattering (DLS), scanning electron microscope (SEM) and transmission electron microscope (TEM). Cell viability of HaCaT cells was measured by using MTS and NRU assays and viability of cells was reduced in a dose- and time-dependent manner.
Results
Reduction in the viability of cells was correlated with the rise of reactive oxygen species generation, increased caspase-3, mitochondria membrane potential and evidence of DNA strand breakage. These were consistent with the possibility that mitochondria damage can play a significant role in the cytotoxic response. Moreover, the activity of oxidative enzymes such as lipid peroxide (LPO) was increased and glutathione was reduced in HaCaT cells exposed with yttria-stabilized zirconia nanoparticles. It is also important to indicate that HaCaT cells appear to be more susceptible to yttria-stabilized zirconia nanoparticles exposure after 24 hrs.
Conclusion
This result provides a dose- and time-dependent apoptosis and genotoxicity of yttria-stabilized zirconia nanoparticles in HaCaT cells.
Introduction
Nanoparticles have opened new opportunities for applications in a variety of fields, such as biomedical, environmental, chemical industry, agriculture, cosmetics and medicine.Citation1–Citation3 In recent years, usage of zirconium dioxide nanoparticles is rapidly growing in biological fields. They are widely used in bone cement and as drug delivery carriers for some medicines like itraconazole, penicillin, alendronate and zoledronate.Citation4,Citation5 As one of the rare earth nanomaterials, yttrium oxide nanoparticles have attracted much attention due to their excellent qualities such as high refractive index and high thermal stability.Citation6 Therefore, a non-metal oxide, Y2O3 nanoparticles have numerous applications in chemical synthesis, mechanical polishing and as additives to drugs, cosmetics, varnishes and food. Y2O3 nanoparticles are gaining interest for application in photodynamic therapy and biological imaging of cancerous cells.Citation7–Citation9 Also, Gao et al (2019)Citation10 have reported that bone marrow tissue was damaged by Y2O3 nanoparticles’ exposure. Liu et alCitation11 have reported that rare earth nanoparticles can be transported in the human body and deposited in mice bone.
Sadeghnia et alCitation12 documented that excessive generation of reactive oxygen species (ROS) induced DNA strand breakage, damaging cellular macromolecules (proteins, fat, carbohydrate) and apoptosis in cells. Human skin keratinocyte (HaCaT) cells originated from skin epidermal layer and act as the outermost layer of the skin.Citation13 The human skin cells are sensitive to oxidative stress due to their metabolic activity. Tissue and cellular damage may be caused by high production of ROS in inflammatory disease.Citation14 Superoxide (O2) and hydrogen peroxide (H2O2) can produce more reactive species like hydroxyl radical, hypochlorous acid and singlet oxygen which can damage the components of the extracellular matrix.Citation15 Agarwal et alCitation16 reported that more production of ROS leads apoptotic pathway. Glutathione peroxidase acts as the second line of defense by converting peroxide into water and molecular form of oxygen. Especially in mammalian cells, it plays a critical role of protecting them from oxidative stress.Citation17 An imbalance between the productions of free radicals and the cell ability for detoxifying these radicals is involved in the molecular mechanism of cellular toxicity.Citation18,Citation19
In the present study, we employed the HaCaT cell line to analyze changes in the morphology, viability, apoptosis, nuclear DNA, mitochondrial membrane potential (MMP), ROS and glutathione (GSH) of these cells in response to treatment with the yttria-stabilized zirconia nanoparticles.
Materials and methods
Chemical and reagents
Zirconia-stabilized yttria (ZrO2/Y2O3) nanoparticles (Average particle size <100 nm, composition (ZrO2)0.92(Y2O3)0.08) were purchased from Sigma-Aldrich, USA. MTS (3-(4,5-dimethylthiazol-2-yl)-5-(3-carboxymethoxyphenyl)-2-(4-sulfophenyl)-2H-tetrazolium), neutral red dye, 5,5-dithio-bis-(2-nitrobenzoic acid) (DTNB), 2,7-dichlorofluorescein diacetate (H2-DCFH-DA), dimethyl sulfoxide (DMSO), annexin V FITC and propidium iodide (PI) were obtained from Sigma-Aldrich. Dulbecco’s modified Eagle’s medium (DMEM), fetal bovine serum (FBS) and antibiotics were purchased from Gibco, USA. All other chemicals were purchased from local suppliers.
Cell culture
HaCaT cells (passage no. 20) were brought from Research Center King Faisal Specialty Hospital, Riyadh, Saudi Arabia. HaCaT cells were grown in DMEM culture medium supplemented with FBS (10%) and 100 U/mL antibiotics at CO2 (5%) incubator at 37°C. At nearly about 80% confluence, both cells were subcultured into 96-well plates, 6-well plates and 25 cm2 flasks according to designed experiments.
Exposure of nanoparticles
The cells were precultured for 24 hrs before exposure of zirconia-stabilized yttria nanoparticles. The nano powder was suspended in culture medium (1 mg/mL) and diluted according to the experimental concentrations (5–60 µg/mL). The suspension solution of yttria-stabilized zirconia nanoparticles was sonicated by using probe sonicator at room temperature for 15 mins at 40 W to avoid nanoparticles' aggregation before treatment. HaCaT cells were exposed for 60 mins with 5 mM of NAC before 24 hrs co-exposure with or without zirconia-stabilized yttria nanoparticles. The cells were not treated with yttria-stabilized zirconia nanoparticles served as controls in each experiment.
Physiochemical characterization of zirconia-stabilized yttria nanoparticles
Scanning electron microscopy (SEM)
The size, shape and morphology of zirconia-stabilized yttria were observed by scanning electron microscope (SEM) (JEOL Inc., Tokyo, Japan).
Transmission electron microscopy (TEM)
The size, shape and morphology of zirconia-stabilized yttria were observed by transmission electron microscope (TEM) (JEOL Inc., Tokyo, Japan). The dry powder of zirconia-stabilized yttria was mixed and double distilled at 1 mg/mL and homogenous suspension was formed after sonicating by sonicator (Qsonica, Q700 sonicator, Newtown, CT 06470, US) at room temperature for 15 mins at 40 W. A drop of diluted zirconia-stabilized yttria suspension was put onto a carbon-coated copper grid, air-dried and observed by using TEM.
Dynamic light scattering (DLS)
The mean hydrodynamic size and zeta potential of zirconia-stabilized yttria in culture medium and distilled water were observed by DLS (Nano-Zeta Sizer-HT, Malvern, UK) as reported by Murdock et al.Citation20 The dry powder of zirconia-stabilized yttria was suspended in distilled water and cell culture medium (DMEM with 10% FBS) at a concentration of 60 μg/mL. Then, the suspension was sonicated using a sonicator at room temperature for 15 mins at 20 W and the hydrodynamic size was determined.
Cell morphology
HaCaT cells (1×10⁴/well) were seeded in 6-well plates and after 24 hrs, cells were treated in zirconia-stabilized yttria (0, 5, 10, 30, 60 µg/mL) for 24 and 48 hrs. Morphology of cells was observed after 24 and 48 hrs exposure by using an inverted microscope (Leica DMIL, Houston, USA).
MTS assay
The cytotoxicity of yttria-stabilized zirconia nanoparticles on HaCaT cells was measured as described by McGowan et al.Citation20 Briefly, 1×10⁴ cells per well were cultured in culture plate (96-well) and treated with various doses (0, 5, 10, 30, 60 µg/mL) of zirconia-stabilized yttria for 24 and 48 hrs. After exposure, the culture media was removed from 96-well plates and 100 µL MTS (Promega Corp., Madison, WI). Reagent was added directly to the wells and cells incubated at 37°C for a minimum of 2 hrs. Assessment of metabolic activity was recorded as relative colorimetric changes measured at 492 nm using a micro plate reader (Synergy-HT; BioTek, Winooski, VT, USA).
NRU assay
After exposure of nanoparticles (5–60 μg/mL) for 24 and 48 hrs, cells were washed with chilled phosphate-buffered saline (PBS). The cell culture plates were incubated for 4 hrs with NR dye (50 μg/mL) containing DMEM.
The optical density was taken at 540 nm.Citation21
Reactive oxygen species (ROS)
HaCaT cells were cultured in multi-well (96) black plates (2×10⁴ cells/well) and exposed to yttria-stabilized zirconia nanoparticles (5–60 µg/mL). The cells were incubated with H2DCF-DA for 30 mins. After incubation, the fluorescence of DCF was determined by using microplate spectrofluorometer (Spectra MAX Gemini EM, Molecular Devices) using 480-nm excitation and 530-nm emission wavelengths. The production of ROS was further validated by the administration of NAC (5 mM) as a scavenger.Citation22
A parallel experiment of cells (1x10³ cells/well) in a 6-well transparent plate was examined for intracellular ROS generation by using a fluorescent microscope (Olympus CKX41; Olympus: Center Valley, Pennsylvania, USA), with images taken at 10× magnification.
Cells extract
The cell extract was prepared from untreated and yttria-stabilized zirconia nanoparticles treated cells for lipid peroxide (LPO) and glutathione (GSH). Briefly, HaCaT cells were full-grown in 25 cm2 culture flask and exposed to yttria-stabilized zirconia nanoparticles (5–60 µg/mL) for 24 hrs. After treatment, the cells were scratched and washed with PBS at 4°C. The cell pellets were lysed in cell lysis buffer [1×20 mM Tris-HCl (pH 7.5), 150 mM NaCl, 1 mM Na2EDTA, 1% Triton, 2.5 mM sodium pyrophosphate]. After centrifugation (13,000 g for 10 mins at 4°C), the supernatant (cell extract) was maintained on ice for further tests.
Protein quantity in cell lysate was determined by the Bradford method using bovine serum albumin as the standard.Citation22
LPO test
The level of LPO was determined by measuring the formation of malondialdehyde (MDA) using the method of Ohkawa et al.Citation24 The cell lysate (100 µL) was mixed with 1.9 mL sodium phosphate buffer (0.1 M, pH 7.4) and incubated for 60 mins 37°C. After incubation, 5% TCA was added and centrifuged at 3000 g for 10 mins at room temperature to obtain a supernatant. The supernatant was mixed with 1 mL TBA (1%) and put in a water bath at 100°C for 30 mins. The optical density of the cooled mixture was examined at 532 nm and was converted to MDA and expressed in terms of percentage as compared with the control.
Glutathione (GSH) assay
The glutathione level was measured using Ellman’s method.Citation25 The cell lysate (100 µL) was mixed with 900 µL TCA (5%) and centrifuged at 3000 g for 10 mins at 4°C. The supernatant (500 µL) was mixed with DTNB (0.01%, 1.5 mL) and OD of the mixture was observed at 412 nm. The quantity of glutathione was represented in percentage (%) as compared with the control.
JC-1 staining for mitochondrial transmembrane potential (MTP)
Mitochondrial transmembrane potential (MTP) was examined with JC-1 fluorescent dye. HaCaT cells were exposed to yttria-stabilized zirconia nanoparticles (30 and 60 μg/mL) 24 and 48 hrs. After exposure, cells were put with 5 μM JC-1 (Cayman chemical) for 30 mins at 37°C, washed and photomicrograph was captured by fluorescence microscope.Citation26
A parallel set of cells (1×10⁴ cells/well) in a 96-well black plate exposed different concentration of yttria-stabilized zirconia nanoparticles (0, 5, 10, 30 and 60 μg/mL) 24 and 48 hrs to determine MTP in HaCaT cells by using a fluorescence microplate reader (Synergy-HT; BioTek, Winooski, VT, USA).
Damage of lysosome
The integrity of the lysosomal membrane was examined by applied acridine orange (AO) repositioning method. The cells were exposed to yttria-stabilized zirconia nanoparticles (60 μg/mL) 24 and 48 hrs. After exposure, cells were washed with chilled PBS and discolored with AO (10 µg/mL) for 20 mins at room temperature. Photomicrograph of all treatments was taken in fluorescence microscope with green and red filters.
Detection of apoptosis with AO and EtBr staining
The toxic effect of yttria-stabilized zirconia nanoparticles on HaCaT cells was determined by using double staining of acridine orange (AO) and ethidium bromide (EtBr). Apoptotic and necrotic cells were observed according to Byczkowska et al method.Citation27 HaCaT cells were exposed to yttria-stabilized zirconia nanoparticles (30 µg/mL) for 24 hrs and 48 hrs and stained with a mixture of EtBr (10 µL) and AO (10 µL) prepared in PBS. The photomicrograph was captured through a fluorescence microscope (Leica). This method was used for the qualitative analysis of apoptotic and live cells.
Determination of phosphatidylserine translocation and caspase-3 enzyme activity
HaCaT cells were cultured and exposed to yttria-stabilized zirconia nanoparticles for 24 and 48 hrs. After exposure, the cells were fixed with paraformaldehyde (4%) for 5 mins. The fixed cells were washed in chilled PBS and stained with a mixture of annexin V/FITC conjugate (2 µL) and propidium iodide (10 µL/mL) prepared in binding buffer (500 µL) (Sigma). The fluorescent image was examined under a confocal microscope with excitation 488 nm and emission 520 nm for annexin V/FITC and excitation 536 nm and emission 617 nm for propidium iodide.Citation28
The caspase-3 enzyme was determined in HaCaT cells after exposure to yttria-stabilized zirconia nanoparticles for 24 and 48 hrs by using Cayman Chemical colorimetric assay kits.
Western blot analysis
Protein isolation
The HaCaT cells were exposed to nanoparticles (30 µg/mL) for 48 hrs. After exposure, the cells were rinsed with chilled PBS and scraped. The cell suspension was put in a 1.5-mL Eppendorf tube. It was centrifuged at 5000 rpm at 4°C for 5 mins, and the supernatant was discarded. The cell pellets were desiccated at room temperature, and a mixture of extract buffer and 15 μL/mL protease inhibitor was mixed. Then, it was put at room temperature for 15 mins and for 30 mins in ice. Then the mixture was centrifuged at 15,000 rpm for 30 mins at 4°C. The supernatant was collected in a new tube and the concentration of protein was quantified by Bradford method in all samples.Citation23
SDS-PAGE and Western blotting
For 10% SDS-PAGE, we have resolved protein (50 μg) and relocated polyvinylidene difluoride (PVDF) membranes. Then, PVDF was blocked in blocking solution and put with human monoclonal antibodies (1:1500) to β-actin, Bax and Bcl2. After incubation, PVDF was washed thrice with TBST in 10 mn gap. PVDF was put again with horseradish peroxidase-conjugated secondary antibodies in 1:20,000 dilutions for 2 hrs followed by washing with TBST three times. The band of expressed protein was observed in Image Quant LAS 500 (GE Healthcare Lifesciences) with Immobilon western chemiluminescent HRP substrate (Millipore)
Alkaline single cell gel electrophoresis
The alkaline single cell gel electrophoresis (SCGE) assay is a qualitative and quantitative assay for determining DNA strand breakage in single cells.Citation29 SCGE assay was performed as a three-layer procedure. Briefly, 50,000 cells/well was cultured in 6-well plates. After 24 hrs, cells were treated to different concentration of yttria-stabilized zirconia nanoparticles for 24 and 48 hrs. Single strand breakage was determined as % tail DNA and olive tail moment (OTM). The cell image of 50 random cells (25 from each replicate slide) was analyzed for each experiment.
Statistical analysis
The significant difference of the present result was analyzed by using SPSS software and applying one-way analysis of variance (ANOVA) and the differences were calculated (*p<0.05; **p<0.01). Results are presented as mean value of triple independent experimental points.
Results
Physiochemical properties of yttria-stabilized zirconia nanoparticles
Physiochemical properties of yttria-stabilized zirconia nanoparticles were determined by using a scanning electron microscope (SEM), transmission electron microscope (TEM) and dynamic light scattering (DLS) methods. SEM image shows the outer morphology of yttria-stabilized zirconia nanoparticles (). The average diameter of yttria-stabilized zirconia nanoparticles was determined by observing 50 nanoparticles (). The average diameter of yttria-stabilized zirconia nanoparticles was 33.9±2.1 nm. represents the frequency of size distribution of yttria-stabilized zirconia nanoparticles.
Figure 1 Characterization of yttria-stabilized zirconia (ZrO2/Y2O3) nanoparticles. (A) Scanning electron microscopy (SEM) image of yttria-stabilized zirconia nanoparticles. (B) Transmission electron microscopy (TEM) image of yttria-stabilized zirconia nanoparticles. (C) Frequency (%) of yttria-stabilized zirconia nanoparticles size distribution.
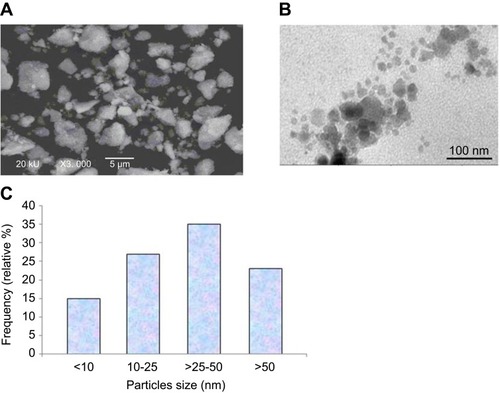
The size of yttria-stabilized zirconia nanoparticles in culture medium and double distilled water was 186 and 220 nm, respectively. Further, the zeta-potential of yttria-stabilized zirconia nanoparticles in culture medium and water was −9.5 and −12.8 mV, respectively.
Effect of yttria-stabilized zirconia nanoparticles on HaCaT cell morphology
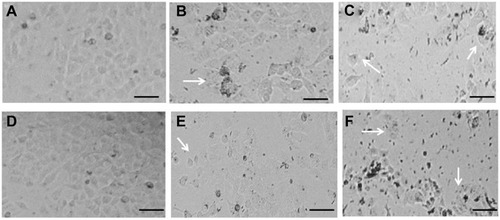
Observations from three independent experiments indicated that the exposure to different concentrations of yttria-stabilized zirconia nanoparticles resulted in increased cell death, fragmented morphology and at higher nanoparticle concentration (60 µg/mL). The cells were changed into a spherical shape and detached from the surface of culture flask and clumped (); on the other hand, there is no change in morphology of untreated cells in 24 hrs and 48 hrs ().
Figure 2 Morphological changes in HaCaT cells exposed to different concentrations of yttria-stabilized zirconia nanoparticles. (A) Control HaCaT cells for 24 hrs. (B) HaCaT cells exposed to 30 µg/mL for 24 hrs. (C) HaCaT cells exposed to 60 µg/mL for 24 hrs. (D) Control HaCaT cells for 48 hrs. (E) HaCaT cells exposed to 30 µg/mL for 48 hrs. (F) HaCaT cells exposed to 60 µg/mL for 48 hrs. Arrows indicate damaged HaCaT cells for 24 and 48 hrs. Scale bar is 50 µm.
Cytotoxicity
HaCaT cells were exposed to different concentrations (5–60 μg/mL) of yttria-stabilized zirconia nanoparticles for 24 and 48 hrs and cell viability was determined by the MTS and NRU assays. Yttria-stabilized Zirconia nanoparticles produced cytotoxicity in concentration and time-dependent manner. Results of MTS assay indicated that the viability of cells was decreased to 94%, 90%, 78% and 65% in 24 hrs, and 92%, 88%, 50% and 43% in 48 hrs for same concentrations ().
Figure 3 Percentage cell viability of HaCaT cells after exposure to yttria-stabilized zirconia nanoparticles. (A) MTS assay; (B) NRU assay. (C and D) A positive linear correlation between MTS and NRU assay cell viability. Each value represents the mean ± SE of three experiments. n=3, #p<0.05 and ##p<0.01 vs control.
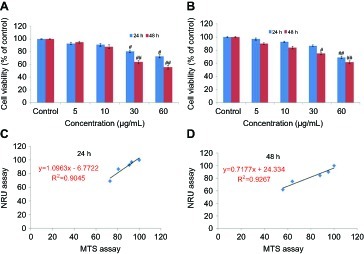
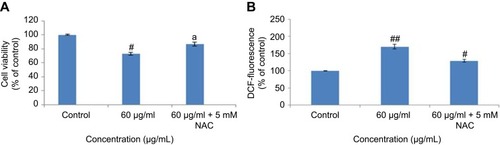
The results of the NRU assay were accorded with the MTS assay. The result of NRU assay showed slightly low cytotoxicity as compared to MTS assay (). Furthermore, a positive linear correlation was observed between MTS and NRU assay cell viability in 24 hrs (R2=0.9045) () and 48 hrs (R2=0.9267) cells (D). The cell viability was increased in the presence of NAC (5 mM) at yttria-stabilized zirconia nanoparticles' (60 μg/mL) exposure ().
Figure 4 Effect of N-acetyl cysteine (NAC) on yttria-stabilized zirconia nanoparticles for 24 hrs in HaCaT cells. (A) % MTT reduction in 24 hrs. (B) % ROS generation in 24 hrs. Each value represents the mean ± SE of three experiments. ap<0.05 analysis between without NAC and with NAC and #p<0.05, ##p<0.01 vs control.
Abbreviation: ROS, reactive oxygen species.
Oxidative stress
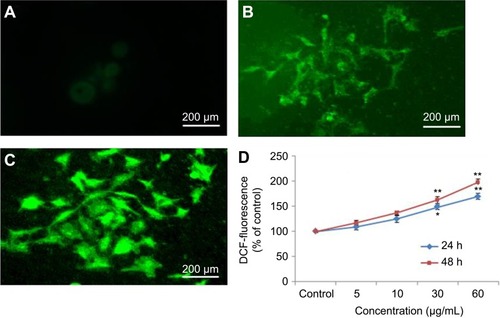
Nel et alCitation30 have documented that cytotoxicity, apoptosis and DNA damage occurred due to oxidative stress. Production of ROS induced concentration at time-dependent manner due to yttria-stabilized zirconia nanoparticles (). Fluorescent microscopy result demonstrated that the result was concentration-dependent and treated cells expressed high intensity of green fluorescent DCF (indicator of ROS generation) () in comparison to control (). In the presence of NAC (5 mM) at yttria-stabilized zirconia nanoparticles (60 μg/mL) treated cells, the level of ROS generation was inhibited ().
Figure 5 Induction of ROS in HaCaT cells after exposure of yttria-stabilized zirconia nanoparticles. (A) Control. (B) The fluorescence image of cells treated with 60 µg/mL of nanoparticle for 24 hrs and stained with DCFHDA. (C) The fluorescence image of cells treated with 60 µg/mL of nanoparticle for 48 hrs and stained with DCFHDA. (D) % ROS production due to nanoparticle in cells. Each value represents the mean ±SE of three experiments. *p<0.05 and **p<0.01 vs control.
Abbreviation: ROS, reactive oxygen species.
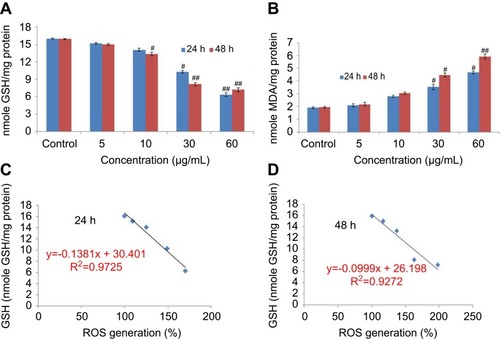
Ayala et alCitation31 reported that the high quantity of free radicals or ROS can inflict direct damage to lipids. The GSH was declined significantly according to concentration at time-dependent manner in yttria-stabilized zirconia nanoparticles treated cells (). The malondialdehyde (MDA) quantity, which is an end product of lipid peroxide, was highly significant and increased concentration at time-dependent manner (). Moreover, a positive linear correlation was found between GSH and ROS generation (%) in 24 hrs (R2=0.9725) () and 48 hrs (R2=0.9272) cells ().
Figure 6 (A) Levels of glutathione. (B) Lipid peroxide in HaCaT cells after exposure to yttria-stabilized zirconia nanoparticles for 24 and 48 hrs. (C) Correlation of the ROS generation (%) and GSH level in HaCaT cells. Each value represents the mean ± SE of three experiments. #p<0.05 and ##p<0.01 vs control.
Abbreviations: GSH, glutathione; ROS, reactive oxygen species.
Mitochondrial trans-membrane potential (MTP) and lysosome membrane destabilization
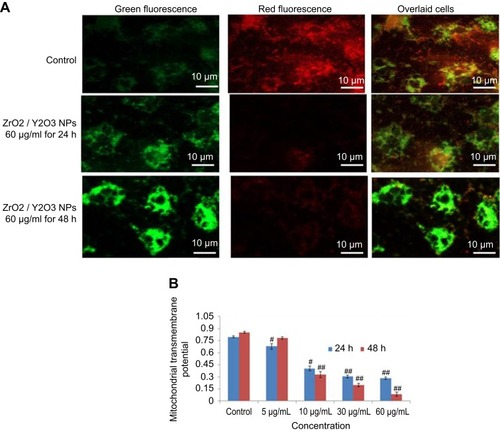
MTP was examined by JC-1 method on the development principle of J-aggregate and J monomer. Some researchers reported that MPT was a decline in the apoptotic and necrotic cell.Citation32 Untreated cells expressed normal MTP; so, mitochondria incorporate JC-1dye and developed J aggregates, with deep red fluorescence (). HaCaT cells exposed to 60 µg/mL of yttria-stabilized zirconia nanoparticles decline their MPT and did not incorporate JC-1 dye and the development of J-aggregate was prevented and which is denoted with green fluorescence (). The change in MTP in HaCaT cells was in concentration- or time-dependent manner ().
Figure 7 (A) Images representing MTP loss in HaCaT cells after yttria-stabilized zirconia nanoparticles exposure at concentrations of 60 μg/mL for 24 and 48 hrs. (B) Change in MTP (%) in HaCaT cells after yttria-stabilized zirconia nanoparticles exposure for 24 and 48 hrs. Each value represents the mean ± SE of three experiments. #p<0.05 and ##p<0.01 vs control.
Abbreviation: MTP, mitochondrial transmembrane potential.
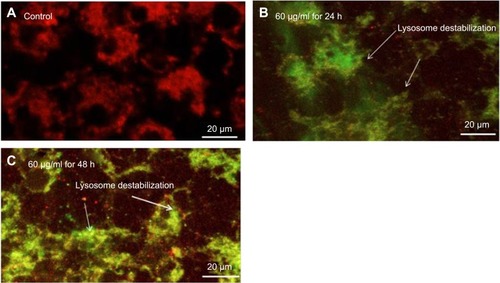
The effect of yttria-stabilized zirconia nanoparticles on lysosome was examined through acridine orange (AO) dye and it displayed red fluorescence to the healthy lysosome (highly acidic pH) as observed in the control (). Exposed HaCaT cells to yttria-stabilized zirconia nanoparticles induced fragmentation of lysosome membrane (lower acidic pH). As a consequence, the AO dye leaked out from the cytoplasm, red fluorescence merged with green fluorescence and formed orange fluorescence; these are the characteristics of a damaged lysosome (). Thus, these findings indicate that lowering of the mitochondrial transmembrane potential and lysosome destabilization in HaCaT cells occurred due to yttria-stabilized zirconia nanoparticles; it induced cytotoxicity in HaCaT cells as consequences.
Figure 8 Images representing lysosome destabilization in HaCaT cells after exposure to yttria-stabilized zirconia nanoparticles (60 μg/mL) for 24 and 48 hrs. (A) Control cells; (B) 60 µg/mL for 24 hrs; (C) 60 µg/mL for 48 hrs.
Induced apoptosis
Phosphatidylserine translocation and AO and EtBr staining
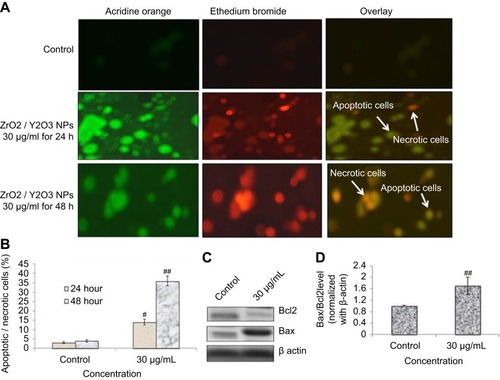
Cell morphological test through fluorescent dye differentiated healthy apoptotic and necrotic cells on the integrity of chromatin and plasma membrane (). The untreated HaCaT cells displayed AO dye fluorescence (green) without EtBr staining which demonstrates healthy cells. Cells exposed to yttria-stabilized zirconia nanoparticles (30 µg/mL) indicated more apoptotic and necrotic cells, with orange fluorescence. This result demonstrated that the plasma membrane of cells was damaged and EtBr easily stained the nucleus and formed orange color fluorescence (). These findings indicate that the plasma membrane of zirconia-stabilized yttria nanoparticles treated cells were compromised (). shows the percentage of apoptotic and necrotic cells in HaCaT cells.
Figure 9 (A) Image of HaCaT cells presenting viable and apoptotic cells. (B) Percentage of apoptotic/necrotic cells treated to yttria-stabilized zirconia nanoparticles (30 µg/mL) for 24 and 48 hrs. (C) Expression of pro- and anti-apoptotic proteins as evaluated by immuno blotting for 48 hrs. (D) Densitometric analysis of relative protein level of Bax/Bcl2 ratio. Each value represents the mean ± SE of three experiments. n=3, #p<0.05 and ##p<0.01 vs control.
The dislocation of PS from inner to outer plasma membrane examined in cells exposed to yttria-stabilized zirconia nanoparticles (30 µg/mL). Untreated cells did not display any fluorescence under confocal microscope imaged under differential interference contrast (DIC) (). In early apoptotic cells, the PS translocation displayed green fluorescence of Annexin V/FITC but plasma membrane was healthy so PI did not stain the nucleus. In late apoptotic cells, plasma membrane was damaged in addition to PS dislocation (). PI incorporates the nucleus and induces red fluorescence. Annexin V/PI double staining supports apoptotic cell death with a clear differentiation of early apoptotic cells with late one by yttria-stabilized zirconia nanoparticles (30 µg/mL) exposure (). We have observed only green fluorescence in cells with co-exposure to NAC and yttria-stabilized zirconia nanoparticles (30 µg/mL) ().
Figure 10 Yttria-stabilized zirconia-nanoparticles-induced apoptosis as marked by phosphatidylserine translocation in HaCaT cells. HaCaT cells were exposed to nanoparticles (30 µg/mL) for 24 and 48 hrs and stained with Annexin V and propidium iodide (PI). (A) Control cells showed few Annexin V stain and no PI stain. (B) Cells treated with nanoparticles (30 µg/mL) for 24 hrs showed intense Annexin V staining (green) in most cells demarcates early apoptosis and combined staining with Annexin V and PI are late apoptosis. (C) Nanoparticles (30 µg/mL) for 48 hrs showed cells with Annexin V and PI staining which are all in late apoptosis. (D) Nanoparticles (30 µg/mL) for 48 hrs in presence of NAC (5 mM) reduced apoptotic cells. (E) Caspase-3 activity. n=3, #p<0.05 and ##p<0.01 vs control. Scale bar is 20 µm.
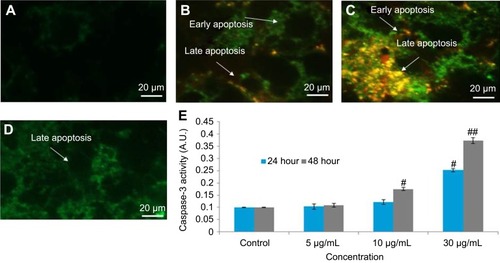
Caspase-3 enzymes are the hallmark of apoptosis and examined in yttria-stabilized zirconia nanoparticles treated cells for validation of our phosphatidylserine translocation and AO and EtBr staining. The level of the caspase-3 enzyme was significantly increased in both tread cells ().
Further, we determined protein expression of Bax and Bcl2 by Western blot method. The expressed apoptotic protein (Bax and Bcl2) Western blot image is represented in . The densitometry analysis of Bax/Bcl2 ratio is shown in . It was 0.52 fold higher in yttria-stabilized zirconia nanoparticles (30 μg/mL, 48 hrs) treated cells as equated to untreated cells. Our finding indicates that Bcl2 protein plays an important role in apoptosis in HaCaT cells.
Fragmentation of DNA
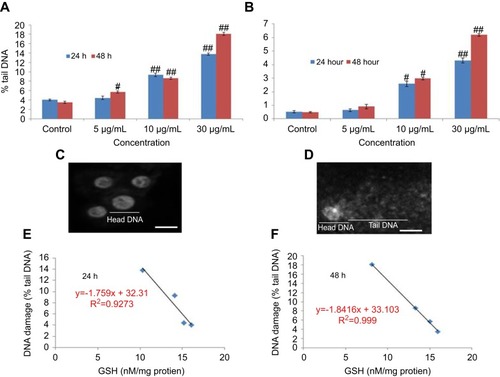
The fragmentation of DNA was quantified through a percentage tail DNA and olive tail moment in the untreated as well as yttria-stabilized zirconia nanoparticles treated cell. HaCaT cells treated with various concentrations of nanoparticles expressed significant DNA damage than untreated cells (). In treated cells, nanoparticles (30 µg/mL for 48 hrs) showed the % tail DNA (18.07%) () than control (3.51%) (). Also, the maximum olive tail moment (6.20 AU) was observed in treated cells at 30 µg/mL nanoparticles for 48 hrs than in control (0.49 AU) (). The correlation between GSH and DNA damage was represented in for 24 hrs and in for 48 hrs.
Figure 11 DNA strand breakage in HaCaT cells due to yttria-stabilized zirconia nanoparticles for 24 and 48 hrs. (A) Tail DNA (%). (B) Olive tail moment. (C) Untreated HaCaT cells. (D) Treated HaCaT cells (30 µg/mL of yttria-stabilized zirconia nanoparticles) for 24 hrs. (E and F) Correlation of the GSH level and DNA damage (% tail DNA) in HaCaT cells. Each value represents the mean ± SE of three experiments. #p<0.05 and ##p<0.01 vs control. Scale bar is 50 µm.
Abbreviation: GSH, glutathione.
Discussion
The use and manufacturing of different types of nanomaterials in the last decade have been increased, as well as, the lack of safety. Yttria-stabilized zirconia nanoparticles are used as drug delivery carriers for some medicines like itraconazole, penicillin, alendronate and zoledronate. The size and shape of nanoparticles play an important role in the application of nanoparticles.Citation33 The adverse effect of engineered nanoparticles has been considered as a serious limitation to their different application and so, before the application of these nanoparticles, the toxicological characterization of these nanoparticles is more essential. Jong and BormCitation34 documented that nanomaterial produces adverse effect due to their small size and physiochemical properties. Therefore, it is mandatory to sort out the physical properties of yttria-stabilized zirconia nanoparticles before their biological use. The important properties of nanoparticles are their quality, purity, nature, shape, size and agglomeration which affect the biological reactivity of nanomaterials.Citation35 We have examined the yttria-stabilized zirconia nanoparticles by DLS, SEM and TEM methods. The size of yttria-stabilized zirconia nanoparticles differed from each other. The greater size of nanoparticles in liquid suspension is the primary size which is due to the nature of nanoparticles aggregate in liquid suspension.Citation36 The large size of nanoparticles in aqueous suspension of the original diameter may be due to the affinity of nanoparticles agglomerate in aqueous suspension.Citation37 The suspension of nanoparticles in culture media is formed as an outer layer of protein.Citation38 So, not only the size of the original nanoparticles but also the size of the secondary nanoparticles could be used as a characteristic parameter to determine the in vitro toxicity of nanoparticles in a cell culture medium.
In the present study, cytotoxicity and mutagenicity of yttria-stabilized zirconia nanoparticles on HaCaT cells were examined by using MTS, NRU, micronuclei and comet assays. Yttria-stabilized zirconia nanoparticles had decreased cell viability in a concentration- or time-dependent manner. After exposure of yttria-stabilized zirconia nanoparticles, MTS (metabolic activity) and NRU (lysosomes activity) were used for cell viability HaCaT cells. These assays worked as a sensitive tool for cell integrity and cell growth. Cells were stained with AO/EtBr and significantly condensed nuclei were observed in nanoparticles exposed cells. Oxidative stress generated by ROS is linked to the activation of the caspase pathway. The consequence of oxidative stress is the cell, tissue and organs injury caused by oxidative damage. Ayala et alCitation31 have reported that a high concentration of free radicals or ROS can cause direct damage to lipids. The ROS that can intensely disturb lipids are hydroxyl radical (OHº) and hydroperoxyl (HOº2). The hydroxyl radical is a small, highly mobile, water-soluble and chemically most reactive species of activated oxygen. The primary sources of endogenous ROS production are the mitochondria, plasma membrane, endoplasmic reticulum and peroxisomes.Citation39 LPO enzyme generates more free radicals and damages the biomolecules with ROS. Ott et alCitation40 reported that too much generation of ROS initiates apoptosis. Hydroxyl radicals cause oxidative damage to cells because they un-specifically attack biomolecules and are involved in cellular disorders such as cardiovascular disease and cancerCitation41,Citation42. In numerous biochemical studies, it has been established that the majority of tumor cells present very few anti-oxidative enzymes, such as catalase, superoxide dismutase and glutathione peroxidase, which are known to play a protective role against ROS in normal cells. JC-1 stain is a potential sensitive fluorescence stain which can identify healthy mitochondria as red color fluorescence and unhealthy mitochondria membrane as green fluorescence. The outer membrane of mitochondria become permeabilized and as a consequence, decline MPT and oligomeric pore in the external membrane as exposed by JC-1 stain.
An early and remarkable effect of nanoparticles on the cells is the change of cell shape. In this study, yttria-stabilized zirconia nanoparticles clearly changed the morphology of HaCaT cells after 24 hrs of exposure. The cells lost their typical spindle shape and the cytoskeleton was disorganized, in spite of the evidence that the total content of actin did not vary. Moreover, some fragmented nuclei, a typical feature of apoptosis, could be observed. It is noteworthy that the reorganization of the cytoskeleton is a necessary event in apoptosis. The DNA damage and oxidative stress as observed in the present study is in accordance with the findings of Alarifi et alCitation26 in the human hepatocarcinoma cells for palladium nanoparticles and AlkahtaneCitation43 in the A549 for indium tin oxide nanoparticles.
To support our aim of apoptotic and necrotic cell AO/EtBr double staining endorsed apoptotic and necrotic HaCaT cells due to yttria-stabilized zirconia nanoparticles treatment. Annexin V/PI double staining validates apoptotic cell death with a clear distinction of early and late apoptosis with yttria-stabilized zirconia nanoparticles exposure. The selections of yttria-stabilized zirconia nanoparticles experiments prove our viewpoint that higher concentration may be harmful to human and animals. Further, our data revealed the contribution of mitochondria and lysosome in yttria-stabilized zirconia nanoparticles induced cytotoxicity in HaCaT cells. Depolarization of mitochondrial transmembrane potential and deterioration of lysosome occurred at yttria-stabilized zirconia nanoparticles (25 mg/mL) exposure. The expression of apoptosis regulator protein (bax, bcl2) and caspase-3 was confirmed through Western blot analysis. The oxidative stress signals produced by ROS received the Bax and started moving toward the mitochondria. Thus, these data support our viewpoint of mutagenic and caspase-3-dependent apoptosis via mitochondrial pathway induced by yttria-stabilized zirconia nanoparticles.
Disclosure
The authors report no conflicts of interest in this work.
Acknowledgment
This research was funded by the Deanship of Scientific Research at Princess Nourah Bint Abdulrahman University (Grant No. 39-S-267).
References
- Bai CL, Liu MH. Implantation of nanomaterials and nanostructures on surface and their applications. Nano Today. 2012;7(4):258–281. doi:10.1016/j.nantod.2012.05.002
- Hilger I. In vivo applications of magnetic nanoparticle hyperthermia. Int J Hyperth. 2013;29(8):828–834. doi:10.3109/02656736.2013.832815
- De Matteis V, Rinaldi R. Toxicity assessment in the nanoparticle era. Adv Exp Med Biol. 2018;1048:1–19. doi:10.1007/978-3-319-72041-8_129453529
- Link N, Brunner TJ, Dreesen IA, Stark WJ, Fussenegger M. Inorganic nanoparticles for transfection of mammalian cells and removal of viruses from aqueous solutions. Biotechnol Bioeng. 2007;98(5):1083–1093. doi:10.1002/bit.2152517546691
- Gillani R, Ercan B, Qiao A, Webster TJ. Nano functionalized zirconia and barium sulfate particles as bone cement additives. Int J Nanomedicine. 2010;5:1–11.20161983
- Kabir M, Ghahari M, Afarani MS. Co-precipitation synthesis of nano Y2O3: eu3+ with different morphologies and its photoluminescence properties. Ceram Int. 2014;40:10877–10885. doi:10.1016/j.ceramint.2014.03.081
- Shih SJ, Yu YJ, Wu YY. Manipulation of dopant distribution in yttrium-doped ceria particles. J Nanosci Nanotechnol. 2012;12:7954–7962. doi:10.1166/jnn.2012.659223421163
- Zobeiri E, Bayandori MA, Gudarzy F, Mohammadi H, Mozaffari S, Ganjkhanlou Y. Modified Eu-doped Y2O3 nanoparticles as turn-off luminescent probes for the sensitive detection of pyridoxine. Luminescence. 2015;30(3):290–295. doi:10.1002/bio.272725060041
- Chávez-García D, Juárez-Moreno K, Campos CH, Alderete JB, Hirata GA. Upconversion rare earth nanoparticles functionalized with folic acid for bioimaging of MCF-7 breast cancer cells. J Mater Res. 2018;33(2):191–200. doi:10.1557/jmr.2017.463
- Gao C, Jin Y, Jia G, et al. Y2O3 nanoparticles caused bone tissue damage by breaking the intracellular phosphate balance in bone marrow stromal cells. ACS Nano. 2019;13(1):313–323. doi:10.1021/acsnano.8b0621130571089
- Liu G, Lin Y. Electrochemical sensor for organophosphate pesticides and nerve agents using zirconia nanoparticles as selective sorbents. Anal Chem. 2005;77(18):5894–5901. doi:10.1021/ac050791t16159119
- Sadeghnia HR, Kamkar M, Assadpour E, Boroushaki MT, Ghorbani A. Protective effect of safranal, a constituent of crocus sativus, on quinolinic acid-induced oxidative damage in rat hippocampus. Iran J Basic Med Sci. 2013;16(1):73–82.23638295
- Krejcí E, Kodet O, Szabo P, et al. In vitro differences of neonatal and later postnatal keratinocytes and dermal fibroblasts. Physiological research/Academia Scientiarum Bohemoslovaca. Physiol Res. 2014;64:561–569.25470521
- Khanna RD, Karki K, Pande D, Negi R, Khanna RS. Inflammation, free radical damage, oxidative stress and cancer. Microinflammation. 2014;1:109.
- Esra B, Umit MS, Cansin S, Serpil E, Omer K. Oxidative stress and antioxidant defense. World Allergy Organ J. 2012;5(1):9–19. doi:10.1097/WOX.0b013e318243961323268465
- Agarwal A, Aponte-Mellado A, Premkumar BJ, Shaman A, Gupta S. The effects of oxidative stress on female reproduction: a review. Reprod Biol Endocrinol. 2012;10:49. doi:10.1186/1477-7827-10-4922748101
- Bhabak KP, Mugesh G. Functional mimics of glutathione peroxidase: bioinspired synthetic antioxidants. Acc Chem Res. 2010;43:1408–1419. doi:10.1021/ar100059g20690615
- Circu ML, Aw TY. Reactive oxygen species, cellular redox systems, and apoptosis. Free Radic Biol Med. 2010;48:749–762. doi:10.1016/j.freeradbiomed.2009.12.02220045723
- Ahmadinejad F, Møller SG, Hashemzadeh CM, Bidkhori G, Jami MS. Molecular mechanisms behind free radical scavengers function against oxidative stress. Antioxidants (Basel). 2017;6(3):51. doi:10.3390/antiox6030051
- Murdock RC, Braydich-Stolle L, Schrand AM, Schlager JJ, Hussain SM. Characterization of nanomaterial dispersion in solution prior to in vitro exposure using dynamic light scattering technique. Toxicol Sci. 2008;101(2):239–253. doi:10.1093/toxsci/kfm24017872897
- Borenfreund E, Puerner JA. Toxicity determination in vitro by morphological alterations and neutral red absorption. Toxicol Lett. 1985;24:119–124.3983963
- Halasi M, Wang M, Chavan TS, Gaponenko V, Hay N, Gartel AL. ROS inhibitor N-acetyl-l-cysteine antagonizes the activity of proteasome inhibitors. Biochem J. 2013;454(2):201–208. doi:10.1042/BJ2013028223772801
- Bradford MM. A rapid and sensitive method for the quantitation of microgram quantities of protein utilizing the principle of protein dye binding. Anal Biochem. 1976;72:248–254. doi:10.1006/abio.1976.9999942051
- Ohkawa H, Onishi N, Yagi K. Assay for lipid peroxidation in animal tissue by thiobarbituric acid reaction. Anal Biochem. 1979;95:351–358. doi:10.1016/0003-2697(79)90738-336810
- Ellman GL. Tissue sulfhydryl groups. Arch Biochem Biophys. 1959;82:70–77. doi:10.1016/0003-9861(59)90090-613650640
- Alarifi S, Ali D, Alkahtani S, Almeer RS. ROS-mediated apoptosis and genotoxicity induced by palladium nanoparticles in human skin malignant melanoma cells. Oxid Med Cell Longev. 2017;2017:Article ID 8439098, 10. doi:10.1155/2017/8439098
- Byczkowska A, Kunikowska A, Kaźmierczak A. Determination of ACC-induced cell-programmed death in roots of Vicia faba ssp. minor seedlings by acridine orange and ethidium bromide staining. Protoplasma. 2013;250(1):121–128. doi:10.1007/s00709-012-0383-922350735
- Ali D, Verma A, Mujtaba F, Dwivedi A, Hans RK, Ray RS. UVB-induced apoptosis and DNA damaging potential of chrysene via reactive oxygen species in human keratinocytes. Toxicol Lett. 2011;204(2–3):199–207. doi:10.1016/j.toxlet.2011.04.03321571051
- Ali D, Nagpure NS, Kumar S, Kumar R, Kushwaha B. Genotoxicity assessment of acute exposure of chlorpyrifos to freshwater fish Channa punctatus (Bloch) using micronucleus assay and alkaline single-cell gel electrophoresis. Chemosphere. 2008;71:1823–1831. doi:10.1016/j.chemosphere.2008.02.00718359502
- Nel A, Xia T, Madler L, et al. Toxic potential of materials at the nano level. Science. 2006;311:622–627. doi:10.1126/science.111439716456071
- Ayala A, Muñoz MF, Argüelles S. Lipid peroxidation: production, metabolism, and signaling mechanisms of malondialdehyde and 4-Hydroxy-2-Nonenal. Oxid Med Cell Longev. 2014;2014:Article ID 360438, 31. doi:10.1155/2014/360438
- Webster KA. Mitochondrial membrane permeabilization and cell death during myocardial infarction: roles of calcium and reactive oxygen species. Future Cardiol. 2012;8(6):863–884. doi:10.2217/fca.12.5823176689
- Dreaden EC, Alkilany AM, Huang X, Murphy CJ, El-Sayed MA. The golden age: gold nanoparticles for biomedicine. Chem Soc Rev. 2012;41:2740–2779. doi:10.1039/c1cs15237h22109657
- Jong WHD, Borm PJA. Drug delivery and nanoparticles: applications and hazards. Int J Nanomedicine. 2008;3(2):133–149.18686775
- Yu J, Yang J, Liu B, Ma X. Preparation and characterization of glycerol plasticized-pea starch/ ZnO-carboxymethyl cellulose sodium nanocomposites. Bioresour Technol. 2009;100:2832–2841. doi:10.1016/j.biortech.2008.12.04519217775
- Muller KH, Motskin M, Philpott AJ, et al. The effect of particle agglomeration on the formation of a surface-connected compartment induced by hydroxyapatite nanoparticles in human monocyte-derived macrophages. Biomaterials. 2014;35(3):1074–1088. doi:10.1016/j.biomaterials.2013.10.04124183166
- Bai W, Zhang Z, Tian W, et al. Toxicity of zinc oxide nanoparticles to zebrafish embryo: a physicochemical study of toxicity mechanism. J Nanopart Res. 2009;12:1645–1654. doi:10.1007/s11051-009-9740-9
- Wang H, Lin Y, Nienhaus K, Nienhaus GU. The protein corona on nanoparticles as viewed from a nanoparticle-sizing perspective. Wiley Interdiscip Rev Nanomed Nanobiotechnol. 2017. doi:10.1002/wnan.1500
- Moldovan L, Moldovan NI. Oxygen free radicals and redox biology of organelles. Histochem Cell Biol. 2004;122(4):395–412. doi:10.1007/s00418-004-0676-y15452718
- Ott M, Gogvadze V, Orrenius S, Zhivotovsky B. Mitochondria, oxidative stress and cell death. Apoptosis. 2007;12:913–922. doi:10.1007/s10495-007-0756-217453160
- Lipinski B, Pretorius E. Hydroxyl radical-modified fibrinogen as a marker of thrombosis: the role of iron. Hematology. 2012;17(4):241–247. doi:10.1179/1607845412Y.000000000422889519
- Dizdaroglu M, Jaruga P. Mechanisms of free radical induced damage to DNA. Free Radic Res. 2012;46(4):382–419. doi:10.3109/10715762.2011.65396922276778
- Alkahtane AA. Indium tin oxide nanoparticles-mediated DNA fragmentation and cell death by apoptosis in human lung epithelial cells. Toxicol Environ Chem. 2015;97(8):1086–1098.