Abstract
Previously, iron core–gold shell nanoparticles (Fe@Au) have been shown to possess cancer-preferential cytotoxicity in oral and colorectal cancer (CRC) cells. However, CRC cell lines are less sensitive to Fe@Au treatment when compared with oral cancer cell lines. In this research, Fe@Au are found to decrease the cell viability of CRC cell lines, including Caco-2, HT-29, and SW480, through growth inhibition rather than the induction of cell death. The cytotoxicity induced by Fe@Au in CRC cells uses different subcellular pathways to the mitochondria-mediated autophagy found in Fe@Au-treated oral cancer cells, OECM1. Interestingly, the Caco-2 cell line shows a similar response to OECM1 cells and is thus more sensitive to Fe@Au treatment than the other CRC cell lines studied. We have investigated the underlying cell resistance mechanisms of Fe@Au-treated CRC cells. The resistance of CRC cells to Fe@Au does not result from the total amount of Fe@Au internalized. Instead, the different amounts of Fe and Au internalized appear to determine the different response to treatment with Fe-only nanoparticles in Fe@Au-resistant CRC cells compared with the Fe@Au-sensitive OECM1 cells. The only moderately cytotoxic effect of Fe@Au nanoparticles on CRC cells, when compared to the highly sensitive OECM1 cells, appears to arise from the CRC cells’ relative insensitivity to Fe, as is demonstrated by our Fe-only treatments. This is a surprising outcome, given that Fe has thus far been considered to be the “active” component of Fe@Au nanoparticles. Instead, we have found that the Au coatings, previously considered only as a passivating coating to protect the Fe cores from oxidation, significantly enhance the cytotoxicity of Fe@Au in certain CRC cells. Therefore, we conclude that both the Fe and Au in these core–shell nanoparticles are essential for the anticancer properties observed in CRC cells.
Introduction
With the development of nanomedicine, magnetic nanomaterials have great potential for use as a combined therapeutic and diagnostic tool in medical applications, especially in cancer treatment.Citation1–Citation3 In diagnostic applications, magnetic nanomaterials can be detected by magnetic resonance imaging (MRI)Citation4,Citation5 and X-ray computed tomography (CT).Citation5 In therapeutic applications, metallic nanomaterials can not only serve as drug carriers,Citation6 but they can also be applied as thermotherapeutic probes under radial high-frequency fields.Citation7 Among those current magnetic nanomaterials, iron oxide-based nanoparticles have a key advantage with high biocompatibility.Citation3,Citation8,Citation9 Indeed, iron oxide-based nanoparticles used as MRI contrast agents were among the first approved clinical nanomaterials.Citation10
Nevertheless, elemental iron has a much larger magnetic susceptibility than iron oxides; therefore, it has immense potential if it is able to be stabilized in a nanoscale form. As a result, Carpenter et al designed iron nanoparticles passivated by a gold coating in order to stabilize the iron core and delay its oxidation.Citation11,Citation12 These iron core–gold shell nanoparticles (Fe@Au) have been proposed for use as MRI contrast agents,Citation13 CT contrast agents,Citation14 molecular diagnostic tools,Citation15 magnetic guidable drug-carriers,Citation14 and thermotherapeutic probes.Citation16 Intriguingly, our previous research demonstrated that Fe@Au showed cancer-preferential cytotoxicity toward oral cancer in vitro and in vivo, which was caused by the nonoxidized iron in the nanoparticles.Citation17 Furthermore, we determined that the nanoparticles caused their cytotoxic effect in OECM1 through mitochondria-mediated autophagy.Citation18 Similarly, Thurber et alCitation19 have demonstrated that Fe doping of ZnO nanoparticles improved their ability to selectively kill leukemia cells. They suggested that pure iron possesses potential as a cancer-selective anticancer agent, in accordance with our results.
Although Fe@Au nanoparticles show a similar cancer-preferential cytotoxicity in colorectal cancers (CRC), it seems that CRC is much more resistant to Fe@Au treatment, compared with oral cancer cells.Citation17 However, the underlying mechanism of CRC resistance to the Fe@Au treatment is still unclear. Unraveling the puzzle of differential responses of different cancer types to Fe@Au treatment should lead to more efficient anticancer strategies in the future. Therefore, the research presented here aims to investigate the differential response of CRC to Fe@Au treatment. We first investigated the underlying molecular mechanisms of the cytotoxicity induced by Fe@Au in CRC and then explored the role of different elements in anticancer properties that we observed.
Materials and methods
Synthesis of Fe@Au and Fe nanoparticles
The core–shell structures were synthesized and characterized by using a sequential synthesis technique provided by reverse micelles in a cetyltrimethylammonium bromide (CTAB), n-butanol and water system.Citation17,Citation18,Citation20–Citation23 The Fe nanoparticles were synthesized by two microemulsion solutions ([water]:[detergent] = 2.54). Briefly, the size of the particles was controlled by the molar ratio of the water to surfactant (ω = [H2O]/[CTAB]). The reaction process was carried out under flowing argon gas. In the first step, two microemulsion solutions were prepared using 0.2 M FeSO4 (aqueous [aq]) (catalog number F8633, Sigma-Aldrich, St Louis, MO, USA) and 0.5 M NaBH4 (aq) (catalog number 480886, Sigma-Aldrich), respectively, in a ratio of ω = 2.54. These solutions were mixed together using a magnetic stirrer at a speed of 260 rpm, and the solution turned black upon the reduction of the iron. In the second step, the shell of gold was synthesized. Two additional micellar solutions were prepared using 0.05 M HAuCl4 (aq) (catalog number 254169, Sigma-Aldrich) and 0.8 M NaBH4 (aq), respectively, with ω = 3.8. These solutions were purged by argon to minimize the oxygen contamination caused during oxidation of the iron core. These solutions were added to the reaction mixture from Step 1. In this case, the size of micelles in Step 2 solutions was increased slightly (ω = 3.24), within the reaction mixture to allow for the growth of gold shell on the core. The reaction was stirred under flowing argon for 2 hours. The nanoparticles were ultrasonically washed in argon-purged ethanol three times and then magnetically collected. The particles were then dried under vacuum and sealed in argon. The Fe nanoparticles were synthesized in a similar way; however, only two microemulsion solutions with 0.05 M of FeSO4 (aq) and 0.5 M of NaBH4 (aq) were combined to form Fe nanoparticles, as described in Step 1.Citation24,Citation25 The Fe nanoparticles were then washed and recovered in the argon-purged absolute ethanol solutions for the following experiments.
Cell lines
The OECM1 cell line, established from a male Taiwanese oral cancer patient with a betel nut chewing history,Citation26 was cultured in Roswell Park Memorial Institute medium (RPMI) 1640 (catalog number 72400047, Invitrogen, Carlsbad CA, USA), supplemented with 10% fetal bovine serum (FBS) and antibiotic-antimycotic (AA) reagent (catalog number 15240-062, Invitrogen). The human colorectal cancer cell lines Caco-2, HT-29, and SW480 were obtained from American Type Culture Collection (ATCC; Middlesex, UK). Caco-2 and HT-29 cells were kept in Advanced Dulbecco’s Modified Eagle’s Medium (catalog number 12491023, Invitrogen), supplemented with 10% FBS, 2 mM of L-glutamine (catalog number 35050–079, Invitrogen), and 1×AA. The SW480 cells were grown in L-15 (Leibovitz) medium (catalog number 11415–064, Invitrogen), supplemented with 10% FBS and AA. For the media-substitution experiments, Caco-2, HT-29, and SW480 were first cultured in a mixture of original culture medium and RPMI 1640 in a ratio of 3:1 for 2 days, followed by 1:1 for 2 days, and 1:3 for another 2 days. Then, the cells were cultured in pure RPMI 1640 medium.
WST-1 cytotoxicity assay
To evaluate the cytotoxicity of Fe@Au nanoparticles, cells growing in the log phase were seeded at a density of 5,000 cells per well in a 96-well culture plate. Prior to each in vitro experiment, particles were resuspended in phosphate-buffered saline (PBS) at 10 mg/mL as the stock solution. The 3-methyladenine (3-MA) (catalog number M9281, Sigma-Aldrich) was prepared at a concentration of 200 mM, as 20× stock solutions in PBS, and stored at −80°C. The 3-MA was dissolved by heating prior to usage, at a final concentration of 10 mM cyclosporin A (CsA) (catalog number C3662, Sigma-Aldrich) was prepared at a concentration of 5 mM as 1,000× stock solutions in dimethyl sulfoxide (DMSO); it was then stored at −20°C. Cells were cultured and treated with different concentrations of nanoparticles or an assigned cotreatment. In our previous study, the best time for assessing cell viability was 48 hours after the treatment;Citation17,Citation18 therefore, we tested for cell viability at the 48 hour time point throughout this experiment. The cell viability tests were performed by the WST-1 (water-soluble tetrazolium salt) cytotoxic assay, according to the user manual (catalog number 630118, Clontech Laboratories, Madison, WI, USA).Citation27,Citation28 Briefly, treated cells were washed with PBS and incubated in medium containing WST-1 at the working concentration as instructed in the user manuals. After 2 hours, the change in optical absorbance was recorded in a microplate reader at 450 nm (Sunrise Absorbance Reader, Tecan, Männedorf, Switzerland), with 650 nm as the reference wavelength. The half maximal inhibitory concentration (IC50) was calculated mathematically by extrapolation.Citation18
Bright-field microscopy
To assess cell morphology, cells were seeded on number 1, 13 mm diameter glass coverslips (catalog number G402, Pro-SciTech Proprietary Limited Kirwan, QLD, Australia) and allowed to attach for 24 hours. Cells were then treated with Fe@Au for 24 hours. OECM1 cells were treated with 10 μg/mL Fe@Au, while CRC cells were treated with 50 μg/mL, which are about the half-maximal inhibitory doses. Cells were washed and fixed in 4% paraformaldehyde in PBS for 15 minutes. Cells were then mounted on the glass slides and sealed with nail polish for imaging with differential interference contrast (DIC) microscopy (FV-1000, Olympus Corporation, Tokyo, Japan).
Scanning electron microscopy
Cells were grown on 13 mm Thermanox™ coverslips (catalog number 26028, Thermanox, Nunc, Rochester, NY, USA) and then treated for 24 hours with a corresponding concentration of Fe@Au (ie, 10 μg/mL Fe@Au for OECM1 or 50 μg/mL Fe@Au for CRC). Cells were then fixed with 2% glutaraldehyde (catalog number G5882, Sigma-Aldrich) for 1 hour at 4°C. Samples were washed twice in PBS, followed by secondary fixation in 1% osmium tetroxide in PBS for 1 hour at 4°C, in the absence of light. Subsequently, samples were dehydrated in graded ethanol solutions. Cells were soaked in 30%, 50%, 70%, 80%, 90%, and 95% ethanol for 5 minutes each and then 100% ultrapure ethanol for 5 minutes; with the soak in 100% ultrapure ethanol repeated twice more. The specimens were then immersed for 3 minutes in 100% hexamethyldisilazane (HMDS) (catalog number H4875, Sigma-Aldrich). Dried samples were then coated with 5 nm of platinum by using a sputter coater (EmiTech K550X; GaLa Instrument, Bad Schwalbach, Germany).
Apoptosis and necrosis assay
The apoptotic and necrotic cells were analyzed with the Dead Cell Apoptosis Kit (catalog number V13245, Invitrogen), following the manufacturer’s instructions.Citation29 Cells treated with 10 ng/mL tumor necrosis factor (catalog number 210TA, R&D Systems, Minneapolis, MN, USA) and 1 μg/mL of cycloheximide (catalog number 01810, Fluka Chemie, GmbH, Deisenhofen, Germany) for 4 hours were used as the positive control for apoptosis. Briefly, the treated cells were harvested in cold PBS and stained with propidium iodide (PI) and Alexa Fluor® 488 annexin V. After 15 minutes, the stained cells were analyzed by flow cytometry (FACScan, BD Biosciences, Franklin Lakes, NJ, USA), measuring the fluorescence emission at 530 nm and 575 nm under 488 nm excitation.
Quantification of Fe@Au internalization via inductively coupled plasma optical emission spectrometry
The 500,000 OECM1 and CRC cells were seeded on plastic culture dishes (catalog number 5550300, Milian USA, Gahanna, OH, USA) and allowed to adhere for 24 hours. Fe@Au nanoparticles were added to the culture medium at a final concentration of 50 μg/mL. The cells were then washed, counted, and dissolved in a mixture of 70% nitric acid (catalog number 84382, Sigma-Aldrich) and 36% hydrochloric acid (catalog number H7020, Sigma-Aldrich) in a volume ratio of 2:3. Samples were digested at 60°C for 4 hours. Later, the digested samples were analyzed for iron and gold content by using inductively coupled plasma optical emission spectrometry (ICP-OES) (OPTIMA 7300; PerkinElmer, Waltham, MA, USA).
Flow cytometry
To assess cell-cycle progression, cells were harvested by using 0.25% trypsin with 1 mM of ethylene diamine tetraacetic acid (EDTA) (catalog number 25200-256, Invitrogen) and fixed in 70% ice-cold ethanol overnight. The fixed cells were then centrifuged to thoroughly remove the ethanol. Subsequently, the cells were washed twice in 5 mL PBS and resuspended in 1 mL of PI-staining solution for 15 minutes at 37°C. The staining solution comprised 20 μg/mL PI (catalog number 81845, Sigma-Aldrich), 0.1% Triton X-100 (catalog number T8787, Sigma-Aldrich), and 0.2 mg/mL of RNase A (catalog number R4642, Sigma-Aldrich) in PBS. Samples were subsequently analyzed by using flow cytometry (FAC-Scan, BD Biosciences).
For flow cytometry studies to assess mitochondrial membrane potential, JC-1 (5,5,6,60-tetrachloro-1,10,3,30-tetraethylbenzimidazolylcarbocyanine) was used to estimate the polarization status of mitochondria. The aggregated form of JC-1 has maximal absorption and emission at 585 nm and 590 nm, respectively, while the monomer occurs at 510 nm and 527 nm. Staining was performed by using a mitochondria-staining kit (catalog number CS0390, Sigma-Aldrich), according to standard instructions. Briefly, cells were treated with their specific IC50 drug concentration for an assigned period of time. OECM1 cells were treated with 10 μg/mL of Fe@Au, and CRC cells were treated with 50 μg/mL of Fe@Au. Later, cells were harvested stained with the kit, and analyzed by flow cytometry at the 530 nm and 590 nm emission wavelengths.
Statistical analysis
Data are presented as means or means ± standard error (SE). Statistical differences were evaluated using analysis of variance and Student’s t-test. The P-values are provided in context when above 0.0001. All data were obtained from at least three independent experiments.
Results
Differential cytotoxicity of Fe@Au in CRC cells
The Fe@Au nanoparticles used in this study have been carefully characterized and reported in our previous studies,Citation17,Citation18 during which we found that CRC cells were less sensitive to Fe@Au treatment than oral cancer cells.Citation17 Therefore, the oral cancer cell line OECM1 was used in this study as a positive control for the in-depth assessment of the cancer-specific cytotoxicity of Fe@Au across the different cancer cell lines investigated. Caco-2, HT-29, and SW480 colorectal adenocarcinoma cells were used in this study to investigate the different response of CRC versus oral cancer to Fe@Au treatment for 48 hours. As shown in , the IC50 of OECM1, Caco-2, HT-29, and SW480 cells is 3.5, 42.9, 80.5, and 39.0 μg/mL, respectively. Although the nanoparticles caused a dose-dependent cytotoxic response both in the CRC and OECM1 cells after 48 hours, the CRC cells were at least an order of magnitude less sensitive, based on IC50 dosage, to Fe@Au treatment than OECM1 cells (Caco-2, P = 0.0253; HT-29, P = 0.0376; SW480, P = 0.0601; compared to OECM1, t-test).
Figure 1 Bar graph illustrating the different cytotoxicity of Fe@Au nanoparticles in CRC and OECM1 cells, as assessed with the WST-1 assay.
Notes: The CRC cell lines Caco-2, HT-29, and SW480 are directly compared with the OECM1 oral cancer cell line. From this graph, it becomes clear that CRC cells are less sensitive to Fe@Au treatment (Caco-2 cells, P = 0.0253; HT-29, P = 0.0376; SW480, P = 0.0601; t-test), compared to OECM1 cells.
Abbreviations: CRC, colorectal cancer; Fe, iron; Au, gold; WST-1, water-soluble tetrazolium salt.
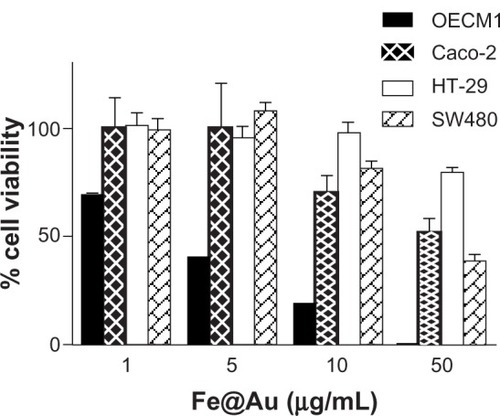
In the subsequent experiments, we applied doses of 10 μg/mL and 50 μg/mL of Fe@Au to treat OECM1 and CRC cells respectively; these concentrations are close to the half-maximal inhibitory doses for the cell lines. Using a single dose of Fe@Au in different CRC cells facilitates the scientific comparison between different cell lines and different experiments.
Cell death and cell cycle analysis in Fe@Au treated cells
Under bright-field microscopy () and high-resolution SEM (), no structural difference in cell morphology was found when cells were treated for 24 hours – the time window to observe apoptosis and necrosis morphologicallyCitation30,Citation31 – and this was comparable to control conditions. The density of cells markedly decreased upon Fe@Au exposure, which is in accordance with the results shown in . However, the molecular analysis of cells for apoptosis and necrosis showed that there was no statistically significant increase in the rate of apoptosis or necrosis in Fe@Au-treated cells (). The slight, nonsignificant increase in apoptotic and necrotic cells clearly cannot account for the dramatic decrease in overall cell viability observed in .
Figure 2 The bright-field optical images show the morphology of Fe@Au-treated cells.
Notes: Except for a different cell density, the CRC and OECM1 cells show no significant alteration in overall morphology after 24 hours of Fe@Au exposure. All images were recorded at the same magnification. Scale bar, 100 μm.
Abbreviations: CRC, colorectal cancer; Fe, iron; Au, gold.
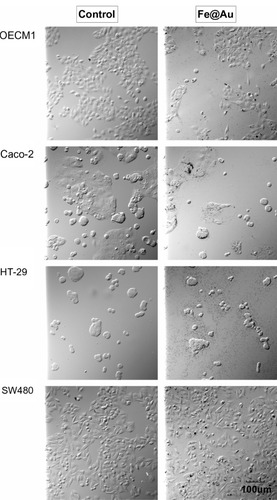
Figure 3 Fe@Au-treated cells visualized under intermediate- and high-magnification scanning electron microscopy.
Notes: At both magnifications, no significant fine-structure differences could be observed in the different cancer cells when treated with Fe@Au for 24 hours; ie, all cells remained well attached to the substratum and maintained their typical surface morphology, such as microvilli and numerous lamellipodia, corresponding to control conditions (data not shown). Insets illustrate the presence of discrete Fe@Au clumps (white arrows) on the surface of the cells. Scale bars inset, 1 μm.
Abbreviations: Fe, iron; Au, gold.
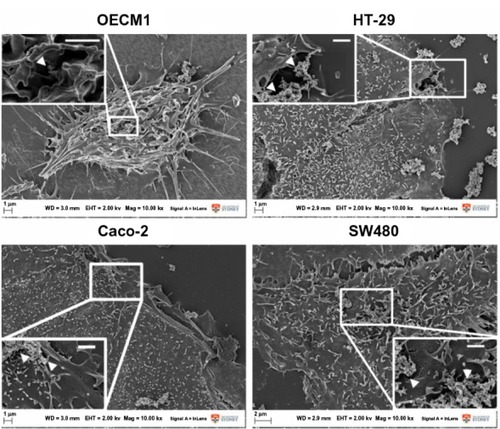
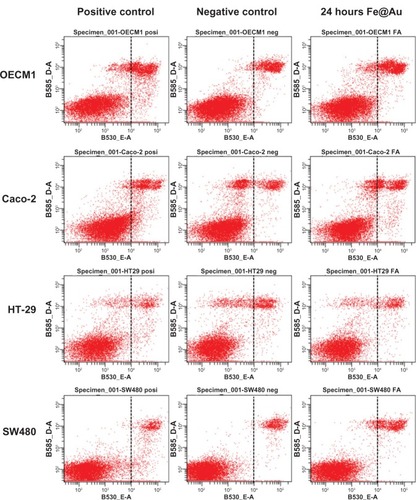
Figure 4 The apoptosis and necrosis of Fe@Au-treated cells were analyzed by flow cytometry.
Notes: The treated CRC cells show only a small increase in the number of apoptotic and necrotic cells. 10 μg/ml Fe@Au was used in OECM1; 50 μg/mL Fe@Au was used in CRC. Cells were treated for 24 hours.
Abbreviations: CRC, colorectal cancer; Fe, iron; Au, gold.
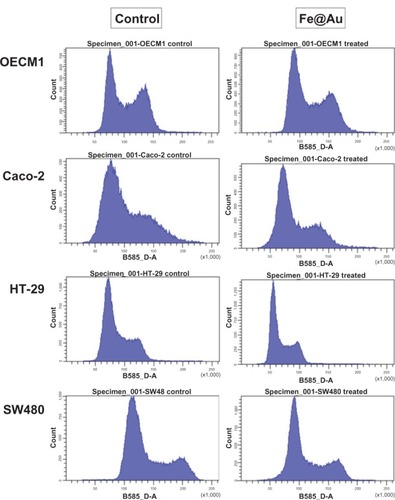
As the Fe@Au treatment diminished cell viability without inducing apoptotic or necrotic cell death, the inhibition of cell growth must therefore be considered. In our previous work, we demonstrated that Fe@Au retarded cell growth at the S-phase rather than causing cell death in OECM1 cells after a 24-hour treatment.Citation17 Therefore, we next analyzed the cell cycle profile of Fe@Au-treated CRC. In , OECM1 cells show S-phase delay, as found in our previous report.Citation17 Intriguingly, Fe@Au caused a G1/G0 delay in CRC cells. Therefore, the decreased cell survival rate of Fe@Au-treated CRC cells is the result of growth inhibition, rather than cell death, which is consistent with our observations in oral cancer cells.Citation17
Figure 5 The cell cycle of Fe@Au treated cells analyzed via flow cytometry.
Notes: When compared to the S-phase delay of OECM1 cells, Fe@Au-treated CRC cells show a sharper peak at the left after 24 hours of treatment, indicating cell-cycle retardation at the G1/G0 phase.
Abbreviations: CRC, colorectal cancer; Fe, iron; Au, gold.
Fe@Au treatment and assessment of mitochondrial membrane potential
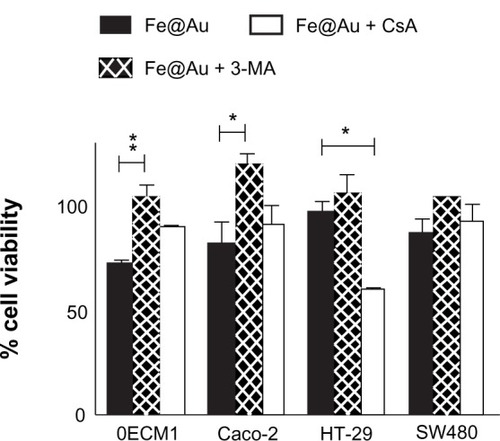
We previously demonstrated that oral cancer cells, including OECM1, exposed to Fe@Au suffered a loss of mitochondria membrane potential in 4 hours and 24 hoursCitation18 and, therefore, induced cytotoxicity via mitochondria-mediated autophagy.Citation17 To investigate whether Fe@Au nanoparticles cause cytotoxicity in CRC cells via a common mechanism, we used flow cytometry to analyze the status of mitochondria in Fe@Au-treated CRC cells. Our data (), however, revealed that Caco-2 cells showed only a minor membrane potential loss after 24-hour treatment, while HT-29 and SW480 cells displayed no loss of membrane potential at all. To further explore the underlying mechanism of the Fe@Au-induced cytotoxicity in CRC, cells were treated with the mitochondria membrane potential transition blocker, CsA, and autophagy inhibitor, 3-MA. As shown in , OECM1 and Caco-2 cells showed a similar response to the nanoparticle treatment. The 3-MA provided significant protection to the OECM1 and Caco-2 cells from the cytotoxicity of Fe@Au, but not to the HT-29 and SW480 cells. However, CsA was found to restore the cytotoxicity of Fe@Au in OECM1 but not in CRC cell lines, in accordance with the JC-1 staining results. This observation suggests that Fe@Au-induced cytotoxicity in HT-29 and SW480 cells occurs via an alternative pathway compared with oral cancer cells.
Figure 6 The mitochondrial response examined before and after Fe@Au treatment.
Notes: Among the CRC cell lines investigated, only Caco-2 cells show a minor increase in mitochondrial membrane potential after 24 hours of treatment. ‘4 hours Fe@Au’ indicates a 50 μg/mL Fe@Au treatment for 4 hours, and ‘24 hours Fe@Au’ indicates a 50 μg/mL Fe@Au treatment for 24 hours.
Abbreviations: Fe, iron; Au, gold; CRC, colorectal cancer.
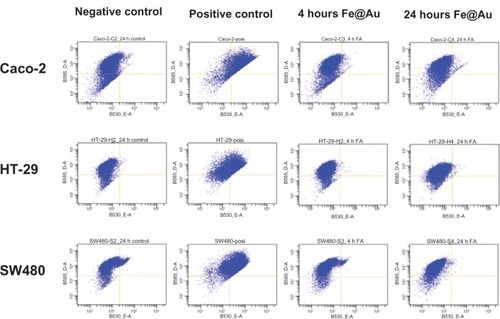
Figure 7 Bar graph illustrating the overall viability of Fe@Au-treated cancer cells, and the influence of the mitochondrial membrane potential blocker CsA and the autophagy inhibitor 3-MA.
Notes: WST-1 cell viability analysis was performed after 48 hours with the assigned treatment; ie, either in the presence with 5 μM CsA or 10 mM 3-MA. The cell viability of Fe@Au + CsA and Fe@Au + 3-MA was calculated according to the matching control conditions of CsA alone and 3-MA alone. *P & 0.05; **P & 0.01; t-test.
Abbreviations: Fe, iron; Au, gold; CsA, cyclosporin A; 3-MA, 3-methyladenine; WST-1, water-soluble tetrazolium salt.
Fe@Au resistance in CRC cells versus oral cancer cells
Next, we explored the amounts of Fe@Au internalized in CRC and OECM1 cells. Fe@Au-treated cells were collected after specific exposure periods of up to 2 hours (internalization of most nanomaterials has been reported to plateau within 2 hoursCitation32,Citation33), and then cells were lysed and analyzed by ICP-OES.
In , at 2 hours posttreatment, Caco-2 cells show the highest amount of internalized Au and Fe, followed by SW480, OECM1, and then HT-29 cells. The highest internalization rate within the first hour occurred in SW480, followed by OECM1, HT-29, and then Caco-2 cells. It is noteworthy that neither the amount nor the rate of Au and Fe internalization explains the differential responses between OECM1 and CRC cell lines, as depicted in . Intriguingly, we found that the internalization profiles of Au and Fe were different between OECM1 and HT-29. In accordance with our previous research,Citation17,Citation18 the nanoparticles served as a package of Fe and Au. The ratio of internalized Au and Fe elements should be constant, on average, and if the cells absorb a large number of unchanged nanoparticles. Intriguingly, when plotting the molar ratio of Fe to Au at different time points (), it becomes apparent that different ratios occur between the different cell lines.
Figure 8 Line graph summarizes the internalization profiles of Fe@Au nanoparticles as assessed by ICP-OES.
Notes: Cells were treated with 50 μg/mL of Fe@Au for the assigned times; the cells were harvested; and the Fe and Au concentration was analyzed. From this graph, it becomes clear that the total amount of internalized Fe or Au is not proportional to the cytotoxicity observed in individual cells.
Abbreviations: ICP-OES, inductively coupled plasma optical emission spectrometry; Fe, iron; Au, gold.
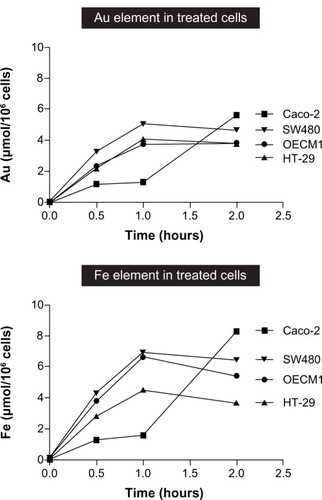
Figure 9 The ratio of internalized Fe and Au elements was explored at different times.
Notes: The molar ratio of Fe to Au is used as an index of internalized elements. In the early time points (30 minutes and 1 hour), the OECM1 cells show the highest Fe:Au ratio. Interestingly, the Fe:Au ratio in HT-29 cells is significantly lower than in OECM1 cells (P = 0.0210; t-test), which correlates with HT-29 cells’ extreme resistance to Fe@Au treatment ().
Abbreviations: Fe, iron; Au, gold.
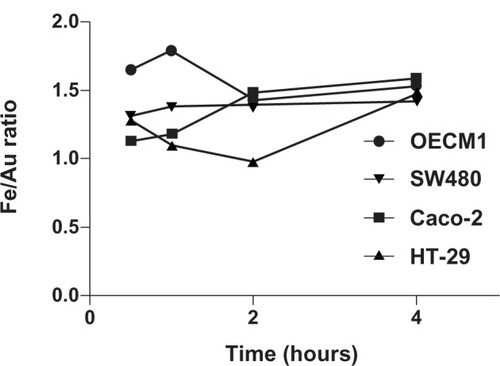
In particular, the Fe to Au ratio of treated HT-29 cells is significantly lower than the ratio of treated OECM1 cells at all-time points investigated (P = 0.0210; t-test). This suggests that the proportion of intracellular Fe and Au plays an important role in the relative sensitivity versus the resistance of cells to Fe@Au treatment.
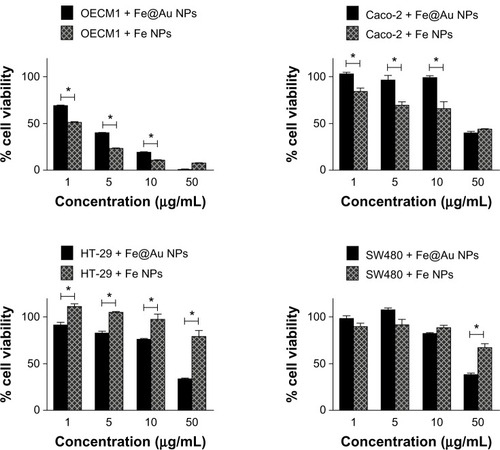
Based on these findings, we propose that the ability of cells to deal with Fe may be the main reason for the different cytotoxic response observed in the cell lines studied. To test this hypothesis, cells were treated with Fe-only nanoparticles. The cytotoxic effect was directly compared with Fe@Au. provides support for this hypothesis, revealing that OECM1 and Caco-2 cells are more sensitive to Fe-only nanoparticles at most concentrations tested. However, the HT-29 cells show a significant resistance to Fe-only nanoparticles (P = 0.0205; t-test). SW480 cells are more resistant to Fe-only nanoparticles than to Fe@Au, only at the concentration of 50 μg/mL (P = 0.0041; t-test). This observation supports the idea that the resistance to Fe-only nanoparticles is highly correlated to the relative sensitivity or resistance of the different cells to the Fe@Au nanoparticles. We also noticed that the presence of Au in Fe@Au nanoparticles seems to play an important role in the Fe@Au-induced cytotoxicity in the Fe-resistant HT-29 and SW480 cells.
Figure 10 Cytotoxic response of different cell lines shows different sensitivity toward Fe@Au or Fe-only nanoparticle treatments.
Notes: CRC and OECM1 were treated with Fe-only nanoparticles (Fe NPs) and Fe@Au nanoparticles (Fe@Au NPs) for 48 hours, analyzed by WST-1. OECM1 and Caco-2 are more sensitive to Fe nanoparticles; whereas, the other CRC, (HT-29 and SW480) are more resistant to Fe nanoparticles than to Fe@Au nanoparticles. (*P & 0.05; t-test).
Abbreviations: Fe, iron; Au, gold; NPs, nanoparticles; WST-1, water-soluble tetrazolium salt; CRC, colorectal cancer.
Discussion
In this study, we investigated the mechanisms of CRC cell resistance to treatments with Fe@Au nanoparticles and directly compared the responses with the Fe@Au-sensitive OECM1 oral cancer cell line. We found that Fe@Au retards growth in both CRC and OECM1 cell lines, but the Fe@Au-treated CRC cells are arrested in G1/G0 phase, rather than in the S-phase, as observed in the treated OECM1 cell line. Furthermore, we observed that the mitochondrial responses to the Fe@Au treatment were distinct in different CRC cells, with only Fe@Au-treated Caco-2 cells showing any mitochondrial membrane potential loss within 24 hours (). Furthermore, the mitochondria membrane potential blocker, CsA, could not protect the HT-29 and SW480 cells from the damage caused by Fe@Au; while 3-MA significantly restored the Fe@Au induced cytotoxicity in Caco-2 cells (P & 0.05). According to the difference in uptake profiles of Fe and Au (), as well as to the responses to Fe-only nanoparticle treatment (), Caco-2 cells were found to be more sensitive to Fe alone compared to the other two CRC cell lines. Hence, Fe@Au nanoparticles apparently induce cytotoxicity in HT-29 and SW480 cells through pathways different to the ones observed in OECM1 cells and to Caco-2 cells. Given these results and the previously demonstrated importance of Fe in the cancer-preferential cytotoxicityCitation17 that occurs in Fe@Au-sensitive cells, it seems evident that the cells better able to deal with Fe will display greater resistance to Fe@Au treatment.
It has been reported previously that Au is highly biocompatible in the majority of biomedical research settings.Citation23,Citation34 Yet, in this study, we were able to demonstrate that Au plays another role besides acting as the passivation layer on the Fe-core nanoparticles, as Au was found essential for the toxicity of Fe@Au in cell lines, such as HT-29 and SW480, which are resistant to Fe-only treatments. It is interesting to note that the work concerning the cytotoxicity and/or biocompatibility of Au was mostly performed in cancer cell lines.Citation35
There are two possible explanations: (1) the Au keeps a higher level of nonoxidized Fe in the Fe@Au nanoparticles, leading to higher redox activity within the cells than the Fe-only NPs, and that this accounts for the preferential effects of the coated NPs; and/or (2) there is some synergistic effect of the Au and Fe elements and/or ions within the cells.
Our research also suggests that the resistance to Fe@Au treatment may rely on the ability to cope with Fe. Fe-resistant cells may either have a more robust mitochondrial system or a more effective efflux system, such as ferroportin, to eliminate the Fe. Ferroportin is a protein that serves as a transmembrane ion channel to enable Fe efflux from cellsCitation36 and is expressed in hepatic cells, macrophages, and also in enterocytes.Citation37 More research is needed to further investigate this hypothesis and elucidate the full mechanisms of Fe@Au sensitivity in cancer cells.
Conclusion
In our previous study, nonoxidized Fe in Fe@Au nanoparticles was found to play an essential role in the cancer-preferential cytotoxicity of Fe@Au in oral cancer models, in vitro and in vivo. Here, Fe@Au nanoparticles have demonstrated a similar, but less intensive, cytotoxicity in CRC cells. We found that the cytotoxicity of the nanoparticles was lower in particle CRC cells that were able to reduce their internal levels of Fe. Furthermore, the Au coatings significantly enhanced the cytotoxicity of nanoparticles in selected CRC cells. Therefore, both the Fe core and Au shell of Fe@Au are critical for the anticancer property observed in cancer cells.
Acknowledgments
DBS is indebted to Taiwan National Science Council (grant number 101-2120-M-006-008-, 101-2314-B-006-048-MY3) and the Taiwan Department of Health (grant number DOH101-TD-PB-111-NSC004, DOH102-TD-PB-111-TM017). PCW thanks Taiwan National Science Council for grant support (101-2320-B-006-004). We also thank the Australian Research Council for a Discovery Project Grant (DP0985059) to PT and FB, as well as the Cancer Institute NSW (08/RFG/1-29) for supporting our work. We acknowledge the facilities as well as scientific and technical assistance from staff at the Australian Microscopy and Microanalysis Research Facility at the Australian Centre for Microscopy and Microanalysis, the University of Sydney. All animal studies and human primary cell cultures were performed in accordance with the University of Cheng-Kung Internal Review Board for Ethics and Human Research (ethical approval No 97218).
Disclosure
The authors report no conflicts of interest in this work.
References
- SinghNJenkinsGJAsadiRDoakSHPotential toxicity of superparamagnetic iron oxide nanoparticles (SPION)Nano Rev201015358
- GuptaAKGuptaMSynthesis and surface engineering of iron oxide nanoparticles for biomedical applicationsBiomaterials200526183995402115626447
- ChenBWuWWangXMagnetic iron oxide nanoparticles for tumor-targeted therapyCurr Cancer Drug Targets201111218418921158723
- ShiehDBChengFYSuCHAqueous dispersions of magnetite nanoparticles with NH3+ surfaces for magnetic manipulations of biomolecules and MRI contrast agentsBiomaterials200526347183719115964622
- ChouSWShauYHWuPCYangYSShiehDBChenCCIn vitro and in vivo studies of FePt nanoparticles for dual modal CT/MRI molecular imagingJ Am Chem Soc201013238132701327820572667
- WuPCWangWSHuangYTPorous iron oxide based nano-rods developed as delivery nanocapsulesChemistry200713143878388517300114
- ItoAHondaHKobayashiTCancer immunotherapy based on intracellular hyperthermia using magnetite nanoparticles: a novel concept of “heat-controlled necrosis” with heat shock protein expressionCancer Immunol Immunother200655332032816133113
- JainTKReddyMKMoralesMALeslie-PeleckyDLLabhasetwarVBiodistribution, clearance, and biocompatibility of iron oxide magnetic nanoparticles in ratsMol Pharm20085231632718217714
- KarlssonHLCronholmPGustafssonJMöllerLCopper oxide nanoparticles are highly toxic: a comparison between metal oxide nanoparticles and carbon nanotubesChem Res Toxicol20082191726173218710264
- ReimerPBalzerTFerucarbotran (Resovist): a new clinically approved RES-specific contrast agent for contrast-enhanced MRI of the liver: properties, clinical development, and applicationsEur Radiol20031361266127612764641
- CarpenterEESangregorioCO’ConnorCJEffects of shell thickness on blocking temperature of nanocomposites of metal particles with gold shellsIEEE Trans Magn199935534963498
- CarpenterEESimsJAO’ConnorCJSequential synthesis of gold coated iron nanoparticles using reverse micellesAbstr Paper Am Chem Soc Natl Meet1999218U441
- ChoSJJarrettBRLouieAYKauzlarichSMGold-coated iron nanoparticles: a novel magnetic resonance agent for T1 and T2 weighted imagingNanotechnology2006173640644
- KayalSRamanujanRVAnti-cancer drug loaded iron-gold core-shell nanoparticles (Fe@Au) for magnetic drug targetingJ Nanosci Nanotechnol20101095527553921133071
- ParkHYSchadtMJWangLFabrication of magnetic core@shell Fe oxide@Au nanoparticles for interfacial bioactivity and bio-separationLangmuir200723179050905617629315
- KimDHRozhkovaEARajhTBaderSDNovosadVSynthesis of hybrid gold/iron oxide nanoparticles in block copolymer micelles for imaging, drug delivery, and magnetic hyperthermiaIEEE Transactions, Magnetics2009451048214824
- WuYNChenDHShiXYCancer-cell-specific cytotoxicity of non-oxidized iron elements in iron core–gold shell NPsNanomedicine20117442042721272668
- WuYNYangLXShiXYThe selective growth inhibition of oral cancer by iron core-gold shell nanoparticles through mitochondria-mediated autophagyBiomaterials201132204565457321458061
- ThurberAWingettDGRasmussenJWImproving the selective cancer killing ability of ZnO nanoparticles using Fe dopingNanotoxicology20126444045221635174
- LinJZhouWKumbharAGold-coated iron (Fe@Au) nanoparticles: synthesis, characterization, and magnetic field-induced self-assemblyJ Solid State Chem200115912631
- RavelBCarpenterEEHarrisVGOxidation of iron in iron/gold core/shell nanoparticlesJ Appl Phys2002911081958197
- ZhouWLCarpenterEELinJKumbharASimsJO’ConnorCJNanostructures of gold coated iron core-shell nanoparticles and the nanobands assembled under magnetic fieldEur Phys J D2001161289292
- TshikhudoTRWangZBrustMBiocompatible gold nanoparticlesMaterials Science and Technology2004208980984
- LiFVipulanandanCMohantyKKMicroemulsion and solution approaches to nanoparticle iron production for degradation of trichloroethyleneColloids and Surfaces A: Physicochemical and Engineering Aspects20032231–3103112
- WuLShamsuzzohaMRitchieSMCPreparation of cellulose acetate supported zero-valent iron nanoparticles for the dechlorination of trichloroethylene in waterJ Nanopart Res200574–5469476
- PengYCKuoHSTsaiHDYangYPLinYLThe lethal effect of bis-type azridinylnaphthoquinone derivative on oral cancer cells (OEC-M1) associated with anti-apoptotic protein bcl-2Bioorg Med Chem200614126327216213738
- Wörle-KnirschJMPulskampKKrugHFOops they did it again! Carbon nanotubes hoax scientists in viability assaysNano Lett2006661261126816771591
- SchröterováLKrálováVVoráčováAHaškováPRudolfEČervinkaMAntiproliferative effects of selenium compounds in colon cancer cells: comparison of different cytotoxicity assaysToxicol In Vitro20092371406141119607906
- AllenRTHunterWJ3rdAgrawalDKMorphological and biochemical characterization and analysis of apoptosisJ Pharmacol Toxicol Methods19973742152289279777
- TangWZhangYQianCYuanZDuJInduction and mechanism of apoptosis by hydroxycamptothecin in human Tenon’s capsule fibroblastsInvest Ophthalmol Vis Sci20125384874488022661476
- VangestelCPeetersMMeesGIn vivo imaging of apoptosis in oncology: an updateMol Imaging201110534035821521554
- JiangLLiXLiuLZhangQCellular uptake mechanism and intracellular fate of hydrophobically modified pullulan nanoparticlesInt J Nanomedicine201381825183423674894
- SummersHDHoltonMDReesPWilliamsPMThorntonCAAnalysis of quantum dot fluorescence stability in primary blood mononuclear cellsCytometry A2010771093393921290467
- ChenMYamamuroSFarrellDMajetichSAGold-coated iron nanoparticles for biomedical applicationsJ Appl Phys2003931075517553
- UboldiCBonacchiDLorenziGGold nanoparticles induce cytotoxicity in the alveolar type-II cell lines A549 and NCIH441Part Fibre Toxicol200961819545423
- VyoralDPetrákJHepcidin: a direct link between iron metabolism and immunityInt J Biochem Cell Biol20053791768177316009323
- AbboudSHaileDJA novel mammalian iron-regulated protein involved in intracellular iron metabolismJ Biol Chem200027526199061991210747949