
Abstract
Background
The purpose of this study was to investigate the effect of acute dosing with silver nanoparticles (AgNPs) and identify potential ultrastructural alterations in the liver and kidney and their effect on blood parameters in the albino rat.
Methods
Twenty rats were used to assess the acute effects of AgNPs. Rats in the treatment group were injected intraperitoneally with 0.5 mL of distilled water containing AgNPs at a dose of 2,000 mg/kg body weight followed by a second injection after 48 hours. Control rats received two 0.5 mL doses of distilled water only. After 3 days, blood samples were collected, and the rat kidneys and livers were extracted and processed for electron microscopy to investigate for hematologic and histopathologic alterations.
Results
Renal tubules showed swollen epithelium with cytoplasmic vacuolization, thickening of the basement membrane, and destruction of some mitochondrial cristae. Podocytes showed elongation and swelling of their primary and secondary processes. The basement membrane of the capillary tufts became thicker. The hepatic tissue showed narrowing of the sinusoids, swollen hepatocytes with hypertrophied nucleoli, and accumulation of fat globules in the nucleoplasm and cytoplasm. The hepatic sinusoids showed hypertrophied endothelial and Kupffer. Destructed cristae of some mitochondria, endosomes, and larger lysosomes filled with Ag-NPs were also observed in the Kupffer cells. Significant increases were observed in white blood cell count, lymphocyte count, granulocytes, and hemoglobin. There was a significant increase in serum creatinine, urea, and aspartate and alanine aminotransferases.
Conclusion
To the best of the authors’ knowledge, the ultrastructural changes in renal and liver tissue observed in this study have not been described before. Our results suggest that injection of AgNPs could have severe cytotoxic effects on the structure and function of these organs.
Introduction
Nanoparticles are engineered materials produced within the nanoscale range of 1–100 nm in one or more dimensions.Citation1 Pure silver has the highest electrical and thermal conductivity of all the metals and has low contact resistance. Silver nanoparticles (AgNPs) have unique physical and chemical propertiesCitation2 and have been used in a wide variety of applications.Citation3 AgNPs are the best known nanoproducts,Citation4 have attracted considerable attention as antimicrobial agents,Citation5 and have been incorporated into a number of products, including catheters, clothing, and electrical home appliances due to their high specific surface area and high proportion of surface atoms.Citation6 More utilities were added to numerous consumer products including industrial and food products in addition to biological and health and medical applications.Citation7,Citation8
Nanosilver with a particle size less than 20 nm in diameter has been reported to be effective in the treatment of certain infectious diseases,Citation9 and is effective in retarding growth of bacteria, mold, and harmful spores. It has been reported that silver is re-emerging as a viable treatment option for infections associated with burns, open wounds, and chronic ulcers.Citation10 AgNPs can be ingested directly via water, food, cosmetics, drugs, and drug delivery devices.Citation11 Some investigators have demonstrated that silver ions released from ingested products into the blood can accumulate in body organs and have toxic effects, especially in the liver and kidney.Citation12 However, acute oral or transdermal doses of AgNPs (2,000 mg/kg body weight) in rats, guinea pigs, and rabbits have not resulted in significant clinical signs, mortality, acute irritation, or corrosive reactions affecting the eyes and skin.Citation13 It has been reported that AgNPs are more toxic than other metal nanoparticles, including aluminum, iron, nickel, and manganese,Citation14 but the mechanism of their toxicity is not clear.Citation15
The aim of this study was to assess the biological risks and benefits of AgNPs. We studied the effect of acute dosing with AgNPs in order to identify potential ultrastructural alterations in the liver and kidney and blood parameters in the albino rat, in the hope of shedding light on the biological responses induced by acute dosing, and to assess cellular responses when these nanoparticles are used in biomedical applications.
Materials and methods
Silver nanoparticles
Silver nanopowder with a particle size less than 100 nm and a 99.9% trace metals basis was purchased from Sigma-Aldrich Chemicals, Cairo, Egypt. AgNPs have been dissolved in 0.5% aqueous carboxymethylcellulose (Sigma-Aldrich) were coated with carbon, mounted on an electron microscope grid (200 mesh),Citation16 and visualized using a transmission electron microscope ([TEM]; JEM-100CXII, JEOL Ltd., Tokyo, Japan) operating at 80 kV. However, AgNPS in the injected doses should be distributed more uniformly by sonication for 10 minutes just before injection, to be taken by systemic circulation.
Experimental animals
We purchased 20, 6-week-old male albino rats (weighing 260±5 g) from the animal house of Assiut University, Assiut, Egypt. The rats were randomly assigned to polycarbonate cages (five rats per cage), and acclimatized for 10 days at a temperature of 22°C±0.05°C and 51%±0.5% humidity with a 12/12 hour-light/dark cycle and access ad libitum to fresh tap water and a rodent diet for 2 weeks before the experiment. The experiments were performed in accordance with the research protocols established by the animal care committee of the National Research Center, Egypt.
Administration of AgNPs
Twenty rats were randomly allocated into two groups. Five rats were used as controls and injected intraperitoneally with 0.5 mL of sterile saline solution followed by a second dose after 48 hours. The remaining 15 rats were injected intraperitoneally with AgNPs at a dose of 2,000 mg/kg body weight dissolved in 0.5 mL of distilled water followed by a second injection after 48 hours.Citation13 The rats were euthanized 3 days after the second injection, two blood samples were collected from the left ventricle of each rat under sterile conditions in heparinized tubes for hematology and non-heparinized tubes for biochemistry.
Blood sampling
The blood samples were taken for a complete blood count, including erythrocytes, total leukocytes, hemoglobin, and hematocrit. Serum from the second blood sample was harvested after centrifugation at 5,000 rpm and stored at 20°C until determination of aspartate and alanine aminotransferases, as well as creatinine and urea according to standard methods.Citation17,Citation18
Ultrastructural study
Using 2.5% glutaraldehyde, small slices of kidney and liver tissue were extracted, fixed immediately, rinsed in 0.1 M sodium cacodylate buffer (pH 7.2), postfixed for 2 hours in 1% osmium tetroxide. Then they were rewashed with fresh sodium cacodylate buffer and dehydrated in an ascending series of ethanol. The specimens were embedded in Epon 812.Citation19 Semithin (0.5–1 μm thickness) and ultrathin (700–800 A° thickness) sections were cut using an LKB ultramicrotome (LKB Produkter AB, Ltd., Stockholm, Sweden). The semithin sections were stained with toluidine blue and the ultrathin sections with uranyl acetate and lead citrate. The stained sections were then examined using the JEM-100CXII operating at 80 kV.
Results
Nanoparticle characterization
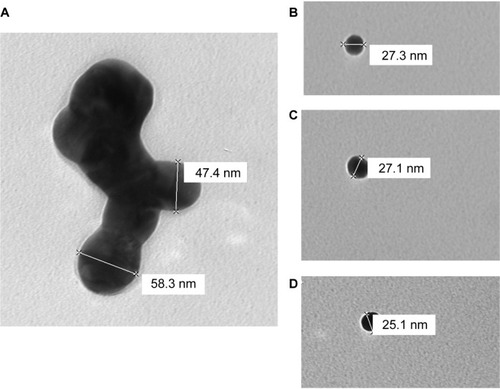
TEM imaging of AgNPs ranging from 20 nm to 65 nm in diameter was performed to confirm primary particle size and general morphology. and show aggregation of AgNPs in the size range of 47–65 nm. However, smaller nanomolecules (less than 30 nm) appeared to exist as solitary entities (–).
Figure 1 Transmission electron micrographs on supportive film showing the morphology of silver nanoparticles used in the experiment and indicating variable dimensions. Scale bars 61.5 and 64.5 nm.
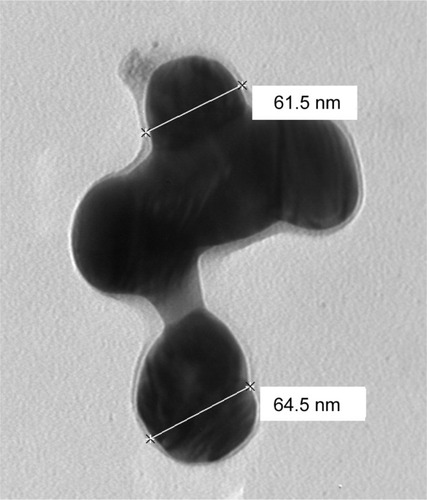
Figure 2 A to D transmission electron micrographs on supportive film showing the morphology of silver nanoparticles used in the experiment and indicating variable dimensions. Scale bars from 25.1–58.3 nm.
Animal symptoms, food consumption, and general activity
No mortality, gross effects, or significant differences in food consumption or body weight were observed during the study period in any of the rats administered AgNPs when compared with the control group. However, treated rats showed a marked decrease in activity.
Histopathologic investigation
The treated animals showed distinct morphological changes in the kidney and liver on microscopic observation when compared with the control group, indicating unhealthy cells.
Kidney
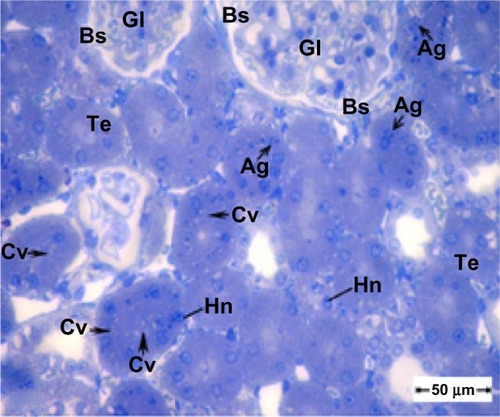
shows the normal histological structure of renal tubules in kidney tissue from the control group. However, the renal cortex in kidney tissue from the treated group shows swollen epithelium and cytoplasm containing numerous membranous vacuoles, with some nuclei showing hypertrophied nucleoli. shows a semithin section of kidney tissue from the treated group, with swelling of the tubular epithelium, cytoplasmic vacuolization, glomeruli with increased cellularity, and obliteration of Bowman’s space.
Figure 3 Semithin section of the kidney tubule tissue from the control group showing normal appearance of the tubular epithelium. Scale bar 50 μm.
Abbreviation: Te, tubular epithelium.
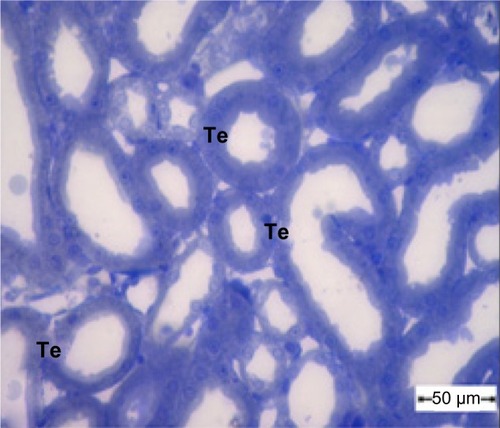
Figure 4 Semithin section of kidney tissue from the treatment group showing swollen tubular epithelium and cytoplasmic vacuolization. Note that the glomeruli show an increase in cellularity and obliteration of Bowman’s space. Scale bar 50 μm.
Abbreviations: Ag, silver nanoparticles; Bs, Bowman’s space; Cv, cytoplasmic vacuolization; Gl, glomeruli; Hn, hypertrophied nuclei; Te, tubular epithelium.
Ultrastructural investigations of renal epithelium from control kidney tissue showed a normal brush border, basement membrane, and intact cell organelles, including mitochondria, nuclei, and a few membranous vacuoles (). The glomeruli showed normal mesangial cells and a normal basement membrane in the capillary tufts, with some red blood cells in their lumen and normal surrounding primary and secondary processes of intact podocytes (). In treated rats, the renal epithelium had a thickened basement membrane, and the cytoplasm showed some mitochondria with destroyed cristae and numerous large membranous vesicles ( and ). The glomeruli showed podocytes with swollen and elongated primary and secondary processes, and the basement membrane of the endothelial cells in the capillary tufts was thickened ().
Figure 5 Transmission electron micrograph of kidney tubule tissue from the control group showing normal ultrastructure of the tubular epithelial cell layer in the basement membrane (arrow head). Note the nucleus, mitochondria, brush border, and membranous vesicles. Scale bar 2 μm.
Abbreviations: b, brush border; m, mitochondria; N, nucleus; v, membranous vesicles.
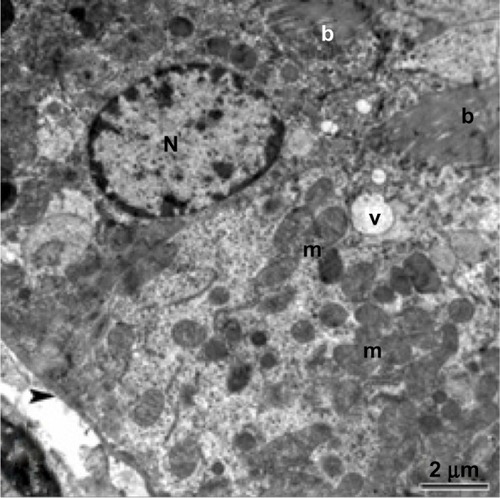
Figure 6 Transmission electron micrograph of kidney glomerular tissue from the control group showing a capillary tuft containing red blood cells, podocytes with primary (star) and secondary (arrows) processes, and mesangial cells. Scale bar 2 μm.
Abbreviations: C, capillary tuft; Ms, mesangial cells; P, podocytes; RBC, red blood cells.
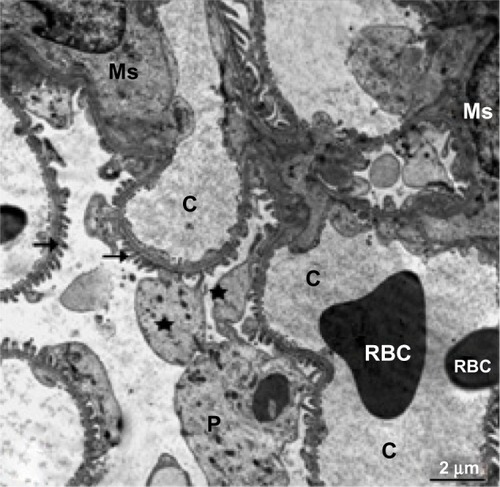
Figure 7 Transmission electron micrograph of kidney tubular epithelium from the treated group showing the nucleus, numerous vesicles, and mitochondria with cristae. The lysosomes are filled with electron-dense nanoparticles varying in size and shape (arrow). Note that the tubular epithelium is lying on a thickened basement membrane (arrow head) and its free surface has a long brush border. Scale bar 2 μm.
Abbreviations: b, brush border; Ly, lysosomes; m, mitochondria; N, nucleus; V, vesicles.
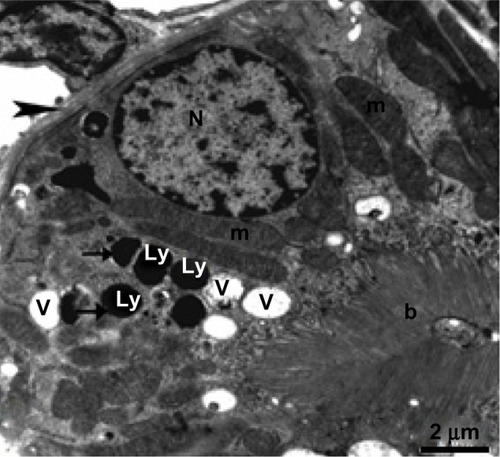
Figure 8 Higher magnification of the previous micrograph showing the nucleus, well developed mitochondria, and membranous vesicles, as well as lysosomes containing electron-dense nanoparticles (thick arrows). Note that some mitochondrial cristae are destroyed (thin arrows). Scale bar 2 μm.
Abbreviations: b, brush border; Ly, lysosomes; m, mitochondria; N, nucleus; Np, nanoparticles; V, membranous vesicles.
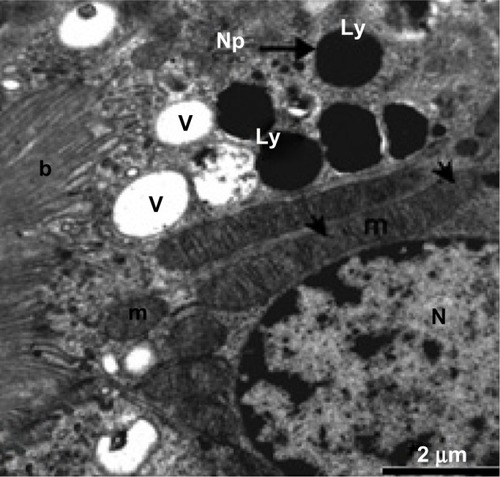
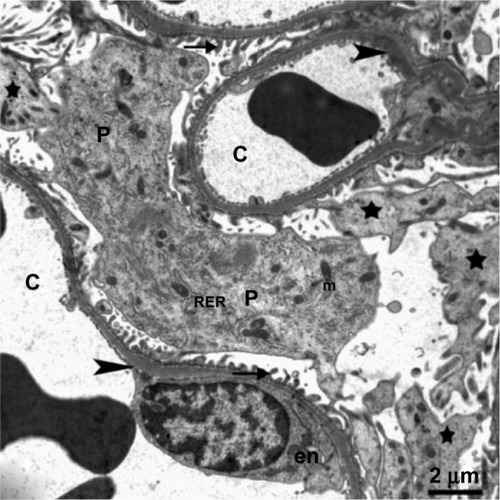
Figure 9 Transmission electron micrograph of kidney glomerular tissue from the treated group showing swollen podocytes with numerous long primary (stars) and secondary processes (arrows) rich in organelles, mitochondria, rough endoplasmic reticulum, and thickening of the basement membrane (arrowhead) in the capillary tuft. The body of an endothelial cell (en) can be seen. Scale bar 2 μm.
Abbreviations: C, capillary; en, endothelial cell; m, mitochondria; P, podocytes; RER, rough endoplasmic reticulum.
Liver
Semithin sections from a sample of control liver tissue demonstrated a normal histological structure (), while semithin sections of treated liver tissue showed narrowing of the sinusoidal lumen and damaged hepatocytes (). Ultrathin sections of treated liver tissue showed swollen hepatic cells, narrowing of the sinusoidal lumen, and appearance of hypertrophied Kupffer cells ().
Figure 10 A semithin section of liver tissue from the control group showing the normal cytoarchitecture of the lobule.
Notes: The central vein is surrounded by hepatic cells separated by blood sinusoids. Scale bar 20 μm.
Abbreviations: Ce, central vein; H, hepatic cells; S, blood sinusoids.
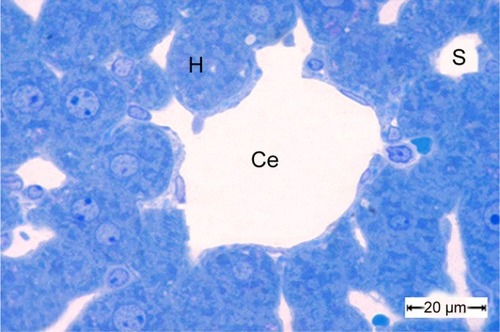
Figure 11 Semithin section of liver tissue from the treated group showing narrowing of the sinusoidal lumen. Scale bar 50 μm.
Abbreviations: H, hepatocytes; Hn, hypertrophied nuclei; Kc, Kupffer cells; s,sinusoidal lumen.
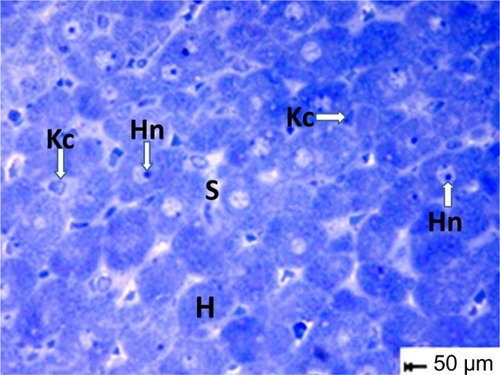
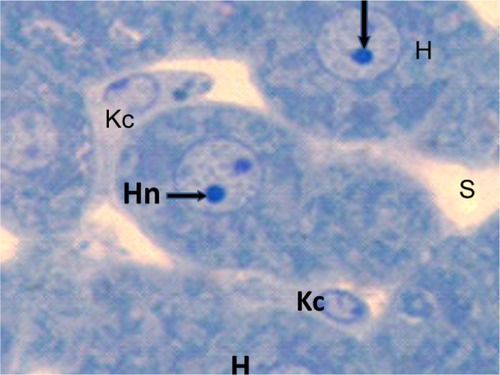
Figure 12 Semithin section of liver tissue from the treated group showing swollen hepatic cells with narrowing of the sinusoidal lumen and hypertrophied Kupffer cells. Scale bar 50 μm.
Abbreviations: H, hepatic cells; Hn, hypertrophied nuclei; Kc, Kupffer cells; s, sinusoidal lumen.
Ultrathin sections from control liver tissue showed normal hepatocytes on TEM. The nuclei had a normal ultrastructural appearance with a distinct nuclear envelope, and the nucleoplasm showed aggregations of euchromatin and heterochromatin granules (). Other intact cytoplasmic organelles could be seen, including spheroid or ovoid mitochondria with well-developed cristae and flattened cisternae of rough endoplasmic reticulum studded with ribosomes; in addition, considerable numbers of glycogen granules were observed in the cytosol (). In contrast, marked cytopathological changes were seen in hepatocytes from the treated group. showed a hepatocyte with strong cytoplasmic vacuolization, numerous intranuclear and intracytoplasmic fat globules of various sizes that appeared swollen, with smaller stacks of fragmented rough endoplasmic reticulum cisternae. Numerous intracytoplasmic and intranuclear fat globules of various sizes were intermingled with mitochondria that appeared swollen with obviously condensed electron-dense matrices and some of them without cristae ( and ). Some Kupffer cells showed numerous membranous vacuoles, fragmented rough endoplasmic reticulum cisternae, endosomes, and a large number of lysosomes filled with AgNPs of different sizes that appear as electron-dense material (–). Disse’s spaces contained fragmented microvilli (, , and ), and the mitochondria showed complete loss of internal ridges and matrices ( and ). shows degenerated hepatic Kupffer cells and nuclei, with destruction of the microvilli in Disse’s spaces and lysosomes filled with AgNPs that appear as electron-dense material.
Figure 13 Transmission electron micrograph of a hepatic cell from the control group showing the normal ultrastructure of the hepatic cell, nucleus, mitochondria, rough endoplasmic reticulum, microbodies, and glycogen granules. Scale bar 2 μm.
Abbreviations: g, glycogen granules; H, hepatic cell; m, mitochondria; mb, microbodies; N, nucleus; RER, rough endoplasmic reticulum.
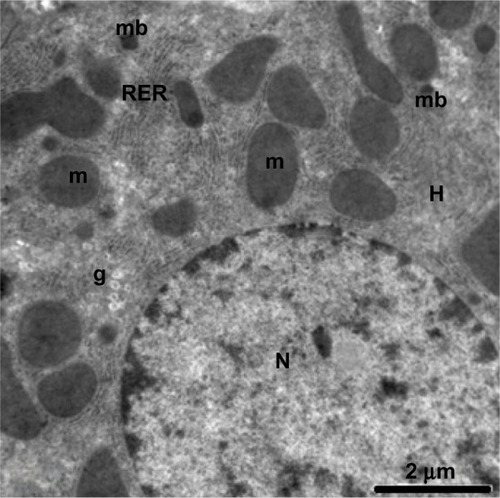
Figure 14 Magnified micrograph of a hepatic cell from the control group showing the normal ultrastructure of the nucleus and its nuclear membrane, containing nucleopores (arrows), well developed rough endoplasmic reticulum, well developed mitochondria, and glycogen granules. Scale bar 500 nm.
Abbreviations: g, glycogen granules; m, mitochondria; N, nucleus; RER, rough endoplasmic reticulum.
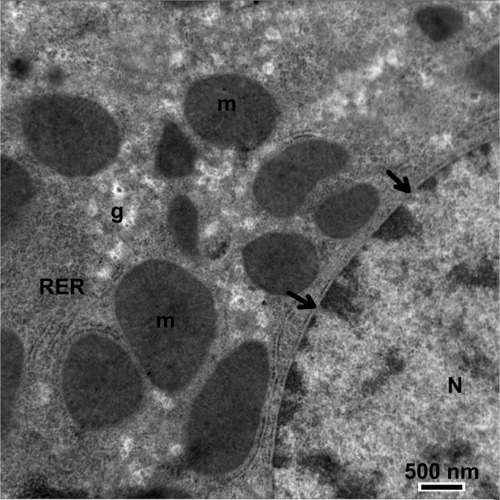
Figure 15 Transmission electron micrograph of a hepatic cell from the treated group containing numerous fat globules and a nucleus with hypertrophied nucleoli. Notice the presence of cytoplasmic vacuolization, the sinusoidal lumen, and Disse’s spaces. Scale bar 2 μm.
Abbreviations: Cv, cytoplasmic vacuolization; Ds, Disse’s spaces; f, fat globules; H, hepatic cell; N, nucleus; ne, nucleoli; S, sinusoidal lumen.
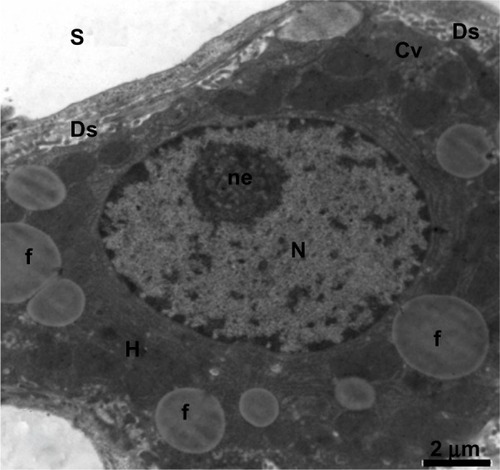
Figure 16 Transmission electron micrograph of a hepatic cell from the treated group showing intranuclear fat globules in the nucleoplasm. Note the well-developed cisternae of the rough endoplasmic reticulum, and the few mitochondria and small membranous vesicles. Scale bar 1 μm.
Abbreviations: f, fat globules; m, mitochondria; RER, rough endoplasmic reticulum; v, membranous vesicles.
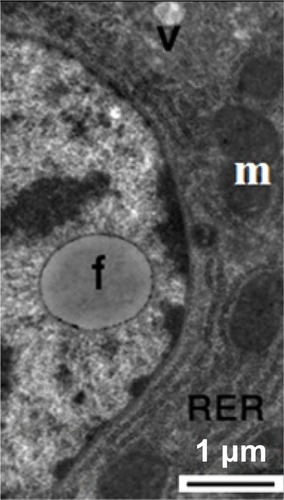
Figure 17 Transmission electron micrograph of a hepatic cell from the treated group showing some lipofuscin pigment, fragmented cisternae in the rough endoplasmic reticulum, and small membranous vesicles. Note the mitochondria. Scale bar 1 μm.
Abbreviations: Lp, lipofuscin pigment; m, mitochondria; RER, rough endoplasmic reticulum; v, membranous vesicles.
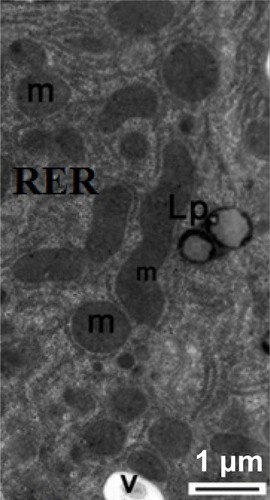
Figure 18 Transmission electron micrograph of a hepatic cell from the treated group containing numerous fat globules, rough endoplasmic reticulum, and mitochondria. Note Kupffer cells containing numerous endosomes and lysosomes filled with electron-dense material of silver nanoparticles (arrows) and the fragmented microvilli in Disse’s space could be seen between the hepatic cell and Kupffer cell. Scale bar 2 μm.
Abbreviations: Ds, Disse’s space; E, endosomes; f, fat globules; H, hepatocyte; Kc, Kupffer cells; Ly, lysosomes; m, mitochondria; N, nucleus; RER, rough endoplasmic reticulum.
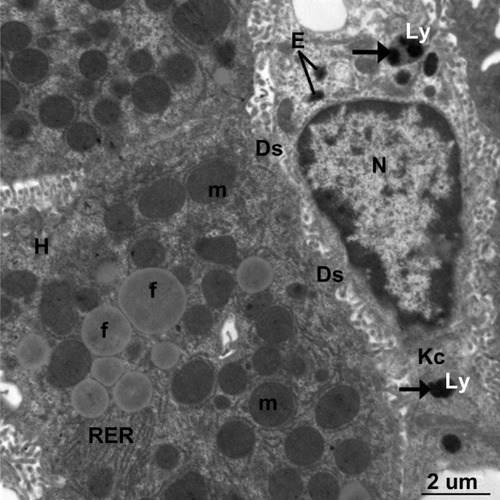
Figure 19 Transmission electron micrograph of a hepatic cell from the treatment group containing a small fat globule and numerous vesicles, fragmented cisternae of rough endoplasmic reticulum, and numerous mitochondria. Also shown is part of a Kupffer cell containing membranous cytoplasmic vacuoles and lysosomes along with electron-dense silver nanoparticles (arrows). Scale bar 2 μm.
Abbreviations: Cv, cytoplasmic vacuoles; f, fat globule; Kc, Kupffer cell; Ly, lysosomes; m, mitochondria; V, vesicles.
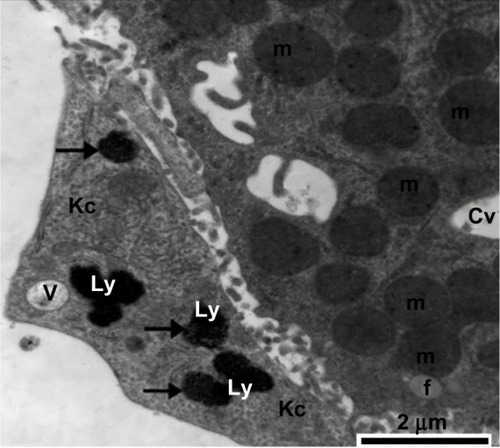
Figure 20 Higher magnification of the previous image, showing lysosomes in Kupffer cells filled with minute electron-dense silver nanoparticles (arrows). Notice the presence of part of a hepatocyte with its microvilli in Disse’s space. Scale bar 500 nm.
Abbreviations: Ds, Disse’s space; H, hepatocyte; Kc, Kupffer cells; Ly, lysosomes.
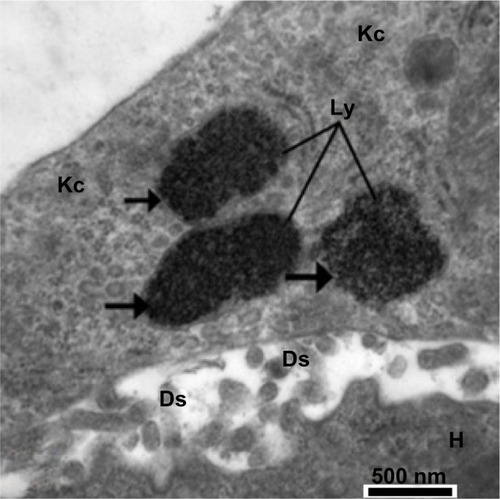
Figure 21 Transmission electron micrograph showing a hepatic cell from the treated group with numerous mitochondria, hypertrophied endothelial and Kupffer cells containing numerous membranous vesicles, and electron-dense silver nanoparticles (arrow) within a lysosome. The blood sinusoid contains an individual red blood cell. Note the fragmented microvilli in Disse’s space. Scale bar 2 μm.
Abbreviations: Ds, Disse’s space; en, endothelial cell; H, hepatic cell; Kc, Kupffer cells; Ly, lysosome; m, mitochondria; N, nucleus; RBC, red blood cell; S, blood sinusoid; V, vesicles.
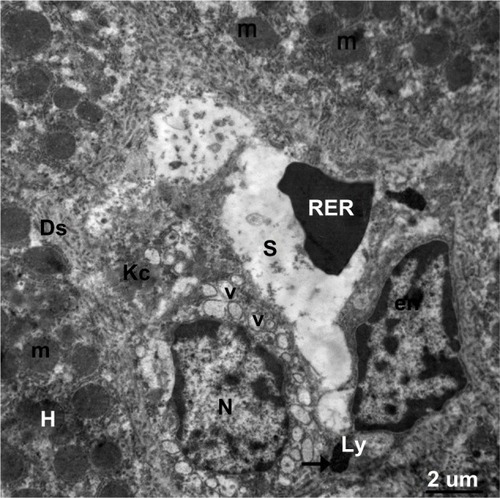
Figure 22 Higher magnification of the previous image, showing a large membranous vacuole, lysosomes in a Kupffer cell filled with minute electron-dense silver nanoparticles (arrow) and mitochondria with destroyed cristae. Note the degenerated nucleus surrounded by a fragmented nuclear envelope (stars). Scale bar 500 nm.
Abbreviations: Kc, Kupffer cell; Ly, lysosome; m, mitochondria; N, nucleus; V, vacuole.
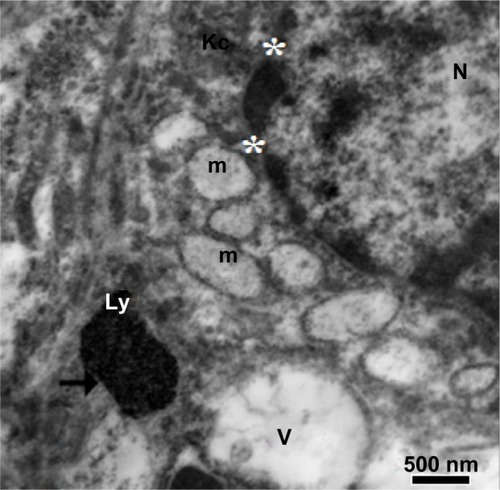
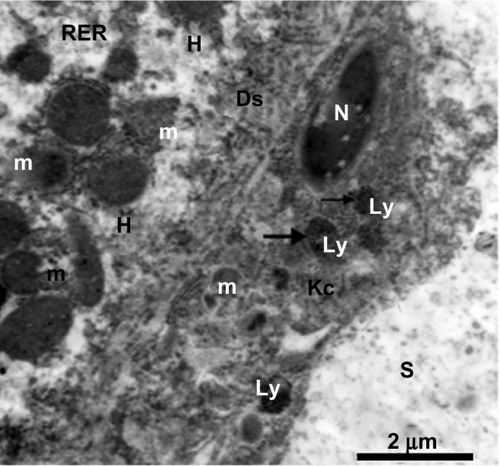
Figure 23 Transmission electron micrograph from the treated group. On the left, there is a cytoplasmic region of a degenerated hepatocyte consisting of numerous degenerated mitochondria, fragmented cisternae in the rough endoplasmic reticulum, and degenerated microvilli in Disse’s space. In the middle, there is a degenerated Kupffer cell containing a degenerated nucleus, degenerated mitochondria, and lysosomes filled with silver nanoparticles appearing as electron-dense material (arrows). Scale bar 2 μm.
Abbreviations: Ds, Disse’s space; H, hepatocyte; Kc, Kupffer cell; Ly, lysosomes; m, mitochondria; N, nucleus; RER, rough endoplasmic reticulum; S, blood sinusoid.
Hematology and biochemistry
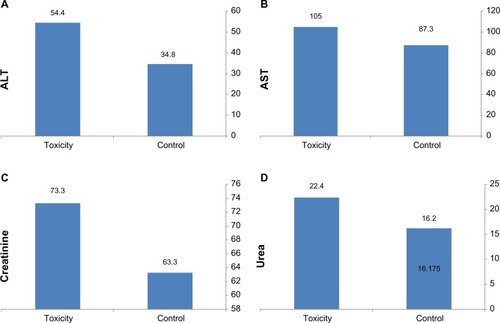
Complete blood count sampling in the treated group showed a significant increase in white blood cells and hemoglobin, with slight changes in red blood cell and hematocrit values (). In comparison with the control group, serum alanine and aspartate aminotransferase levels in the treated group were significantly elevated in comparison with those in the control group (), indicating disruption of liver function. Serum creatinine and urea were significantly increased, indicating changes in kidney function ().
Table 1 Hematology results from control animals and those treated with silver nanoparticles
Figure 24 Biochemical results for control and treated rats. (A and B) Concentrations (U/L) of ALT and AST, respectively. (C and D) Concentrations (mg/dL) of creatinine and urea, respectively.
Abbreviations: ALT, alanine transferase; AST, aspartate transferase.
Discussion
AgNPs have received much attention due to their antimicrobial propertiesCitation20,Citation21 and their potential for application in the treatment of diseases that need a constant drug concentration in the blood or targeting of specific tissue.Citation22–Citation24 Despite these beneficial effects, some studies based on actual data from rat models suggesting that AgNPs may be cytotoxic even at low doses,Citation25,Citation26 potentially increasing reactive oxygen species,Citation6,Citation27 via which phospholipid membranes may be attacked, and decreasing function of the mitochondrial respiratory chain complexes in the liver, brain, and skeletal muscles.Citation28,Citation29 Nanoparticles released into the blood have been shown to accumulate, with toxic effects in the liver, kidney, and heart, causing scattered cytoplasmic vacuolization, appearance of chronic inflammatory cells, and congested and dilated blood vessels.Citation12,Citation30
The AgNPs used in our study appeared to be very uniform with a mostly spherical morphology and a particle size of 20–60 nm. Spherical, triangular, and hexagonal nanoparticles have better antimicrobial and physical properties if they are produced in a small size range.Citation31 Jiang et alCitation32 reported that AgNPs in the 40–50 nm size range demonstrated the best antimicrobial activity. However, sonification of the dose for 10 minutes immediately before injection may prevent aggregation of AgNPs before they can be taken up by the systemic circulation. The present work demonstrates that nonaggregated AgNPs may have increased hepatic and renal toxicity. Once AgNPs aggregate, significant loss of antibacterial activity occurs due to their inability to penetrate the plasma membrane and loss of surface area. (High School Nanoscience Program). Consequently, the decreased stability of AgNPs may lead to loss of their nanoscale properties.Citation33 Further, aggregation of AgNPs decreased their effect and cellular uptakeCitation34 and modifies their bioavailability and toxicity.Citation35
Our study suggests that the toxicity of AgNPs is dose-dependent and time-dependent, with more accumulation of silver in the liver than in the kidneys at 3 days post-injection. Limited tissue clearance was observed after 26 weeks in the liver, spleen, and lungs of mice treated with titanium dioxide nanoparticles.Citation36 However, it has been concluded that the target organs for AgNP toxicity are the liver and kidneys of male and female rats and that deposition of AgNPs in tissue samples is size-dependent.Citation16,Citation37 It has also been demonstrated that different sized and shaped gold nanoparticles have different toxicity.Citation38 Also, the smallest (mean size 2.4 nm) gold nanoparticles were found to be localized in the nucleus,Citation39 and intermediate ones (size 5.5–8.2 nm) were partly delivered into the cytoplasm, causing greater oxidative stress and cytotoxic effects than larger nanoparticles,Citation40 while larger gold nanoparticles (>16 nm) did not enter cells.Citation39 In contrast, no histopathological evidence of tissue damage in response to treatment with gold or titanium dioxide nanoparticles has been observed in murine models,Citation36,Citation41 although the presence of these NPs inside intracellular vacuoles as endosomal containment.
The increased levels of silver in the kidney seen in our study are consistent with published literature showing that subchronic oral dosing with AgNPs induces minimal tubular basophilia in addition to unilateral or bilateral mineralization in the rat kidney.Citation16 Other investigators have reported deposition of ingested silver in the renal tubules, the glomerular basement membrane,Citation16,Citation42–Citation44 and mesangium,Citation45 as well as proliferation of mesangial cells.Citation46 Further, swelling of the renal epithelium and the presence of membranous vacuoles along with hypertrophied nucleoli have been demonstrated in all animals treated with AgNPs.Citation44,Citation47–Citation50 Moreover, the present work suggests increasing glomerular cellularity and swelling of the primary and secondary processes of podocytes which, to the authors’ knowledge, has not been reported before.
With regard to liver toxicity, we found swelling of hepatocytes with prominent hypertrophied nucleoli and narrowing of the sinusoidal lumen. These results are consistent with previous reports of the liver being the target organ for AgNPs and the site at which they preferentially accumulate.Citation11,Citation16,Citation44,Citation51 The liver damage seen in the current study may be explained by: deposition of AgNPs in the hepatic Kupffer cells and endothelial cells lining the sinusoidal spaces;Citation52 inhibition of the mitochondrial respiratory chain that normally produces energy for cells;Citation4,Citation28,Citation53,Citation54 generation of reactive oxygen species associated with inflammatory, oxidative, genotoxic, and cytotoxic events; and induction of apoptosis.Citation29,Citation51,Citation53 Endocytosis of AgNPs by numerous endosomes and lysosomes in Kupffer cells was seen in the present work.
Similarly, our observation of intracellular fat globules in the cytoplasm of hepatocytes is new, although empty vacuole-like spaces have been reported in rats.Citation44 Also, the first-pass effect of AgNPs in the liver resulted in excretion into the bile, inducing bile duct hyperplasia and focal, multifocal, or lobular necrosis.Citation16 Silver had also been shown to be toxic to other organs, including the brain,Citation55 and administration of gold nanoparticles has been associated with dilated interlobular sinusoidal capillaries and congestion of blood between hepatocytes in the liver.Citation46 AgNPs endocytosed by Kupffer cells that appeared in the form of electron-dense materials were reported.Citation43,Citation50
With regard to the mitochondrial injury, this study confirms that the smallest Ag-NPs destructed biomembranes, decreased bioenergetics and adenosine triphosphate (ATP) levels which preceded cell death. Similarly, decreased ATP and creatine kinase levels suggest a potential for metabolic and cell cycle arrest, leading to widespread cell death.Citation50,Citation56
Complete blood counts revealed a significant increase in white cells and hemoglobin in the treated group, along with slight changes in red cell and hematocrit values. Moreover, when AgNPs are injected intravenously, they interact initially with the blood and its components and they may cause various immunogenic responses, inflammation, and changes in hematological parameters, including white cells and platelets.Citation26 The changes in white and red blood cells reported here after the first injection of nanoparticles have been described before, and are possibly due to an increased immunogenic responseCitation26,Citation57,Citation58 or disturbances in signaling pathways and maturation of cells,Citation59 which can affect red blood cells as well as the division and development of other cells.
With regard to biochemistry, significant elevations of serum alanine and aspartate aminotransferase, creatinine, and urea levels were seen, indicating disruptive changes in liver and kidney function. Previous studies have shown that metal nanoparticles alter the levels of various biochemical markers indicating changes in composition of serum enzyme levels,Citation60 suggesting hepatocellular injury, hepatic inflammation, and impairment of kidney function.Citation60,Citation61
Conclusion
The aim of this study was to evaluate the potential toxicity of acute dosing with AgNPs. We found that acute doses of AgNPs were not associated with mortality and didn’t affect the normal activity (behavior) of examined rats. Renal damage was observed, including swollen epithelium in the renal tubules, cytoplasmic vacuolization, hypertrophied nucleoli, thickening of the basement membrane in the glomerular tufts, and reduction of Bowman’s space. On the other hand, liver tissue showed damaged hepatocytes and Kupffer cells with numerous intracellular and intranuclear fat globules, fragmented cisternae in the rough endoplasmic reticulum, and swollen or destroyed mitochondria with complete loss of internal ridges and matrices. It can be concluded that an acute dose of AgNPs will induce significant damage to the structure and function of the liver and kidney, as well as disrupting blood parameters. In this study, the acute dose generated remarkable toxic effect in killing any tumor cells. To protect healthy tissues and to reduce AgNPs toxicity, biodegradable, biocompatible organic substance, polymer matrix or even lipids should be used to encapsulate AgNPs. Further in vivo studies are essential to evaluate the critical concentration needed for AgNPs and to evaluate further ultrastructural effects on the high-energy consuming organs such as brain, skeletal muscles, and heart.
Acknowledgments
We are most grateful to Professor Ali Gab-Allah of the Faculty of Science at the University of Suez Canal in Egypt for his invaluable insights and suggestions. We also owe a tremendous amount of gratitude to Dr Abduraman A Noor, the CEO of Dr Sulub Leadership Center for his invaluable guidance.
Disclosure
The authors report no conflicts of interest in this work.
References
- BarnesCElsaesserAArkuszJReproducible comet assay of amorphous silica nanoparticles detects no genotoxicityNano Lett200883069307418698730
- ThomasKSayrePResearch strategies for safety evaluation of nanomaterials, Part I: evaluating the human health implications of exposure to nanoscale materialsToxicol Sci20058731632116049265
- DrakelPLHazelwoodKJExposure-related health effects of silver and silver compounds: a reviewAnn Occup Hyg20054957558515964881
- ChenXSchluesenerHJNanosilver: a nanoproduct in medical applicationToxicol Lett200817611218022772
- ReddyTKReddySJPrasadEffect of silver nanoparticles on energy metabolism in selected tissues of Aeromonas hydrophila infected Indian major Carp, CatlacatlaIOSR J Pharmacy201334955
- TavaresPBalbinotFde OliveraHMEvaluation of genotoxic effect of silver nanoparticles (AgNPs) in vitro and in vivoJ Nanopart Res201214791
- ManeewattanapinyoPBanlunaraWThammacharoenCEkgasitSKaewamatawongKAn evaluation of acute toxicity of colloidal silver nanoparticlesJ Vet Med Sci2011731417142321712637
- KhodadadiSNaghshNMashayekhAEffect of silver nanoparticle on phosphocreatine kinase and histological changes of skeletal muscle tissue in male Wistar rat Available from: http://congress.mazums.ac.ir/jmums/files/site1/user_files_0d0bf0/t_mousavi-A-10-1466-21-e3892c2.pdfAccessed February 5, 2014
- TiwariDKJinTBehariJDose-dependent in-vivo toxicity assessment of silver nanoparticle in Wistar ratsToxicol Mech Methods201121132421080782
- AtiyehBSCostagliolaMHayekSNDipoSAEffect of silver on burn wound infection control and healing: review of the literatureBurns20073313914817137719
- SardariRRZarchiSRTalebiAToxicological effects of silver nanoparticles in ratsAfr J Microbiol Res2012655875593
- ParkEBaeERepeated-dose toxicity and inflammatory responses in mice by oral administration of silver nanoparticlesEnviron Toxicol Pharm201030162168
- KimJSSongKSSungTHGenotoxicity, acute oral and dermal eye and dermal irritation and corrosion and skin sensitization evaluation of silver nanoparticlesNantoxicology20137953960
- Braydich-StolleLHussainSSchlagerJJHofmannMCIn vitro cytotoxicity of nanoparticles in mammalian germline stem cellsToxicol Sci20058841241916014736
- TangJStatus of biological evaluation on silver nanoparticlesJ Biomed Eng200825958961
- KimYSSongMYParkJDSubchronic oral toxicity of silver nanoparticlesPart Fibre Toxicol2010102020691052
- ReitmanSFrankelSA colourimetric method of serum glutamic oxalo acetic and glutamic pyruvic transaminasesAm J Clin Pathol197528566313458125
- HenryRJClinical Chemistry Principles and Techniques2nd edHagerstown, MD, USAHarper and Row1974
- BozzolaJJRussellLDSpecimen staining and contrast methods for transmission electron microscopyBozzolaJJRussellLDElectron Microscopy Principles and Techniques for BiologistsBoston, MA, USAJones and Bartlett Publishers19925
- ChoiODengKKKimNJRossLJrSurampalliRYHuZThe inhibitory effects of silver nanoparticles, silver ions, and silver chloride colloids on microbial growthWater Res2008423066307418359055
- RupareliaJPChatterjeeAKDuttaguptaSPMukherjiSStrain specificity in antimicrobial activity of silver and copper nanoparticlesActa Biomater2008470771618248860
- MoghimiSMHunterACMurrayJCLong-circulating and target-specific nanoparticles: theory to practicePharmacol Rev20015328331811356986
- PanyamJLabhasetwarVBiodegradable nanoparticles for drug and gene delivery to cells and tissueAdv Drug Deliv Rev20035532934712628320
- AltVBechertTSteinrückePAn in vitro assessment of the antibacterial properties and cytotoxicity of nanoparticulate silver bone cementBiomaterials2004254383439115046929
- KawataKOsawaMOkabeSIn vitro toxicity of silver nanoparticles at noncytotoxic doses to HepG2 human hepatoma cellsEnviron Sci Technol2009436046605119731716
- KimSChoiJEChoiJOxidative stress-dependent toxicity of silver nanoparticles in human hepatoma cellsToxicol in Vitro2009231076108419508889
- HuoYLiGDuanRFPTEN deletion leads to deregulation of antioxidants and increased oxidative damage in mouse embryonic fibroblastsFree Radic Biol Med2008441578159118275859
- CostaCSRonconiJVVDaufenbachJEIn vitro effects of silver nanoparticles on the mitochondrial respiratory chainMol Cell Biochem2010342515620411305
- KimSKimSLeeSCharacterization of the effects of silver nanoparticles on liver cells using HR-MAS NMR spectroscopyBull Korean Chem Soc20113220212026
- AbdelhalimMAGold nanoparticles administration induces disarray of heart muscle; hemorrhagic, chronic inflammatory cells infiltrated by small lymphocytes, cytoplasmic vacuolization and congested blood vesselsLipids Health Dis20111023324122151883
- YasinSLiuLYaoJBiosynthesis of silver nanoparticles by bamboo leaves extract and their antimicrobial activityJournal of Fiber Bioengineering and Informatics2013617784
- JiangWKimBYRutkaJTChanWCNanoparticle-mediated cellular response is size-dependentNat Nanotechnol2008314515018654486
- WeiLQunFangZJiYanLEnvironmental and biological influences on the stability of silver nanoparticlesChinese Science Bulletin20115620092015
- GilbertBOnoRKChingKAThe effects of nanoparticle aggregation processes on aggregate structure and metal uptakeJ Colloid InterfSci2009339285295
- WickPManserPLimbachLKThe degree and kind of agglomeration affect carbon nanotube cytotoxicityToxicolLett2007168121131
- UmbreitTHFranke-CarrollSWeaverJLTissue distribution and histopathological effects of titanium dioxide nanoparticles after intravenous or subcutaneous injection in miceJ Appl Toxicol20123235035722447616
- AustinCAUmbreitTHBrownKMDistribution of silver nanoparticles in pregnant mice and developing embryosNanotoxicology2012691292222023110
- HillyerJFAlbrechtRMGastrointestinal persorption and tissue distribution of differently sized colloidal gold nanoparticlesJ Pharm Sci2001901927193611745751
- OhEDelehantyJBSapsfordKECellular uptake and fate of PEGylated gold nanoparticles is dependent on both cell-penetration peptides and particle sizeACS Nano201156434644821774456
- PanYLeifertARuauDGold nanoparticles of diameter 1.4 nm trigger necrosis by oxidative stress and mitochondrial damageSmall200952067207619642089
- ZhangQHitchinsVMScharandAMHussainSMGoeringPLUptake of gold nanoparticles in murine macrophage cells without cytotoxicity or production of pro-inflammatory mediatorsNanotoxicology2011528429520849214
- MoffatDBCreaseyMThe distribution of ingested silver in the kidney of the rat and of the rabbitActa Anat1972833463554639712
- LoeschnerKHadrupNQvortrupKDistribution of silver in rats following 28 days of repeated oral exposure to silver nanoparticles or silver acetatePart Fibre Toxicol201181821631937
- YousefJHendiHHakamiSFToxicity of silver nanoparticles after Injected intraperitoneally in ratsJ Am Sci20128589593
- DayWAHuntJSMcGivenAPSilver deposition in mouse glomeruliPathology1976820120463934
- TerentyukGNMaslyakovaGNSuleymanovaLVMorphological and biochemical changes after intravenous injection of gold nanoparticlesSPIE Proceedings of 7th international Conference on Photonics and Imaging in Biology and Medicine20097280155163
- DerfusAMChanWCWBhatiaSNIntracellular delivery of quantum dots for live cell labeling and organelle trackingAdv Mater200416961966
- KoganMJBastusNGAmigoRNanoparticle-mediated local and remote manipulation of protein aggregationNano Lett2006611011516402797
- NoginovMAZhuGBahouraMThe effect of gain and absorption on surface plasmos in metal nanoparticlesAppl Phys B200786455460
- AsharaniPVMunGLKHandeMPValiyaveettilSCytotoxicity and genotoxicity of silver nanoparticles in human cellsACS Nano2009327929019236062
- JohnstonHJHutchisonGChristensenFMPetersSHankinSStoneVA review of the in vivo and in vitro toxicity of silver and gold particulates: particle attributes and biological mechanisms responsible for the observed toxicityCrit Rev Toxicol20104032834620128631
- DanscherGLight and electron microscopic localization of silver in biological tissueHistochemistry1981711711867016817
- HussainSMHessKLGearhartJMGeissKTSchlagerJJIn vitro toxicity of nanoparticles in BRL 3A rat liver cellsToxicol In Vitro20051997598316125895
- AsharaniPVHandeMPValiyaveettilSAnti-proliferative activity of silver nanoparticlesBMC Cell Biol2009106519761582
- AhamedMAlsalhiMSSiddiquiMKSilver nanoparticle applications and human healthClin Chim Acta20104111841184820719239
- PaulaMMda CostaCSBaldinNCIn vitro effect of silver nanoparticles on creatine kinase activityJ Braz Chem Soc20092015561560
- DuffinRTranLBrownDStoneVDonaldsonKProinflammogenic effects of low-toxicity and metal nanoparticles in vivo and in vitro: highlighting the role of particle surface area and surface reactivityInhal Toxicol20071984985617687716
- ShinSHYeMKKimHSKangHSThe effects of nanosilver on the proliferation and cytokine expression by peripheral blood mononuclear cellsInt Immunopharmacol200771813181817996693
- GopinathPGogoiSKSanpuiPSignaling gene cascade in silver nanoparticle induced apoptosisColloid Surf B Biointerfaces201077240245
- KimYSKimJSChoHSTwenty-eight-day oral toxicity, genotoxicity, and gender-related tissue distribution of silver nanoparticles in Sprague-Dawley ratsInhal Toxicol20082057558318444010
- LoebWFQuimbyFWThe Clinical Chemistry of Laboratory Animals2nd edPhiladelphia, PA, USATaylor & Francis1999