Abstract
Background
Older mothers are becoming more common in Japan. One reason for this is the widespread use of assisted reproductive technology (ART). This study assesses the relationship between maternal age and the risk of birth defects after ART.
Methods
Nationwide data on ART between 2004 and 2010 in Japan were analyzed. Diseases that were classified as code Q00-Q99 (ie, congenital malformations, deformations, and chromosomal abnormalities) in the International Classification of Diseases, tenth edition, were selected. There were 219,185 pregnancies and 153,791 live births in total ART. Of these, 1943 abortions, stillbirths, or live births with birth defects were recorded. Percentage of multiple birth defects in total birth defects, the prevalence, crude relative risk and 95% confidence interval per 10,000 pregnancies and per 10,000 live births were analyzed according to the maternal age class (ie, 25–29, 30–34 (reference), 35–39, and 40+ years).
Results
Multiple birth defects were observed among 14% of the 25–29 year old class, and 8% among other classes when chromosomal abnormalities were excluded. The prevalence of chromosomal abnormalities per pregnancy and per live birth became significantly and rapidly higher in mothers in the age classes of 30–35 and 40+ years. Nonchromosomal birth defects per pregnancy decreased linearly with advanced maternal age, while the number of nonchromosomal birth defects per live birth formed a gradual U-shaped distribution. The prevalence per pregnancy of congenital malformations of the nervous system was significantly lower with advanced maternal age. The relative risk per live birth was significant regarding congenital malformations of the circulatory system for a maternal age of 40+ years. Some other significant associations between maternal age and birth defects were observed.
Conclusion
Maternal age is associated with several birth defects; however, older maternal age in itself does not produce noticeable extra risk for nonchromosomal birth defects overall.
Introduction
The percentage of mothers over 40 years old has been increasing rapidly, peaking in 2011 at 3.6%. The recent tendency in Japan to marry later is a likely factor in this increase, but so is the widespread use of fertility treatment, including assisted reproductive technology (ART). According to the Japanese ART statistics presented by the Japan Society of Obstetrics and Gynecology (JSOG), the percentage of total ART live births itself increased from 0.2% in 1992 to 2.7% in 2010. The percentages of mothers of live birth neonates who were over 40 years of age in the general population and in the ART population were 2.6% and 10.1% in 2008 and 3.6% and 12.2% in 2010, respectively, a finding that supports the supposition of a recent tendency to marry later due to the availability of fertility treatment.
It is well established that the increasing maternal age has contributed to some adverse obstetric outcomes,Citation1–Citation8 including birth defects.Citation9,Citation10 The effect of older maternal age on obstetric outcomes may be pronounced in the ART population. Both lower and higher maternal age may pose increased risks for birth defects.Citation11–Citation18 For example, older mothers have a higher risk of chromosomal abnormalities,Citation19–Citation22 such as Down syndrome,Citation23–Citation25 but whether they are at excess risk of nonchromosomal birth defects is less clear.Citation17 It is important to have accurate information on maternal age-specific risks of birth defects after ART to gauge the implications of this rise in maternal age for public health, to gauge clinical care needs, and to provide information to couples of childbearing age.Citation16
The purpose of the present epidemiologic prevalence study was to analyze birth defects after ART according to the maternal age class and to examine the excess risk of nonchromosomal birth defects among older mothers.
Materials and methods
Outline of Japanese birth defects data after ART
The method for collecting data is described in detail elsewhere.Citation26–Citation29 Almost all medical institutions performing ART are registered with the JSOG. The JSOG administers questionnaire surveys for these medical institutions. Some of the survey data are presented in simple annual reports of aggregate, not individual, data.
From 2004 to 2010 (the latest), the individual list of all ART pregnancies resulting in birth defects was presented in the annual reports. The presented items are shown in . The mean response rate throughout the 7 years was 99.0% (4233/4274), meaning that a nearly complete database reflecting the current situation of ART and birth defects in Japan could be constructed. The methods of fertility treatment were divided into in vitro fertilization, microinsemination, frozen embryo transfer and others (duplicative methods), and do not include simple ovulation stimulation/enhancement. All methods of fertility treatment were treated as ART in the present secondary data analyses. There were a total of 219,185 pregnancies and 153,791 live births between 2004 and 2010.
Table 1 Demographic and perinatal outcome data of ART pregnancies with birth defect
Diseases that were classified under the International Classification of Diseases, tenth edition (ie, ICD-10, 2003 version) codes Q00-Q99 (ie, congenital malformations, deformations, and chromosomal abnormalities) were regarded as birth defects in the present study. Other congenital diseases that were not classified under Q00-Q99, such as congenital hypothyroidism, were excluded. In total, 1943 abortions, stillbirths, or live births with birth defects (number of fetuses or neonates) consisting of 1637 (84.3%) singletons, 292 (15.0%) twins, nine (0.5%) triplets, and five (0.3%) unknown plurality were included.
Maternal age was distributed normally from 23–46 years, with a mean of 35.2 years, a standard deviation of 4.1 years, a median of 35 years, and a mode of 36 years. The maternal age classes used were as follows: 25–29, 30–34, 35–39, and 40+ years. Patients with a maternal age less than or equal to 24 (n = 5) were excluded. Thus, 1938 fetuses/neonates from 1917 mothers were analyzed. The numbers of pregnancies and live births according to maternal age class were estimated using the age distributions (percentage of each maternal age class) from the 2008 and 2010 data (the only published data). Regression lines for the percentage of each maternal age class were calculated using data from both years, and applied to other years.
Statistical analyses
First, demographic and perinatal outcome data were analyzed according to the maternal age class. Then, the percentages of multiple birth defects were analyzed. Multiple birth defects are defined as two or more unrelated major structural malformations that cannot be explained by an underlying syndrome or sequence.Citation30 Multiple birth defects were analyzed using European Surveillance of Congenital Anomalies (EUROCAT) algorithms,Citation30 that was based on the ICD-10 codes. This algorithm gives explicit coding rules for classification and picks out a small subset of cases of potential multiple birth defects. The etiologic classification was translated into an algorithm that imposes a hierarchical classification according to the ICD codes given for each case.Citation30 All cases are classified into the following four main categories: chromosomal case, syndromes, isolated single anomalies, and potential multiple birth defects.
For the comparison between maternal age class and qualitative variables, such as method of treatment, sex of fetuses/neonates, perinatal outcome, and multiple birth defects, the χ2 test was performed. The significance level was set at 0.05.
Next, the crude prevalence of birth defects per 10,000 pregnancies (number of mothers) and 10,000 live births by disease classification were calculated according to maternal age class. Abortion/stillbirths and plurality were not directly considered in the present study, since these data for the total ART population were not available according to maternal age. In the analysis of birth defects per pregnancy, concordant multiple pairs (cases in which both twins have birth defects or at least two triplets have birth defects, n = 21 pairs) were treated as a whole (namely, 21 pregnancies with birth defects).
The relative risk (RR) and 95% confidence interval (CI) for the birth defect categories according to the ICD-10 were calculated with 30–34 years of maternal age as the reference group. The RR and 95% CI of any birth defects were calculated by including or excluding chromosomal abnormalities. All eleven major categories were analyzed regardless of the number of cases in each. Analyses were performed for birth defects subcategories containing five or more cases in the 40+ age group.
Statistical analysis was conducted using Microsoft Excel 2010 (Microsoft Corporation, Redmond, WA, USA) and SAS for Windows version 9.2 (SAS Institute Inc, Cary, NC, USA).
Results
Demographic and perinatal outcome data of ART pregnancies with birth defects are summarized according to maternal age class in . Sex of the fetuses/neonates differed marginally significantly among maternal age class (P = 0.046). Males were more frequent in the 25–29, 30–34, and 35–39 year age classes, while females were more frequent in the 40+ year age class.
The percentage of multiple birth defects is shown in . The percentage of multiple birth defects gradually and linearly decreased with maternal age class. Isolated single anomalies decreased at ages greater than 35–39 years. The percentage of multiple birth defects was 14% (22/159) in the 25–29 year age class, and all 8% among the 30–34 (47/613), 35–39 (48/625), and 40+ (12/157) year age classes when chromosomal abnormalities were excluded. The difference between the numbers of multiple birth defects and isolated single anomalies according to maternal age class was not statistically significant.
Table 2 Distribution of classification of cases using the EUROCAT computer algorithm according to maternal age class
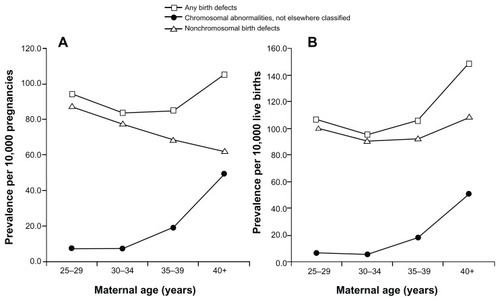
The RRs of any birth defects per pregnancy and per live birth according to maternal age class are shown in , respectively. Regarding the presence of any birth defects per pregnancy, the prevalence of chromosomal abnormalities was constant in the 25–29 and 30–34 year age classes and increased rapidly thereafter, while nonchromosomal birth defects decreased linearly with advanced maternal age; thus the total prevalence across the maternal age distribution had a gradual U-shape. Regarding the prevalence of any birth defect per live birth, the prevalence of chromosomal abnormalities was constant in the 25–29 and 30–34 year maternal age classes and increased rapidly thereafter, while the prevalence of nonchromosomal birth defects was gradual and U-shaped; thus the total prevalence across the maternal age distribution was J-shaped.
Figure 1 Crude prevalence of birth defects according to maternal age, 2004–2010. (A) Prevalence per 10,000 pregnancies. (B) Prevalence per 10,000 live births.
The number, prevalence (per 10,000 pregnancies), RR, and 95% CI of birth defects in different organ systems are shown in . The prevalence of chromosomal abnormalities became significantly higher with advanced maternal age (RR = 2.71, 95% CI 2.01–3.65 for 35–39 years and RR = 6.93, 95% CI 5.08–9.45 for 40+ years). In contrast, the prevalence of nonchromosomal birth defects became significantly lower with advanced maternal age (RR = 0.88, 95% CI 0.79–0.99 for 35–39 years and RR = 0.80, 95% CI 0.68–0.95 for 40+ years). The prevalence of congenital malformations of the nervous system became significantly lower with advanced maternal age (RR = 0.71, 95% CI 0.52–0.98 for 35–39 years and RR = 0.42, 95% CI 0.23–0.78 for 40+ years). The RR was also significant with regard to other congenital malformations of the digestive system in the 25–29 year age class (RR = 1.64, 95% CI 1.01–2.64).
Table 3 Crude birth defect prevalence, RR, and 95% CI in ART according to maternal age class (prevalence per 10,000 pregnancies)
The number, prevalence (per 10,000 live births), RR, and 95% CI of birth defects in different organ systems are shown in . The prevalence of chromosomal abnormality became significantly higher with advanced maternal age (RR = 3.28, 95% CI 2.22–4.85 for 35–39 years and RR = 9.48, 95% CI 6.27–14.35 for 40+ years). The RR was also significant with regard to nonchromosomal birth defects in the 40+ year age group (RR = 1.20, 95% CI 1.01–1.43). The RR was significant with regard to congenital malformations of the circulatory system in the 40+ year age group (RR = 1.40, 95% CI 1.10–1.79). The RR of congenital malformations of the aortic and mitral valves was significant for both the 25–29 year and 40+ year age groups, giving a clear U-shaped prevalence curve. The RR of congenital absence, atresia, and stenosis of the small intestine was also significant for the 40+ year age class (RR = 4.10, 95% CI 1.44–11.69).
Table 4 Crude birth defect prevalence, RR, and 95% CI in ART according to maternal age class (prevalence per 10,000 live births)
Discussion
Given the very limited information provided by the present data, the main purpose of this study was to describe the epidemiologic features of birth defects after ART and maternal age (ie, a descriptive epidemiologic study), not to analyze the possible causes or mechanisms of birth defects controlling for the confounding factors (ie, an analytical epidemiologic study).
Demographic and perinatal outcomes
No special feature of birth defects cases was observed regarding demographic and perinatal outcomes according to the maternal age class, except that female cases were more common in the 40+ year age class. This result does not necessarily mean that the prevalence of birth defects in females in the 40+ year age class was higher compared to other maternal age classes, since the total ART population according to maternal age class and sex was unclear.
Multiple birth defects
The percentage of multiple birth defects was slightly higher in 25–29 year old mothers, but the difference was not statistically significant. The reason for this result was unclear. The classification method of multiple birth defects was not necessarily constant across studies.Citation30 Moreover, the relationship between maternal age and multiple birth defects was not well established.
Maternal age-specific risk of nonchromosomal birth defects
The present percentage of total birth defects after ART may be lower overall compared with that found in other studies, as seen in many reviews.Citation31–Citation33 One possible reason for this was that the cases in the present study were strictly restricted to only ICD-10 Q codes. Nevertheless, the main objective of this study was to evaluate the prevalence of birth defects in different maternal age groups and not to compare the birth defect prevalence across different populations. Therefore, the comparison of birth defects across different maternal age classes may be biased only if there is differential reporting according to maternal age class, which is not likely to occur.
There have been several population-based studies of the relationship between maternal age and total birth defects.Citation11–Citation18 Recently Loane et alCitation16 performed a population-based prevalence study using data from EUROCAT registers in 23 regions of Europe in 15 countries, covering a total of 1.75 million births from 2000 to 2004. According to their results, teenage mothers had the highest prevalence of all nonchromosomal congenital anomalies. The prevalence decreased as maternal age increased, until a slight increase was observed in mothers 40–44 years of age and a further increase was observed in mothers 45+ years of age. The prevalence of chromosomal abnormalities increased extremely with maternal age, especially in the 35–39 year and 40+ year groups. They concluded that higher maternal age is a negligible risk factor for nonchromosomal congenital anomalies, especially when compared to chromosomal abnormalities. Reefhuis and HoneinCitation15 analyzed a total of 1,050,616 singleton infants born from 1968 through 2000. They found that all birth defects combined and all nonchromosomal birth defects showed increased odds ratios for young and advanced maternal age, with a more pronounced increase for the group that included chromosomal defects. Overall, the relationship between maternal age and the prevalence of birth defects per birth or per live birth was similar in many previous studies in that these studies showed U-curves or gradual J-curves for nonchromosomal birth defects and extreme J-curves for chromosomal abnormalities.Citation11–Citation17 The present results also support previous findings that the effect of advanced maternal age, especially over 40, on nonchromosomal birth defects was not large compared to the effect on chromosomal abnormalities.
However, the maternal age with the lowest risks varied across studies, ie, 20–24 years,Citation13 25–29 yearsCitation12,Citation15 and 35–39 years.Citation16 In the present study, the lowest RR for nonchromosomal birth defects per live birth was obtained in the 30–34 year group. One possible explanation for the present result is the essential difference in age-specific risks of nonchromosomal birth defects in infertile couples compared to the general population. However, according to Loane et al,Citation16 the pattern of maternal age-specific risk widely differs between countries with some exceptional patterns. For example, the RR of any nonchromosomal birth defects compared with mothers aged 25–29 years increased consistently with advanced maternal age in Germany, while it decreased consistently in France. These results suggest that it is not biological age that is associated with the risk of nonchromosomal birth defects, but reproductive age, including parity and use of ART, social, ethnic exposure, and lifestyle factors that have different relationships with maternal age in different countries.Citation16 Differences in study design, case determination, and potential confounders may play a role in the discrepancies observed.Citation17
In the present study, the prevalence of nonchromosomal birth defects per pregnancy decreased linearly with maternal age class, while the prevalence of nonchromosomal birth defects per live birth showed a gradual U-shape. This difference could be explained by the fact that the percentage of abortions after ART in Japan rapidly increases in mothers aged over 35 years (data not shown). Most previous studies calculated the prevalence of birth defects per birth or live birth, since the total number of pregnancies in the general population is not always obtained. It is possible that different maternal age effects would be found if all incident cases during pregnancy could be considered, because of differential in utero survival effects.Citation16 On this point, ART statistics offer a unique opportunity to analyze the epidemiological indicators per pregnancy, since the total number of pregnancies is recorded.
Maternal age-specific risk of several birth defects
Several birth defects showed a significant effect of maternal age. Given the limited information on other potential risk factors in the present study, the precise reason for the maternal age effect was unclear. Further epidemiological study with a larger sample size and information on environmental and genetic factors is needed to clarify the direct and indirect maternal age effects on specific birth defects.
The effect of advanced maternal age was, as expected, largest regarding chromosomal abnormalities in total or specific birth defects, such as Down syndrome. This is a well-established finding in the general population.Citation22,Citation24,Citation25 Moreover, according to Chen et al,Citation34 this finding was also observed in the ART population.
Several studies found an effect of maternal age on the nervous system,Citation12,Citation16 specifically on neural tube defectsCitation8,Citation35–Citation37 such as spina bifida,Citation14,Citation17 anencephalus,Citation16 and encephalocele.Citation16 The risk of congenital malformations of the nervous system per pregnancy was significantly lower with advanced maternal age. This tendency was also observed per live birth, although it was not statistically significant. Petrova and VaktskjoldCitation36 reported an inverse association between maternal age and the prevalence of neural tube defects. This tendency would be partly explained by the lower folic acid status resulting from poorer nutrition or lower periconceptional folic acid supplementation rates.Citation16,Citation36 It was also pointed out that in Japan younger women did not recognize the importance of folic acid intake to prevent neural tube defects as strongly as older women, and they were apt to take less folic acid, regardless of the precautions taken by the Ministry of Health, Labor and Welfare of Japan.Citation38 The results of the National Health and Nutrition Examination Survey performed in 2010Citation39 also supported this tendency, namely by finding that folic acid intake is lowest in women aged 20–29 compared to other age classes.
The risk of congenital malformations of the circulatory system per live birth significantly increased for mothers in the 40+ year age class. This result was in accordance with many other studies.Citation13–Citation15,Citation37,Citation40–Citation42 According to Gill et al,Citation17 increased risks for several cardiac defects, including ventricular septal defects, atrial septal defects, and Tetralogy of Fallot, were observed for mothers who were 40+ years of age. In the present study, a U-shaped maternal age effect on congenital malformations of the aortic and mitral valves was observed.
The RR of congenital absence, atresia, and stenosis of the small intestine was also significant for mothers in the 40+ year age class. The reason for this result was unclear. Several studies reported an association between older maternal age and esophageal atresia.Citation16,Citation17 However, no relationship between maternal age and intestinal atresia/stenosis was observed.Citation17,Citation37 It is possible that certain risk factors may differ among countries and may contribute greatly to the susceptibility to certain birth defects.
Over-ascertainment bias for older mothers should be considered. The frequency of medical checks increases in older mothers, since they are a potential high-risk group.Citation13,Citation15,Citation17 Moreover, the effect of parity might be more important than maternal age for some birth defects,Citation13 since maternal age and parity are strongly correlated. The obstetric outcomes, such as prematurity, low birth weight, and Caesarean section of women aged 40 years or older have been found to be influenced by parity.Citation5,Citation43 Few studies have focused on the possibility that parity is an independent risk factor for birth defects.Citation44
Limitations
This study has the following limitations, most of which could be attributed to the dataset, namely to the fact that individual information was obtained only from subjects with birth defects after ART (numerator of prevalence) and not for all of the ART population (denominator of prevalence). The estimation of the total ART population according to maternal age class may be biased if the percentage of mothers belonging to each maternal age class did not increase or decrease in a linear fashion. However, given the relatively small change in the percentage of all mothers contained in each maternal age class between 2008 and 2010, as well as given the low value of the numerator (number of fetuses/neonates with birth defects) and the large value of the denominator (total ART population), the influence seemed to be small.
The first and greatest limitation is that the author could not check the reliability of the data directly. This is an essential limitation of secondary data analyses. Second, although the present dataset was from a multiyear nationwide survey, it still did not have sufficiently high statistical power to detect the statistical significance of several birth defects with high RR, especially for the group with a maternal age over 40 years. On the other hand, some significant relationships between maternal age and RR could be produced by chance alone. Third, the author could not control for confounding factors that can affect ART and/or birth defects,Citation32,Citation45 such as multiple births, parity, smoking, socioeconomic status, medical history, and prenatal care. Fourth, follow-up after birth was limited to the neonatal period, and was incomplete. Therefore, some birth defects might not be detected, since they are not apparent within a few days after birth.
Conclusion
The present results elucidate the current situation regarding birth defects after ART according to maternal age class. The risk of chromosomal abnormalities increased notably at a maternal age of 30 or more. Early detection of chromosomal abnormalities is essential when performing ART for advanced-age couples. On the other hand, the risk of nonchromosomal birth defects in ART live births is relatively small between maternal age groups. This information would be important to include in the counseling provided before ART is performed. Reassurance can be given to infertile couples of advanced age in that maternal age in itself does not produce noticeable extra risk for nonchromosomal birth defects.
Acknowledgments
I would like to thank Toshimi Ooma for assistance with the data analysis. This work was supported in part by a Grant-in-Aid for Scientific Research (B) from the Japan Society for the Promotion of Science (grant number 24390167).
Disclosure
The author reports no conflicts of interest in this work.
References
- JohnsonJAToughSfor Society of Obstetricians and Gynaecologists of CanadaDelayed child-bearingJ Obstet Gynaecol Can2012341809322260768
- AlshamiHAKadasneARKhalfanMIqbalSZMirghaniHMPregnancy outcome in late maternal age in a high-income developing countryArch Gynecol Obstet201128451113111621188401
- CarolanMFrankowskaDAdvanced maternal age and adverse perinatal outcome: a review of the evidenceMidwifery201127679380120888095
- JahromiBNHusseiniZPregnancy outcome at maternal age 40 and olderTaiwan J Obstet Gynecol200847331832118935996
- ChanBCLaoTTEffect of parity and advanced maternal age on obstetric outcomeInt J Gynaecol Obstet2008102323724118606410
- Cleary-GoldmanJMaloneFDVidaverJfor FASTER ConsortiumImpact of maternal age on obstetric outcomeObstet Gynecol20051055 Pt 198399015863534
- SchoenCRosenTMaternal and perinatal risks for women over 44 – a reviewMaturitas200964210911319822268
- CzeizelAMaternal mortality, fetal death, congenital anomalies and infant mortality at an advanced maternal ageMaturitas1988Suppl 173813237113
- Salem YanivSLevyAWiznitzerAHolcbergGMazorMSheinerEA significant linear association exists between advanced maternal age and adverse perinatal outcomeArch Gynecol Obstet2011283475575920376672
- YogevYMelamedNBardinRTenenbaum-GavishKBen-ShitritGBen-HaroushAPregnancy outcome at extremely advanced maternal ageAm J Obstet Gynecol20102036558.e1e720965486
- GoldbergMFEdmondsLDOakleyGPReducing birth defect risk in advanced maternal ageJAMA19792422122922294490824
- CroenLAShawGMYoung maternal age and congenital malformations: a population-based studyAm J Public Health19958557107137733434
- HollierLMLevenoKJKellyMAMCIntireDDCunninghamFGMaternal age and malformations in singleton birthsObstet Gynecol2000965 Pt 170170611042304
- HaySBarbanoHIndependent effects of maternal age and birth order on the incidence of selected congenital malformationsTeratology1972632712794345335
- ReefhuisJHoneinMAMaternal age and non-chromosomal birth defects, Atlanta, 1968–2000: teenager or thirty-something, who is at risk?Birth Defects Res A Clin Mol Teratol200470957257915368555
- LoaneMDolkHMorrisJKfor EUROCAT Working GroupMaternal age-specific risk of non-chromosomal anomaliesBJOG200911681111111919485989
- GillSKBroussardCDevineOGreenRFRasmussenSAReefhuisJthe National Birth Defects Prevention StudyAssociation between maternal age and birth defects of unknown etiology – United States, 1997–2007Birth Defects Res A Clin Mol Teratol201294121010101822821755
- BairdPASadovnickADYeeIMMaternal age and birth defects: a population studyLancet199133787405275301671898
- SavvaGMWalkerKMorrisJKThe maternal age-specific live birth prevalence of trisomies 13 and 18 compared to trisomy 21 (Down syndrome)Prenat Diagn2010301576419911411
- HassoldTChiuDMaternal age-specific rates of numerical chromosome abnormalities with special reference to trisomyHum Genet198570111173997148
- ShermanSLAllenEGBeanLHFreemanSBEpidemiology of Down syndromeMent Retard Dev Disabil Res Rev200713322122717910090
- HagenAEntezamiMGasiorek-WiensAThe impact of first trimester screening and early fetal anomaly scan on invasive testing rates in women with advanced maternal ageUltraschall Med201132330230620972947
- SípekAGregorVHorácekJChudobováMDown syndrome in the Czech Republic during 1961–1997: prevalence, prenatal diagnosis and maternal-age-specific ratesJ Obstet Gynaecol200121326626912521857
- DolkHLoaneMGarneETrends and geographic inequalities in the prevalence of Down syndrome in Europe, 1980–1999Rev Epidemiol Sante Publique200553Spec No. 22S872S9516471148
- MorrisJKWaldNJMuttonDEAlbermanEComparison of models of maternal age-specific risk for Down syndrome live birthsPrenat Diagn200323325225812627430
- OokiSBirth defects in singleton versus multiple ART births in Japan (2004–2008)J Pregnancy2011201128570622175021
- OokiSBirth defects after assisted reproductive technology in Japan: comparison between multiples and singletons, 2004–2009ShiZInvitro Fertilization (Special Issue). Reproductive System and Sexual Disorders2012S5
- OokiSConcordance rates of birth defects after assisted reproductive technology among 17,258 Japanese twin pregnancies: a nationwide survey, 2004–2009J Epidemiol201323110.2188/jea.JE20120103
- OokiSMultiple congenital anomalies after assisted reproductive technology in Japan (between 2004 and 2009)ISRN Epidemiology Epub201310.5402/2013/452085
- GarneEDolkHLoaneMfor EUROCAT Working GroupPaper 5: Surveillance of multiple congenital anomalies: implementation of a computer algorithm in European registers for classification of casesBirth Defects Res A Clin Mol Teratol2011Suppl 1S445021384529
- RimmAAKatayamaACDiazMKatayamaKPA meta-analysis of controlled studies comparing major malformation rates in IVF and ICSI infants with naturally conceived childrenJ Assist Reprod Genet2004211243744315704519
- KällénBFinnströmOLindamANilssonENygrenKGOtterbladPOCongenital malformations in infants born after in vitro fertilization in SwedenBirth Defects Res A Clin Mol Teratol201088313714320063307
- SheblOEbnerTSirASommergruberMTewsGThe role of mode of conception in the outcome of twin pregnanciesMinerva Ginecol200961214115219255561
- ChenBYHwangBFGuoYLEpidemiology of congenital anomalies in a population-based birth registry in Taiwan, 2002J Formos Med Assoc2009108646046819515626
- SípekAHorácekJGregorVRychtaríkováJDzurováDMasátováDNeural tube defects in the Czech Republic during 1961–1999: incidences, prenatal diagnosis and prevalences according to maternal ageJ Obstet Gynaecol200222550150712521417
- PetrovaJGVaktskjoldAThe incidence of neural tube defects in Norway and the Arkhangelskaja Oblast in Russia and the association with maternal ageActa Obstet Gynecol Scand200988666767219353336
- Materna-KirylukAWiśniewskaKBadura-StronkaMParental age as a risk factor for isolated congenital malformations in a Polish populationPaediatr Perinat Epidemiol2009231294019228312
- The Ministry of Health Labor Welfare of Japan Available from: http://www1.mhlw.go.jp/houdou/1212/h1228-1_18.html (In Japanese)Accessed December 27, 2012
- The National Health and Nutrition Examination Survey Available from: http://www.mhlw.go.jp/bunya/kenkou/eiyou/h22-houkoku.html. (In Japanese)Accessed December 27, 2012
- KimMAYeeNHChoiJSChoiJYSeoKPrevalence of birth defects in Korean livebirths, 2005–2006J Korean Med Sci201227101233124023091323
- RellerMDStricklandMJRiehle-ColarussoTMahleWTCorreaAPrevalence of congenital heart defects in metropolitan Atlanta, 1998–2005J Pediatr2008153680781318657826
- MillerARiehle-ColarussoTSiffelCFríasJLCorreaAMaternal age and prevalence of isolated congenital heart defects in an urban area of the United StatesAm J Med Genet A2011155A92137214521815253
- ZiadehSYahayaAPregnancy outcome at age 40 and olderArch Gynecol Obstet20012651303311327090
- DuongHTHoytATCarmichaelSLfor National Birth Defects Prevention StudyIs maternal parity an independent risk factor for birth defects?Birth Defects Res A Clin Mol Teratol201294423023622371332
- KällénBFinnströmONygrenKGOlaussonPOIn vitro fertilization (IVF) in Sweden: risk for congenital malformations after different IVF methodsBirth Defects Res A Clin Mol Teratol200573316216915678490