Abstract
Background
Cranberry products have been implicated in several case reports to enhance the anticoagulant effect of warfarin. The mechanism could involve inhibition of the hepatic CYP2C9-mediated metabolic clearance of warfarin by components in cranberry. Because dietary/natural substances vary substantially in bioactive ingredient composition, multiple cranberry products were evaluated in vitro before testing this hypothesis in vivo.
Methods
The inhibitory effects of five types of cranberry juices were compared with those of water on CYP2C9 activity (S-warfarin 7-hydroxylation) in human liver microsomes (HLM). The most potent juice was compared with water on S/R-warfarin pharmacokinetics in 16 healthy participants given a single dose of warfarin 10 mg.
Results
Only one juice inhibited S-warfarin 7-hydroxylation in HLM in a concentration-dependent manner (P < 0.05), from 20% to >95% at 0.05% to 0.5% juice (v/v), respectively. However, this juice had no effect on the geometric mean AUC0–∞ and terminal half-life of S/R-warfarin in human subjects.
Conclusions
A cranberry juice that inhibited warfarin metabolism in HLM had no effect on warfarin clearance in healthy participants. The lack of an in vitro–in vivo concordance likely reflects the fact that the site of warfarin metabolism (liver) is remote from the site of exposure to the inhibitory components in the cranberry juice (intestine).
Introduction
Since 2003, accumulating case reports, one of which was fatal, have suggested a possible interaction between the oral anticoagulant warfarin and cranberry juice/products.Citation1–Citation3 Most of the cases manifested as an increase in International Normalized Ratio (INR), which is a measure of anticoagulant response. Consequently, the labeling of warfarin has been revised to contain a warning to avoid cranberry juice/products.Citation3 Warfarin is a racemic mixture, with the S-enantiomer having a greater pharmacologic potency than the R-enantiomer.Citation4 S-warfarin is eliminated predominantly via metabolism in the liver to 7-hydroxywarfarin by cytochrome P450 (CYP) 2C9. Accordingly, any process that impairs hepatic CYP2C9 activity would be expected to increase systemic S-warfarin concentrations and potentially, the anticoagulant response. Optimal warfarin therapy is hindered by a narrow therapeutic window. This undesirable property, coupled with a wide interpatient variability in systemic S/R-warfarin concentrations and anticoagulant response, contributes to the high drug interaction liability of warfarin. Taken together, inhibition of hepatic CYP2C9 by components in cranberry juice/products has been postulated as a mechanism underlying this potential drug–dietary substance interaction.
Very few controlled clinical studies have evaluated the effects of cranberry products on warfarin pharmacokinetics and pharmacodynamics. In healthy volunteers, cranberry juiceCitation5 and cranberry juice concentrate capsulesCitation6 had no effect on the pharmacokinetics of S/R-warfarin relative to water/no treatment. Similarly, in warfarin-stabilized patients, cranberry juice had no effect on steady-state plasma S/R-warfarin concentrations relative to a placebo beverage.Citation7 The reported effects of cranberry products on warfarin pharmacodynamics have been inconsistent. In warfarin-stabilized patients, one juice had no effect on INR,Citation8 whereas another juice elicited an increase in INR, albeit on day 12.Citation7 Cranberry juice concentrate capsules, relative to no treatment, elicited a 30% increase in the mean area under the INR versus time curve in healthy volunteers.Citation6 A subsequent population pharmacokinetic-pharmacodynamic analysis identified cranberry capsules as a significant covariate on S-warfarin EC50, ie, the capsules enhanced the potency of S-warfarin.Citation6
Several potential factors contributing to the aforementioned inconsistencies include the dose and frequency of warfarin and/or cranberry product administration, the statistical power of the study, and the composition/formulation of the cranberry product. Because dietary/natural substances vary substantially in the composition of bioactive ingredients,Citation9 one brand/formulation of a selected cranberry product cannot be considered representative of all others. Although some studies measured some components of the tested cranberry product,Citation5,Citation6 none conducted in vitro bioactivity testing of the cranberry product prior to initiation of the clinical study. Taken together, the aim of the current work was to utilize a systematic in vitro–in vivo approach to investigate a suite of cranberry juice products for potential inhibition of hepatic CYP2C9-mediated metabolism of S-warfarin.
Materials and methods
Materials and chemicals
Human liver microsomes (HLM, pooled from 50 donors of mixed gender) were purchased from Xenotech, LLC (Lenexa, KS). 7-Hydroxywarfarin was purchased from BD Biosciences (San Jose, CA). S-Warfarin, chlorowarfarin, sulfaphenazole, high-pressure liquid chromatography (HPLC) grade water, methanol, ammonium acetate, and 1-propanol were purchased from Sigma-Aldrich (St Louis, MO).
Natural study materials and extraction/fractionation procedures
The following bottled, nonfrozen cranberry juices were purchased from a local grocery store: Lakewood Organic Fresh Pressed Blend Cranberry (Lakewood, Miami, FL; Lot 147H); Ocean Spray Cranberry Juice Cocktail (Ocean Spray Cranberries, Inc., Lakeville-Middleboro, MA; Lot B0513060220); Market Pantry Juice Cocktail Cranberry (Target Corp., Minneapolis, MN; Lot 11F 13:11); 365 Brand 100% Cranberry Juice (Whole Foods Market, Austin, TX; Lot 02/17/08); and R&W Knudsen Family Cranberry Juice Concentrate (Knudsen & Sons, Inc., Orville, OH). According to the manufacturer’s labeling, the Lakewood brand contained fresh pressed juice and puree from whole ripe certified organic apples, organic cranberries, and organic grapes; the Ocean Spray brand contained filtered water, 27% cranberry juice (from concentrate and cranberry juice), high fructose corn syrup, and ascorbic acid; the Market Pantry brand contained filtered water, high fructose corn syrup, 27% cranberry juice (from concentrate), and ascorbic acid; the 365 brand contained filtered water, cranberry juice, and cranberry juice concentrate; and the Knudsen brand was a cranberry juice concentrate that contained no added sugars or other fruit juices. To avoid any potential bias, the identities of the juices were coded as vendors A, B, C, D, and E. Each juice was extracted and fractionated using established natural products chemistry techniques.Citation10 The four fractions (hexane-, chloroform-, butanol-, and aqueous-soluble) generated from each juice were dried in vacuo and stored at −80° prior to the in vitro experiments.
Evaluation of cranberry juices and derived fractions as inhibitors of hepatic S-warfarin 7-hydroxylation
The inhibitory effects of each cranberry juice on hepatic S-warfarin 7-hydroxylation were evaluated using pooled HLM. S-warfarin and the CYP2C9 inhibitor, sulfaphenazole, were dissolved in methanol to yield working concentrations of 10 mM and 1 mM, respectively. Each juice was diluted in water to yield working concentrations of 5%, 20%, and 50% (v/v). NADPH was prepared fresh in potassium phosphate buffer (0.1 M, pH 7.4) to yield a working concentration of 10 mM. Incubation mixtures, prepared in 96-well plates, consisted of HLM (0.1 mg/mL microsomal protein), S-warfarin (4 μM), cranberry juice (0.05%, 0.20%, or 0.50%), and potassium phosphate buffer; control incubation mixtures contained water in place of juice. As a positive control for CYP2C9 inhibition, incubation mixtures contained sulfaphenazole (1 μM) in place of juice; control incubation mixtures contained 0.75% methanol in place of sulfaphenazole. The mixtures were equilibrated at 37°C on a solid heat block for five minutes before initiating the reactions with NADPH (1 mM final concentration) to yield a final volume of 200 μL. After 30 minutes, reactions were quenched with 400 μL of cold methanol containing 3.33 nM chlorowarfarin as the internal standard. After centrifugation (1350 g for 10 minutes at 4°C), the supernatant was analyzed for 7-hydroxywarfarin by liquid chromatography-mass spectrometry as described previously.Citation11
Each of the four fractions generated from each cranberry juice (hexane-, chloroform-, butanol-, or aqueous-soluble) was dissolved in methanol to yield working concentrations of 1 and 5 mg/mL. Incubation mixtures were prepared in a similar manner as described for whole juices, except that the whole juice was replaced with juice fraction (10 or 50 μg/mL); control incubation mixtures contained 1% methanol in place of juice fraction.
Evaluvation of the most potent CYP2C9 inhibitory cranberry juice on warfarin pharmacokinetics in healthy volunteers
A prospective, randomized, two-period crossover, open-label study was conducted at the University of North Carolina-Chapel Hill General Clinical Research Center (GCRC). Both the Office of Human Research Ethics/Biomedical Institutional Review Board and Clinical Research Advisory Committee reviewed and approved the study protocol. The study included a control (water) phase and treatment (cranberry juice) phase, which were separated by at least two weeks. Based on the in vitro data, cranberry juice from vendor E was selected for testing in the clinical study. Multiple bottles of juice E from the same lot were pooled to yield a uniform stock concentrate. “Double-strength” juice was prepared by diluting the concentrate with half the recommended volume of water. Common table sugar 5 g/oz (166 g/L) was added to improve palatability.
Prior to each volunteer’s participation, written informed consent and Health Insurance Portability and Accountability authorization were obtained. Subsequently, the volunteer underwent medical history review, physical examination, liver function tests, and complete blood count. Exclusion criteria included pregnancy or lactation, allergy to cranberry products, warfarin, or vitamin K, baseline INR > 1.2, history of significant medical conditions that the study physician believed would increase risk (eg, bleeding disorders), and concomitant modulators of CYP2C9 activity.
Healthy men and nonpregnant women (nine each) were enrolled. One man and one woman withdrew during the first phase due to a scheduling conflict and discomfort from venepuncture, respectively. Thus, 16 of the volunteers completed the study. The participants, who ranged in age from 20–58 years, were self-identified as white (four men, six women), African American (three men, one woman), Hispanic (one man), or Asian (one woman). Some concomitant medications were allowed, and included oral contraceptives (n = 2), levothyroxine (n = 1), hydrochlorothiazide (n = 1), and multivitamins (n = 2), none of which are known to modify CYP2C9 activity. Moreover, since these medications are taken chronically, any possible effects on CYP2C9 activity were assumed to have reached steady state.
The participants were instructed to avoid all fruit juices for one week prior to and during the study and from alcohol and caffeinated beverages the evening prior to each study day. Participants were admitted to the GCRC the evening prior to each study phase. Vital signs (blood pressure, temperature, pulse, respiration rate), INR, and oxygen saturation were obtained at baseline and monitored periodically throughout the 24-hour inpatient period. After an overnight fast, each participant consumed three 240 mL glasses of water or double-strength cranberry juice, each separated by a 15-minute interval. Warfarin (Coumadin®; Bristol-Myers Squibb, Princeton, NJ) 10 mg was administered with the third glass. Vitamin K (Mephyton®; Merck, Whitehouse Station, NJ) 10 mg was administered concomitantly as a safety measure to counteract the warfarin anticoagulant effect. Prior to warfarin/vitamin K administration, 5 mL of blood was collected from an indwelling venous catheter and at 0.25, 0.50, 1, 1.50, 2, 3, 4, 6, 8, and 12 hours post-drug administration, after which the participant was discharged. The participant returned to the GCRC for outpatient blood collections at 24, 36, 48, 72, and 96 hours post-drug administration. Blood was centrifuged within one hour of collection; plasma was saved and stored at −20°C pending analysis for S- and R-warfarin.
Analysis of human plasma for S- and R-warfarin
S- and R-warfarin and the internal standard, ethylwarfarin, were extracted from plasma by a one-step liquid/liquid extraction using t-butylmethylether under acidic conditions. The analytes were separated and detected by HPLC/UV using a 4.6 × 250 mm (R,R)-Whelk-O 1 Chiral column (Regis, Morton Grove, IL) and a 0.5% acetic acid/acetonitrile mobile phase. Calibration curves were obtained using a 1/concentration2-weighted quadratic regression of response (normalized by the internal standard) versus concentration. Calibration curves were linear over the range 10–1000 ng/mL. Intra- and interday coefficients of variation were both less than 12%. This method was validated according to Food and Drug Administration (FDA) guidelines.Citation12
Pharmacokinetic analysis
S-warfarin and R-warfarin pharmacokinetics were evaluated by noncompartmental methods using WinNonlin (v4.1; Pharsight Corp., Mountain View, CA). Predose below limit of quantification (BLQ) concentrations were set to zero; post-dose BLQ concentrations were set to “missing” and excluded from the analysis. The terminal elimination rate constant (λz) was estimated by linear regression of the terminal portion of the log-transformed concentration versus time curve using a minimum of three data points. The terminal half-life (t1/2) was calculated as ln(2)/λz. The maximum observed concentration (Cmax) and time to reach Cmax (tmax) were obtained directly from the concentration-time profile. Area under the curve (AUC) from time zero to the last measured concentration (AUClast) was determined using the trapezoidal rule with linear up/log down interpolation. The AUC from zero to infinite time (AUC0–∞) was calculated as the sum of AUClast and the ratio of Clast to λz. Apparent oral clearance (Cl/F) was calculated as the ratio of dose to AUC0–∞. The S/R Cmax and AUC0–∞ ratios were calculated as S-warfarin Cmax/R-warfarin Cmax and S-warfarin AUC0–∞/R-warfarin AUC0–∞, respectively.
Statistical analysis
All statistical analyses were carried out using SigmaStat (v3.5; Systat Software, Inc., San Jose, CA). The in vitro data are presented as means ± standard deviations (SDs) of triplicate determinations. Comparisons between the three concentrations of a given brand of cranberry juice were made using one-way ANOVA. Comparisons between the four generated fractions from a given cranberry juice brand were made using two-way ANOVA. Post hoc comparisons were made using Tukey’s test when an overall difference resulted (P < 0.05).
The sample size for the clinical study (n = 16) was calculated based on an 80% power to detect a 25% difference between cranberry juice E and water with respect to warfarin Cl/F. Medians and ranges are reported for tmax. The Wilcoxon signed-rank test was used to detect a difference in tmax. Geometric means and coefficients of variation (100 × SD of the natural log-transformed values) are presented for Cmax, AUC0–∞, Cl/F, and terminal t1/2. Geometric means and 90% confidence intervals are presented for the ratio of cranberry juice to water with respect to Cmax, AUC0–∞, Cl/F, and terminal t1/2. Paired two-tailed Student’s t-tests based on log-transformed data were used to detect differences between cranberry juice and water treatments. A P value < 0.05 was considered statistically significant.
Results
Effects of cranberry juices and derived fractions on hepatic S-warfarin 7-hydroxylation in vitro
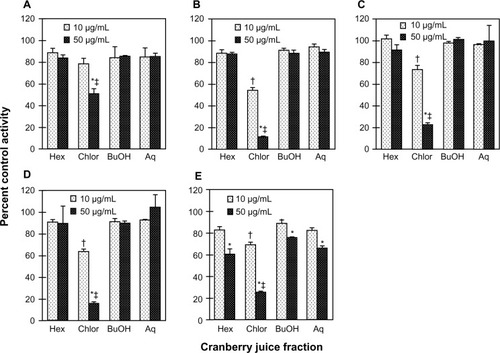
To identify a cranberry juice product to test in vivo, five cranberry juice products were evaluated as inhibitors of S-warfarin 7-hydroxylation activity in HLM. Relative to vehicle, only juice E inhibited activity in a concentration-dependent manner, by 20% to >95% from 0.05% to 0.5% (v/v) juice, respectively (). To characterize the juices further in terms of hepatic CYP2C9 inhibitory activity, each of the four fractions (hexane-, chloroform-, butanol-, aqueous-soluble) generated from a given juice was tested in HLM (). Consistent with the whole juices, the fractions from juice E, in aggregate, were the most potent, with all four fractions showing concentration-dependent inhibition (). Of the juice E fractions, the chloroformsoluble fraction was the most potent, inhibiting activity by 30% and 75% at 10 and 50 μg/mL, respectively (). Only the chloroform-soluble fractions from juices A, B, C, and D showed concentration-dependent inhibition, from 20% (juice A) to 46% (juice B) at 10 μg/mL and from 50% (juice A) to 90% (juice B) at 50 μg/mL (). The CYP2C9 inhibitor, sulfaphenazole, inhibited activity by ≥95% (data not shown).
Figure 1 Inhibitory effects of different brands of cranberry juice, coded A–E, on the 7-hydroxylation of S-warfarin in human liver microsomes. Human liver microsomes (0.1 mg/mL) were incubated with S-warfarin (4 μM) and juice (0.05, 0.20, 0.50%, v/v) for 30 minutes. Reactions were initiated by the addition of NADPH (1 mM). S-warfarin 7-hydroxylation activity in the presence of vehicle control (water) was 5.7 ± 0.4 pmol/min/mg microsomal protein. Bars and error bars denote means and standard deviations, respectively, of triplicate incubations. *P < 0.05 versus 0.05% juice; #P < 0.05 versus 0.20% juice (one-way ANOVA, followed by Tukey’s test).
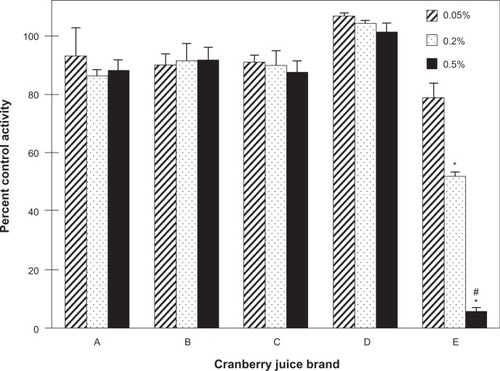
Figure 2 Inhibitory effects of the various fractions generated from the cranberry juice obtained from vendor A (A), B (B), C (C), D (D) and E (E) on the 7-hydroxylation of S-warfarin in human liver microsomes. Human liver microsomes (0.1 mg/mL) were incubated with S-warfarin (4 μM) and juice fraction (10 or 50 μg/mL) for 30 minutes. Reactions were initiated by the addition of NADPH (1 mM). S-warfarin 7-hydroxylation activity in the presence of vehicle control (1% methanol) was 2.3 ± 0.1 pmol/min/mg microsomal protein. Bars and error bars denote means and standard deviations, respectively, of triplicate incubations. *P < 0.05 versus 10 μg/mL; †P < 0.05 versus all other fractions at 10 μg/mL; ‡P < 0.05 versus all other fractions at 50 μg/mL (two-way ANOVA, followed by Tukey’s test).
Effects of cranberry juice E on the pharmacokinetics of S- and R-warfarin in healthy volunteers
As proof of concept, the effects of double-strength cranberry juice E were compared with those of water on the oral pharmacokinetics of S/R-warfarin in 16 healthy volunteers. Juice E was well tolerated by all subjects. Two subjects experienced mild nausea that resolved within a few hours. There were no vomiting episodes to affect the integrity of the pharmacokinetic data. No bleeding incidents were reported, and none of the subjects had elevated INR leading to study discontinuation.
None of the subjects were excluded from the pharmacokinetic analysis of S/R-warfarin. With S-warfarin, one subject during the water phase and one subject during the cranberry juice phase showed poor goodness-of-fit statistics for the terminal elimination phase (adjusted R2 < 0.85). Accordingly, values for AUC0–∞, Cl/F, and terminal t1/2 from these subjects were excluded from the statistical analysis. The percentage of the AUC0–∞ extrapolated to infinite time was <25% for the majority of the subjects (n = 14) and did not exceed 30%. With R-warfarin, for one subject during the water phase, values for t1/2, AUC0–∞, Cl/F, and terminal t1/2 were excluded from the statistical analysis due to an adjusted R2 < 0.85. The percentage of the AUC0–∞ extrapolated to infinite time was <30% for the majority of subjects (n = 14) and was 34% in one subject.
Relative to water, cranberry juice E slowed the systemic appearance of S-warfarin (), with the majority of subjects having measurable concentrations 15 minutes post-dose in the water phase versus 30 minutes post-dose in the cranberry juice phase. Juice E increased S-warfarin tmax, by 0.3- to 7.0-fold, in all but one subject; median tmax increased, significantly, by two hours (see ). Juice E decreased S-warfarin Cmax, by as much as 50%, in all but one subject; the geometric mean Cmax decreased significantly by 27% (). The effects of juice E on S-warfarin AUC0–∞, Cl/F, and terminal t1/2 were more varied; relative to water, the difference ranged from −34% to 40% (), −29% to 52%, and −40% to 38% (), respectively. No significant differences were detected between water and juice E for geometric mean Cl/F and terminal t1/2 (). The 90% confidence interval for the cranberry juice-to-water ratio for Cmax was outside, whereas that of AUC0–∞ was within, the range 0.8–1.25 ().
Figure 3 Geometric mean concentration-time profile (0–96 hours) of S-warfarin (A) and R-warfarin (B) for 16 healthy volunteers given three × 240 mL glasses of water or sweetened double-strength cranberry juice (CBJ) E and a single oral dose of warfarin (10 mg). Insets depict the 0–12-hour time profiles. Symbols and error bars denote geometric means and upper limits of the 90% confidence interval, respectively.
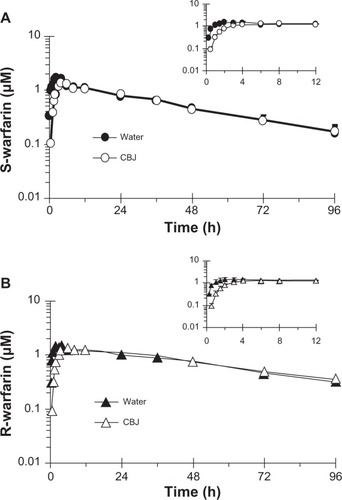
Figure 4 Effects of three × 240 mL glasses of water and sweetened double-strength cranberry juice (CBJ) E on the AUC0–∞ (A) and terminal half-life (B) of S-warfarin in each of 16 healthy volunteers given a single oral dose of warfarin (10 mg). Open symbols connected by solid lines denote individual values. Filled symbols connected by dashed lines denote geometric mean values.
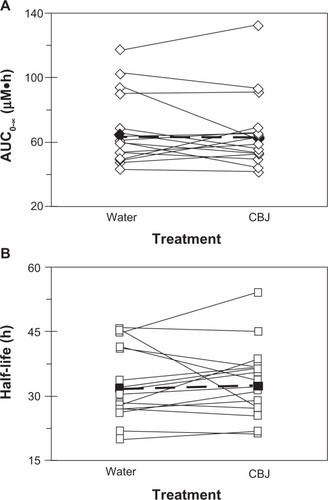
Table 1 Pharmacokinetics of S- and R-warfarin in 16 healthy volunteers given a single oral dose of warfarin (10 mg) with water or sweetened double-strength cranberry juice from vendor E (3 × 240 mL glasses).
In parallel with S-warfarin, cranberry juice E slowed the systemic appearance of R-warfarin relative to water (). Juice E increased R-warfarin tmax, by 0.3- to 7.0-fold, in all but two subjects; median tmax increased, signifi-cantly, by five hours (). Juice E decreased R-warfarin Cmax, by as much as 44%, in all but four subjects; the geometric mean Cmax decreased significantly by 18% (). As observed with S-warfarin, the effects of juice E on R-warfarin AUC0–∞, Cl/F, and terminal t1/2 were more varied; relative to water, the difference ranged from −13% to 48%, −32% to 15%, and −39% to 28%, respectively. No significant differences were detected between water and juice E for geometric mean Cl/F and terminal t1/2, and the 90% confidence intervals for the cranberry juice-to-water ratios of Cmax and of AUC0–∞ followed the same trends as S-warfarin ().
S-warfarin Cmax was higher than R-warfarin Cmax in the majority of the subjects. Relative to water, cranberry juice E decreased the geometric mean S-to-R-warfarin Cmax ratio significantly, by 11% (). In all but one subject, the AUC0–∞ for S-warfarin was lower than that for R-warfarin. No significant differences were detected between water and juice E with respect to the geometric mean S-to-R-warfarin AUC0–∞ ratio (see Table).
Discussion
Warfarin is prescribed worldwide for the treatment and prevention of thromboembolic disorders. Although effective, warfarin therapy requires routine INR monitoring due to a narrow therapeutic range and large interpatient differences in anticoagulant response. Across a given patient population, the daily therapeutic warfarin dose varies considerably.Citation13 Both genetic and nongenetic factors contribute to these large inter-patient differences. For example, genetic polymorphisms in the warfarin target gene, vitamin K epoxide reductase complex 1, account for up to 25% of these variations in dose requirements by affecting a patient’s sensitivity to warfarin.Citation13,Citation14 Genetic polymorphisms in the CYP2C9 gene account for another 15% of these variations by affecting a patient’s ability to eliminate warfarin. Moreover, because hepatic CYP2C9-mediated metabolism represents the major clearance pathway of the more pharmacologically active S-enantiomer, significant inhibition of CYP2C9 activity by nongenetic factors, such as concomitant medications, would be expected to enhance the systemic exposure of S-warfarin, and hence, the anticoagulant effect. Indeed, a number of clinically used CYP2C9 inhibitors, including fluconazole, amiodarone, and trimethoprim-sulfamethoxazole, have been associated with serious bleeding events in patients taking warfarin.Citation15
In addition to concomitant medications, some dietary substances are known to influence warfarin response. For example, vitamin K-rich foods, such as dark green vegetables and some oils, are associated with warfarin resistance, and patients are counseled routinely regarding consistent intake of these foods.Citation4 More recently, several case reports, including one fatal event, have implicated a possible interaction between warfarin and cranberry juice/products. In most of the cases, larger than normal volumes/frequencies of cranberry product intake were associated with an increased INR. This drug-dietary substance interaction has been postulated to reflect inhibition of hepatic CYP2C9 activity by components in cranberry.Citation1–Citation3 Despite the lack of consistency among the scant controlled clinical trials regarding a warfarin-cranberry product interaction, the FDA in 2005 approved labeling changes cautioning patients about consuming cranberry juice/products while taking warfarin.Citation3 Moreover, a medication guide developed by Bristol-Myers Squibb warns patients to avoid drinking cranberry juice or eating cranberry products while taking Coumadin.
Unlike drug products, of which the bioactive (and inactive) chemical entities are known and quantified, such information frequently is not available for dietary/natural substances. As a consequence, a major challenge with respect to the interpretation of drug–dietary/natural substance interactions is the substantial variation in the composition of bioactive components, which precludes between-study comparisons, as well as accurate predictions of the likelihood of a drug interaction. Accordingly, a systematic in vitro–in vivo approach involving multiple cranberry juice products was utilized to determine whether components in cranberry could inhibit the hepatic CYP2C9-mediated metabolism of S-warfarin. Of the five juices tested in vitro, only one (juice E) showed concentration-dependent inhibition of CYP2C9 activity (S-warfarin 7-hydroxylation) in HLM, with near ablation at just 0.5% juice (v/v). Likewise, all four fractions generated from juice E exhibited concentration-dependent inhibition, with the chloroform-soluble fraction showing the highest potency. Only the chloroform-soluble fraction from the remaining juices showed concentration-dependent inhibition. These observations suggested that the CYP2C9 inhibitors resided largely in this relatively lipophilic fraction. Although the fractions were not quantified in the juices, the negligible inhibitory effects of juices A–D, in contrast with juice E, could be due to variation in the amounts of chloroform-soluble ingredients contained in these juices. Collectively, the differential effects of the various cranberry juice products on S-warfarin 7-hydroxylation further substantiate the probability that one dietary/natural substance is not representative of the broader marketplace. This contention is appreciated for consumer products, such as chocolates, coffees, and wines, in which profound differences in color, smell, taste, or texture reflect alterations in the growth, harvest, and/or processing of the materials. Such variability is overlooked frequently with dietary/natural products, for which similar variances can result in a different profile of bioactive constituents.
Based on the in vitro data, cranberry juice E was selected for evaluation on warfarin pharmacokinetics in healthy volunteers. Relative to water, consumption of multiple glasses of double-strength juice had no significant impact on the total exposure of S-warfarin, as the 90% confidence interval of the AUC0–∞ was contained within the reference 80%–125% bioequivalence range. However, the absorption of S-warfarin with juice E was slower compared with water. The median tmax increased by two hours, and geometric mean S-warfarin Cmax decreased by about 30%. Similar changes occurred with R-warfarin. The delay in warfarin absorption may have reflected changes in the physicochemical properties of the drug and/or delayed gastric emptying. This effect may be nonspecific, and possibly confounded by a decrease in gastric emptying rate elicited by the high sugar content in the double-strength cranberry juice, because the same cranberry juice product slowed the absorption of the CYP3A probe substrate, midazolam.Citation10 However, unlike with midazolam, juice E had no effect on the geometric mean AUC0–∞ of S- and R-warfarin, which is consistent with earlier studies following single-dose administration of warfarin and multiple exposures to a different brand of cranberry juice.Citation5
Recently, using a similar systematic in vitro–in vivo approach involving multiple cranberry juice products, human intestinal microsomes, and midazolam 1′-hydroxylation as an index of CYP3A activity, the juice showing the most potent inhibition of enteric CYP3A-mediated metabolism in vitro elicited a significant increase (∼ 30%) in midazolam systemic exposure in vivo; the lack of an effect on systemic t1/2 suggested that the juice inhibited intestinal, but not hepatic, CYP3A activity.Citation10 In contrast, no change in total warfarin exposure was observed with the cranberry juice identified in the HLM system. The lack of in vitro-in vivo concordance with S-warfarin/HLM may reflect the fact that the site of warfarin metabolism (liver) is remote from the site of exposure to the inhibitory components in cranberry juice (intestine). The high oral bioavailability of warfarin (>90%) indicates that the drug undergoes negligible first-pass metabolism in both the intestine and liver. The inhibitory CYP2C9 components in cranberry juice also may undergo biotransformation to inactive forms and/or may be diluted in portal and hepatic arterial blood prior to entering the liver.
In summary, because dietary/natural products vary in composition of bioactive components, the warfarin–cranberry juice interaction was revisited using a systematic in vitro-in vivo approach involving multiple cranberry juice products. To the authors’ knowledge, such an approach had not been used previously. As anticipated, significant differences between juices were evident with respect to hepatic CYP2C9 inhibition in vitro, confirming that one product should not be considered representative of all others; this view cannot be overstated with respect to any natural/herbal product.Citation9,Citation16 A previous in vitro–in vivo study involving human intestinal microsomes and the probe CYP3A substrate, midazolam, successfully identified a cranberry juice product that inhibited enteric CYP3A activity in human volunteers.Citation10 In contrast, the current work, which utilized a similar approach, failed to identify a juice capable of inhibiting hepatic CYP2C9 activity in human volunteers. The in vitro–in vivo discordance is likely due to the disparate sites of dietary substance delivery (intestine) and probe substrate metabolic elimination (liver).
Acknowledgments
The authors thank Nicole White (UNC-Chapel Hill Eshelman School of Pharmacy) for excellent technical assistance with the analysis of human plasma for S- and R-warfarin, and the UNC General Clinical Research Center nutrition, nursing, and Investigational Drug Services staff for excellent assistance with the execution of the clinical study. This work was supported by the National Institutes of Health (R01 GM077482, M01 RR000046, and P30 AI050410), the University of North Carolina at Chapel Hill Research Council, the University of Washington School of Pharmacy Elmer M Plein Endowed Research Fund, and the Golden LEAF Foundation. MFP dedicates this article to Dr David P Paine.
References
- AstonJLLodolceAEShapiroNLInteraction between warfarin and cranberry juicePharmacotherapy2006261314131916945054
- PhamDQPhamAQInteraction potential between cranberry juice and warfarinAm J Health Syst Pharm20076449049417322161
- MergenhagenKAShermanOElevated International Normalized Ratio after concurrent ingestion of cranberry sauce and warfarinAm J Health Syst Pharm2008652113211618997138
- NutescuEAShapiroNLIbrahimSWestPWarfarin and its interactions with foods, herbs and other dietary supplementsExpert Opin Drug Saf2006543345116610971
- LiljaJJBackmanJTNeuvonenPJEffects of daily ingestion of cranberry juice on the pharmacokinetics of warfarin, tizanidine, and midazolam – probes of CYP2C9, CYP1A2, and CYP3A4Clin Pharmacol Ther20078183383917392729
- Mohammed AbdulMIJiangXWilliamsKMPharmacodynamic interaction of warfarin with cranberry but not with garlic in healthy subjectsBr J Pharmacol20081541691170018516070
- AnsellJMcDonoughMZhaoYHarmatzJSGreenblattDJThe absence of an interaction between warfarin and cranberry juice: A randomized, double-blind trialJ Clin Pharmacol20094982483019553405
- LiZSeeramNPCarpenterCLThamesGMinuttiCBowermanSCranberry does not affect prothrombin time in male subjects on warfarinJ Am Diet Assoc20061062057206117126638
- PaineMFOberliesNHClinical relevance of the small intestine as an organ of drug elimination: Drug-fruit juice interactionsExpert Opin Drug Metab Toxicol20073678017269895
- NgoNYanZGrafTNIdentification of a cranberry juice product that inhibits enteric CYP3A-mediated first-pass metabolism in humansDrug Metab Dispos20093751452219114462
- BrantleySJOberliesNHKrollDJPaineMFTwo flavonolignans from milk thistle (Silybum marianum) inhibit CYP2C9-mediated warfarin metabolism at clinically achievable concentrationsJ Pharmacol Exp Ther20103321081108719934397
- Food and Drug Administration, US Department of Health and Human ServicesGuidance for industry: Bioanalytical method validationRockville, MD2001 Available at: http://www.fda.gov/downloads/Drugs/GuidanceComplianceRegulatoryInformation/Guidances/ucm070107.pdfAccessed on May 10, 2010
- RettieAETaiGThe pharmocogenomics of warfarin: Closing in on personalized medicineMol Interv2006622322716960144
- JonasDEMcLeodHLGenetic and clinical factors relating to warfarin dosingTrends Pharmacol Sci20093037538619540002
- ThiLShawDBirdJWarfarin potentiation: A review of the “FAB-4” significant drug interactionsConsult Pharm20092422723019555137
- KrollDJShawHSOberliesNHMilk thistle nomenclature: Why it matters in cancer research and pharmacokinetic studiesIntegr Cancer Ther2007611011917548790