
Abstract
Background
The clinical forms of cutaneous tuberculosis (CTB) consist of a spectrum that reflects the host’s immune response to Mycobacterium tuberculosis; it provides an ideal model to study the immunological dysregulation in humans. IL-17 plays an important role in initial immune response and is involved in both immune-mediated protection and pathology during M. tuberculosis infection. TGF-β producing regulatory T-cells (Tregs) are high in leprosy patients and responsible for immune suppression. However, in CTB, the involvement of Tregs and Th17 remains unevaluated.
Objective
To study the role of proinflammatory Th17 and Treg cells in the human CTB.
Methods
Blood and skin biopsies of CTB patients and healthy controls (HC) were included in the study. Flow cytometric analysis of IL-17, FOXP3, and TGF-β in blood was done followed by immunohistochemistry on paraffin-embedded skin sections. Expression of IFN-γ, TGF-β, and IL-17 was evaluated by quantitative real-time PCR.
Results
We found significant (P<0.0002) lower expression of proinflammatory IL-17 and IFN-γ (P<0.01) in CTB skins as compared to HC. However, the frequency of TGF-β producing Treg cells was found to be high in CTB patients (P<0.001) as compared to HC. A similar type of profile was observed by flow cytometric analysis. Treg cells produced suppressive cytokine TGF-β which showed a positive correlation with FOXP3 gene expression.
Conclusion
Our study found an increase in lineage-specific CD4+ Tregs in CTB as compared to the HC individuals. Such cells secrete TGF-β, a suppressive cytokine and may play a role in negatively regulating the T-cell immune responses in CTB. In addition, Tregs with TGF-β may downregulate Th17 cell responses leading to the antigen-specific anergy associated with CTB patients.
Introduction
Cutaneous tuberculosis (CTB) is a paucibacillary infection caused by intracellular rod-shaped Mycobacterium tuberculosis complex, Mycobacterium bovis, and Bacillus Calmette-Guérin depending upon the individual immunity and other factors such as genetic and environmental ones.Citation1–Citation3 Skin manifestation shows 1 or more hypopigmented skin lesions and anesthetic patches. A typical CTB lesion is an epithelioid granuloma with central caseation necrosis.Citation4,Citation5 Since 5–6 decades, extensive studies have shown T-cell immunopathology of pulmonary and extrapulmonary TB.Citation6 Among the extrapulmonary TB, CTB has been least studied. Because of good response to multidrug therapy, the skin lesions partially or even completely disappear within 6–8 weeks.
Cytokines are a key player for activation of cell-mediated immunity, while Th1 cells play a major role in the immune response to mycobacteria.Citation7,Citation8 Even though the production of IFN-γ is insufficient to control the bacillus, IFN- γ is one of the crucial components of the protective response against the pathogen.Citation9 Ability to produce IFN-γ may differ in every individual. Some studies suggest that the levels of IFN-γ decrease in patients with active and advanced pulmonary disease. A distinct discovery was made in 1995 by Sakaguchi et alCitation10 who showed that a subset of cells is responsible for maintaining homeostasis of organ-specific autoimmunity, and these cells were called as a Regulatory T (Treg) cell. Treg cells expressed CD25 and were later shown to also express FoxP3. The discovery of CD4+CD25+FOXP3+ cells as a suppressor of autoimmune responses and their presence in mice and manCitation11,Citation12 has revived the concept of a distinct lineage of T cells that negatively regulate the immune responses in order to maintain homeostasis and were designated as Tregs. These cells commonly produce TGF-β and are able to express TLRs and contributed to the immunopathology of mycobacterial diseases viz, leprosy and tuberculosis.Citation13–Citation16 On the other hand, Th17 cells have been recognized as an inflammatory subset of a distinct lineage of Th cells; associations between IL-17 and infectious disease have been known for many years. Earlier, our group has reported as nonpolarizing Th17 subset of T-helper cells in stable leprosy.Citation17,Citation18 Therefore, Th17 constitutes a potentially important factor at the onset of the infection, because they can influence the latency or progression of TB and leprosy.Citation8 Study of T-cell pathology is a very important study for any infectious diseases in terms of appropriate treatment and therapeutic values. Among different populations of T-helper cells, Th1 and Th17 are the main effector populations which mediate protection and pathology during TB. Here, we made an attempt to identify the role of Tregs and Th17 cells, Treg-associated transcription factor FOXP3, and TGF-β in CTB patients. Furthermore, we also investigated IL-17 and IFN-γ expression levels in CTB patients in comparison to healthy individuals.
Materials and methods
Enrollment of patients and ethics
Ten newly diagnosed CTB patients with a differential diagnosis of lupus vulgaris (LV) and scrofuloderma were recruited from the Department of Dermatology and Venerology, Safdarjung Hospital, New Delhi, India. In addition, normal skin samples from 10 healthy controls (HC) (M: 04, F: 06, and age range: 18–38 years) undergoing cosmetic surgery for burn-free area were included as HC. Their chest X-rays were normal and they were negative for acid-fast bacilli. All these patients had normal chest X-rays except for 1 ().
Table 1 Clinical details of CTB patients
Since there was no available data on this aspect, on a pilot basis we arbitrarily enrolled 10 patients in each group. The study protocol, informed consent forms, and all procedures were approved by the Institutional Ethical Committee of Safdarjung Hospital (No. 26–11-EC (25/31). Written informed consent was obtained from the patients prior to taking skin biopsies.
Diagnosis of CTB
CTB is essentially a paucibacillary type of mycobacterial infection. Diagnosis of CTB was made on the basis of the typical clinical picture, investigations (Mantoux test and histopathological finding of an epithelioid cell granuloma), and response to therapy within 2 months of starting antitubercular therapy (no organisms were seen on special stains on histopathology including Ziehl–Neelsen and periodic acid Schiff). In a recent meeting of experts on extrapulmonary tuberculosis, it was concluded that since culture and PCR-based tests have low sensitivity and since there is a lack of evidence from high-quality studies, they could not be recommended for confirmation of diagnosis, according to Index-TB guidelines on extra-pulmonary tuberculosis for India. Hence, response to therapy remains a reasonable way of diagnosing the patient as having any of the forms of CTB.Citation19
Skin biopsies
Skin biopsies of the affected area were collected after obtaining the informed consent of patients and HC. In case of children, parent’s written and oral consent was obtained. Punch biopsies of 4–6 mm skin were taken under local anesthesia (1% lignocaine) from the edge of an active lesion. One-half of the biopsies were fixed in 10% buffered formalin for routine histopathological evaluation and immunohistochemical analysis and the other half were stored in RNA later (Ambion, Foster City, CA, USA), an RNA protection solution for RNA isolation and finally stored at –20°C for further processing.
Immunohistochemistry (IHC)
Serial sections of 5 µm thick formalin-fixed paraffin-embedded tissue were cut on Leica rotary microtome, adhered to poly-l-lysine (Sigma Aldrich, St. Louis, MO, USA)-coated slides, and deparaffinized in xylene and rehydrated with a sequence of isopropyl alcohol solutions. For antigen retrieval, sections were pretreated in EZ retriever microwave (Bio Genex, Fremont, CA, USA) with TE (50 mM Tris 2 mM EDTA, pH-9) buffer. The microwave conditions were 96°C for 8 minutes of 2 cycles followed by cooling to room temperature in the same buffer for 30–40 minutes. After cooling, endogenous peroxidase was quenched using 0.9% hydrogen peroxide in distilled water for 10 minutes followed by washing in PBS-T (Triton X-100 for nuclear markers), 2 changes of 5 minutes each. The nonspecific background was blocked using 3% BSA in PBS for 30 minutes followed by primary antibody incubation at the optimized dilutions overnight in a humidified chamber at 4°C. The antibodies used in this study were directed against human transcriptional factor of FOXP3 (Mouse monoclonal clone-236A/E7) and TGF-β (H-112). IHC was performed using enhancer HRP-polymer detection method (Bio Genex) according to the manufacturer’s instructions. The sections were counterstained with hematoxylin.
Assessment of staining
Sections were assessed under the microscope (Nikon, Tokyo, Japan) at 40× magnification, and photographs of 5 different fields were taken. Positively stained cells in the granuloma and cellular infiltration were determined by the presence of brown color due to DAB substrate. Negative cells lacked staining. Quantitative assessment of nuclear FOXP3 and TGF-β markers was done using Image Pro express 6.0 (Media Cybernetics, Rockville, MD, USA).
RNA extraction and cDna synthesis
RNA isolation was done from individual skin tissue (20 mg), stored skin biopsies after thawing and crushing the tissue with liquid nitrogen in pestle and mortar, using Tri-reagent (Sigma Aldrich) according to the manufacturer’s instructions. The purity and concentration of RNA preparation were determined by Nanodrop 2000 spectrophotometer (Thermo Scientific, Waltham, MA, USA). RNA was reverse transcribed to cDNA using Suprescript III First strand cDNA synthesis kit (Invitrogen, Carlsbad, CA, USA) according to manufacturer’s recommendations using random hexamer primer sequences.
Real-time PCR (qPcR)
Quantitative gene expression of FOXP3, IL-17, and TGF-β was assessed by qPCR. Duplicate samples of cDNA from each subject was amplified with precoated primers (SA, Biosciences, Frederick, MD, USA, cat no PHAS-073), for FOXP3 (Hs.247700), IL-17 (Hs.41724), and TGF-b (Hs.645227) with 2 housekeeping genes b2M (Hs.534255) and HPRT1 (Hs.412707), using SYBER green chemistry. These were then subjected to qPCR (Bio-Rad CFX96, Bio-Rad, Hercules, CA, USA) for 2 hours. Threshold cycles values (Ct) were normalized and expressed as ΔCt: mean Ct of gene of interest-mean Ct of 2 housekeeping genes.Citation17 Thermal profile was as follows: 95.0°C for 10:00 minutes for Stage 1, for Stage 2, 95.0°C for 0:15 (15 seconds) followed by 60.0°C for 1:00 minute (40 cycles).
Isolation and culture of peripheral blood mononuclear cells (PBMC)
Three milliliter venous blood was collected from each CTB patients and HC. PBMC were isolated using Ficoll (Sigma) density-gradient method. Cell yields ranged from 1.3 to 1.5×10⁶/mL, and cell viability ranged from 95% to 98% as estimated by 0.2% trypan blue staining (Sigma Aldrich). After isolation of PBMC, 2×10⁶ cells/mL were cultured for 48 hours in sterile flat bottom 24-well plates (Falcon, Somerset, NJ, USA) with and without purified protein derivative (PPD) (2.5 µg/mL) antigens and 5 µg/mL phytohemagglutinin (Sigma) as positive control ( and ) in Roswell Park Memorial Institute-1640 medium +10% fetal bovine serum (Sigma Aldrich) for 48 hours in 5% CO2 at 37°C in incubator. After the stimulation, cells were analyzed by flow cytometry.
Flow cytometric analysis
All reagents were obtained from BD Biosciences, San Diego, CA, USA and used as per manufacturer’s instructions. Eight hours prior to harvest, ex vivo cultured cells were incubated with BD Golgi Stop to block secretion of cytokine. For surface staining, 1.0×10⁶ cells/100 µL in staining buffer were incubated with anti-human CD3 (Per-Cpcy-5.5 clone-UCHT), CD4 (APC-H7, clone:SK3), and CD25 (fluorescein isothiocyanate, clone:M-A251) with respective isotype controls. After the surface staining, cells were washed 2 times and permeabilized with permeabilizing/fixation solution for 30 minutes at 4°C. The cells were washed as above and resuspended in Perm/Wash buffer and incubated with anti-human IL-17A (Alexa Fluor-647, SCPL1362) at 4°C for 30 minutes in the dark followed by 2 washes as before, and resuspended in 500 µL. For FOXP3 staining, cells were incubated with 1xFOXP3 buffer A for 10 minutes at room temperature; cells were washed as above and permeabilized with buffer C for 30 minutes at room temperature. The cells were washed as before, resuspended in stain buffer, and incubated with anti-FOXP3 (APC, clone:259D/C7) and anti-TGF-β (PE, clone:TW4-9E7) at room temperature for 30 minutes in the dark followed by 2 washes as before and suspended in 500 µL of staining buffer. Stained cells were acquired by FACS Caliber (BD Biosciences) and analyzed by Flowing two software.
Statistical analysis
Data of cytokines are represented as mean ± standard deviation (SD) while gene expression data are represented as mean% ΔCt ± SD. P<0.05 was considered as statistically significant. Graph Pad Prism version 4 (GraphPad Software, Inc., San Diego, CA, USA) was used for 2-tailed Mann–Whitney test for significance and nonparametric Spearman’s rank correlation coefficient (r2).
Results
Clinical characteristics
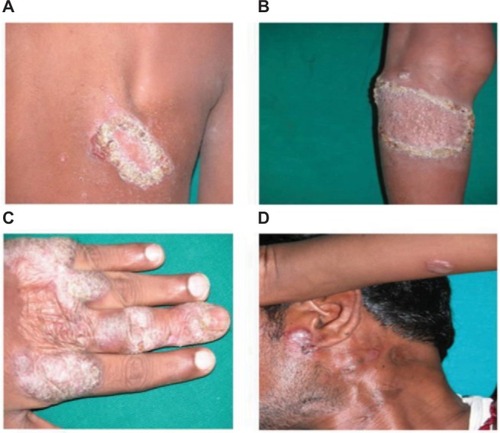
The 10 CTB patients were in the age group of 7–34 years with disease duration of 2–60 months. Patients had LV and keratotic plaques, scrofuloderma, and preauricular erythematous plaque on hand, back, and left knee ().
Figure 1 Cutaneous tuberculosis affected patients.
Notes: Lupus vulgaris shows keratotic plaques on back (A) and left knee (B). Lupus vulgaris shows keratotic plaque on left hand (C). Lupus vulgaris and scrofuloderma shows left cervical scrofuloderma and preauricular erythematous plaque (D).
Routine histopathology
Upon histopathological examination, 6 cases out of the 10 CTB patients were LV and 4 were SD (). All granulomas were ill-defined and small. Granulomas of LV predominantly had cellular infiltrate of few to increased lymphocytes, histiocytes, and multinucleated giant cells in some cases, and SD had predominantly epithelioid cells, few lymphocytes, plasma cells, and caseating necrosis. Both forms of CTB showed chronic inflammation.Citation20
Th17 cells decrease in CTB patients
Flow cytometric analysis of data was done to identify the Th17 cell percentage in 48 hours PPD-stimulated PBMC cultures from CTB patients and HC. As expected (), the intracellular presence of IL-17A was associated with CD3+CD4+ cells in all the clinical groups. CTB patients showed significantly low (P<0.001) (mean% ± SD; 9.3±1.7) of CD3+-gated CD4+IL-17A+ cells as compared to nonreactive HC (mean% ± SD; 2.1±0.9).
Figure 2 IL-17A producing cells and gene expression in CTB patients.
Notes: (A) Dot plot of flow cytometry showing CD3+CD4+ gating strategy and histogram depicting IL-17+cells in CTB and HC group, respectively. (B) Scatter diagram shows mean% ± SD of CD3+CD4+IL-17+, Th17 cells in CTB patients and HC. (C) Scatter diagram of gene expression (mean% ΔCt ± SD) of skin biopsies showed decrease in expression of IL-17 in CTB patients’ skin as compared to HC skin. Figures in parenthesis indicate number of subjects studied. P<0.05 was considered significant by 2 tailed Mann–Whitney test.
Abbreviations: ΔCt, threshold cycle (delta Ct) of real time PCR; CTB, cutaneous tuberculosis; HC, healthy controls.
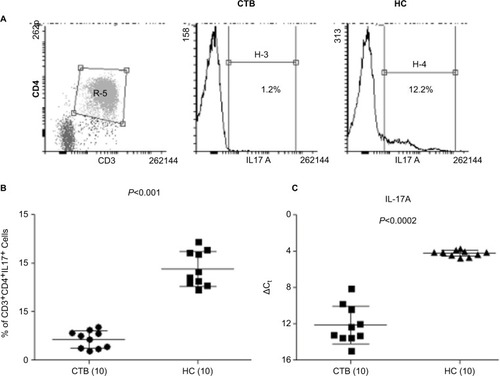
Further validation of the above data was obtained with qPCR gene expression of IL-17A and IFN-γ in skin lesions of CTB and normal skin. Expression of IL-17A was significantly downregulated (P<0.0002, mean ± SD; 12.1±2.0) in CTB patients as compared to the normal healthy skin (IL-17; 4.2±0.3) (). Gene expression of IFN-γ showed significant downregulation (P<0.001, CTB; 7.7±1.1 and HC; 6.2±1.1) in CTB patients as compared to HC group.
Upregulation of FOXP3+ Treg cells and intracellular TGF-β cells in CTB patients
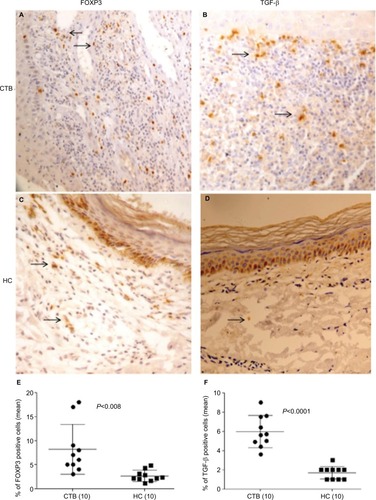
In situ: A total of 10 CTB and HC samples were studied for nuclear FOXP3 and cytoplasm TGF-β by IHC. The percentages of immune cell markers by quantitative image analysis are shown in . Skin lesions of CTB patients and HC showed the presence of nuclear FOXP3+ staining using IHC (). However they were present in a limited pattern around as well as among the epithelioid cells of the tuberculoid granulomas; FOXP3+ cells were present among the foamy macrophages of the CTB granulomas in the dermis. The distribution of positive cells for all markers was not uniform, and 1,000 cells were enumerated to obtain a percentage of positive cells FOXP3+ cells. The percentage of FOXP3+ cells was significantly higher (P<0.008) in CTB (mean ± SD; 8.2±5.2) as compared to (2.6±1.1) normal skin. TGF-β-induced diffuse cytoplasmic pattern were also significantly higher in CTB skin (P<0.0001) (mean% ± SD; 5.9±1.6) as compared (1.7±0.6) to HC ().
Figure 3 High in situ expression of Treg cells in CTB.
Notes: IHC on representative skin lesions from (A and B) CTB patients and (C and D) healthy skin controls data. (A and C) showing detailed nuclear staining of FOXP3+ cells and (B and D) showing TGF-β+ cytoplasmic staining in skin tuberculosis and healthy skin. (E and F) Scatter diagram shows percentage of positive cells/1,000 cells. DAB was used as chromogen after treatment with appropriate anti-human FOXP3 and TGF-β antibody; details given in “Materials and Methods” section. Scatter diagram shows increase of cells with FOXP3 and TGF-β in CTB as compared to HC patients. horizontal and vertical bars indicate mean% ± SD of positive cells of 1,000 total cells. P<0.05 was considered as a significant value by 2-tailed Mann–Whitney test. Figures in parenthesis indicate the number of subjects. Arrows show FOXP3 and TGF-β positive cells.
Abbreviations: CTB, cutaneous tuberculosis; HC, healthy controls.
In vitro: The role of Treg during CTB was investigated using both flow cytometry () and qPCR analysis (). Forty-eight hours-stimulated PBMC and skin lesions were investigated from both CTB patients and HC group. CTB patients showed a significant (P<0.002) increase in Treg cells (mean% ± SD; 5.3±1.0) as compared to the HC group (2.2±0.9) (). Of the interest, intracellular TGF-β+ Treg cells were also significantly higher (P<0.0001) in CTB (mean% ± SD; 77.14±7.0) patients as compared to HC (58.5±5.6) group (). In concordance with the above, using qPCR () FOXP3 and TGF-β gene expressions were found to be significantly (P<0.005, P<0.001) higher in skin lesions of CTB patients as compared to normal skin.
Figure 4 Upregulated Treg cells and intracellular TGF-β cells in CTB patients.
Notes: (A and B) Dot plots of flow cytometry shows cD3+cD4+-gated cD25+FOXP3+ Treg cells and histogram shows intracellular TGF-β in CTB and HS group, respectively. (C) Scatter diagram is represented as mean% ± AD of Treg cells in CTB patients and HS. (D) Scatter diagram of mean% ΔCt ± SD demonstrating significantly upregulated intracellular TGF-β in CTB patients as compared to HS. Figures in parenthesis indicate number of subjects studied. P<0.05 was considered as a significant value by 2-tailed Mann–Whitney test.
Abbreviations: ΔCt, threshold cycle (delta Ct) of real time PCR; CTB, cutaneous tuberculosis; HC, healthy controls; HS, healthy skin controls data.
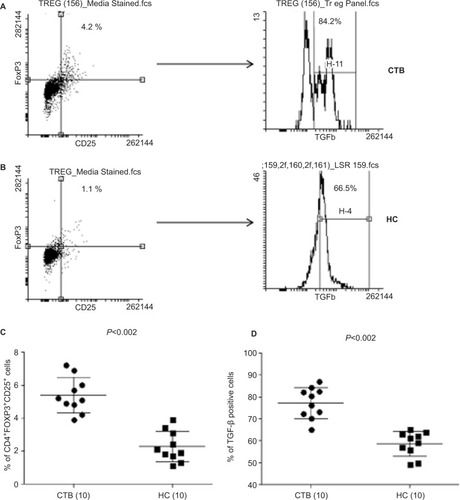
Figure 5 FOXP3 and TGF-β gene expression in CTB.
Notes: scatter diagram of gene expression (mean% ΔCt ± SD) of skin biopsies showed increase in expression of (A) FOXP3 and (B) TGF-β in CTB patients’ skin as compared to HS. Figures in parenthesis indicate number of subjects studied. P<0.05 was considered as a significant value by 2-tailed Mann–Whitney test and spearman test for correlation.
Abbreviations: ΔCt, threshold cycle (delta Ct) of real time PCR; CTB, cutaneous tuberculosis; HC, healthy controls; HS, healthy skin controls data.
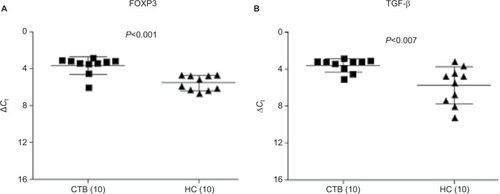
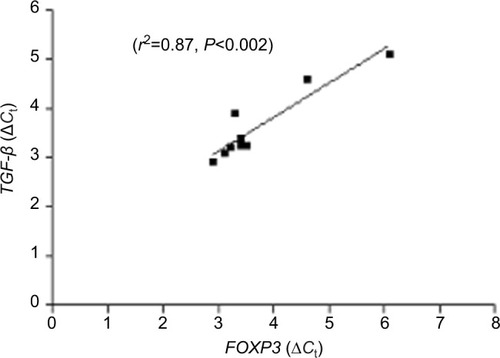
Gene expression of FOXP3 and TGF-β showed positive correlation
FOXP3 is a transcription factor of Treg cells and promotes TGF-β production in infectious diseases. As reported earlier, FOXP3 and TGF-β were found to be significantly upregulated in CTB patients (). In our study, a significant positive correlation of coexpression of FOXP3 and TGF-β was observed by qPCR (r2=0.87, P<0.002) in CTB patients’ skin (). However, FOXP3 did not show any correlation with IL-17 gene expression.
Figure 6 Correlation of gene expression.
Notes: This figure shows significant correlation of FOXP3 and TGF-β gene expression in skin of CTB patients. Figures in parenthesis indicate number of subjects studied. P<0.05 was considered as a significant value by 2-tailed Mann– Whitney test and spearman test for correlation.
Abbreviations: ΔCt, threshold cycle (delta Ct) of real time PCR; CTB, cutaneous tuberculosis.
Discussion
M. tuberculosis causes pulmonary and extrapulmonary tuberculosis. It is among the oldest microbe known to humanity, and it is a master manipulator of the immune system in terms of tolerance and pathogen persistence. Study of the immune mechanism during the pathogenesis of TB is still a matter of debate. The involvement of Th17 and Treg cells in pulmonary TB has been reported earlier.Citation21 Th17 and Th1 subsets have emerged to build abundant layers of defense against various pathogens and diseases. However, concomitant with these effector responses, a network of Treg cells responses keep the effector cells of the cell-mediated immunity in homeostasis. The present investigations were undertaken on CTB patients with a view to understand the immune mechanisms underlying the unique clinical types in tuberculosis as well as to investigate the differences between circulating cells and local immune responses in the lesional skin. In general, expression of TGF-β, IL-17, and IFN-γ in skin lesion and circulating PBMCs may be related to the differences in numbers of cells in lesions or the stronger recall responses in circulating cells.
Diverse effector T-cell response controls such a balance, either containing the pathogen (paucibacillary disease) or rendering their survival via immune suppression leading to a multibacillary disease.Citation22 Treg cells are found to be very high in CTB patients, thus suppressing the host immune system. Treg cells mediate suppression activity primarily through the secretion of the immunosuppressive cytokine TGF-β.Citation14,Citation23
TGF-β has been established as having an anti-inflammatory effect in nature and secreted by FOXP3+ Treg cells.Citation24 This is the first study that investigated the role of TGF-β -producing Treg and Th17 cells in a CTB patient. In the present study, flow cytometric analysis revealed that the frequency of TGF-β-producing FOXP3+ Treg cells showed an increasing trend in CTB patients as compared to HC. These Treg cells produced significant amounts of TGF-β in CTB patients, indicating their suppressive in nature. Previously, it was reported that TGF-β plays an important role in CD4+CD25+ Treg expansion, and it was also shown to inhibit the polarization of Th17 and Th1 cells.Citation25 Further, it was observed in flow cytometric analysis that the intracellular presence of IL-17A was associated with CD3+CD4+ cells in CTB and HC groups. CTB patients showed significantly low number of CD3+-gated CD4+IL-17A+ cells as compared to nonreactive healthy subjects.
Th17 cell-produced IL-17 played a protective role in the onset of infectious diseases and is pathogenic in autoimmune disorders.Citation17,Citation21,Citation26–Citation29 Moreover, it has been involved in tissue remodeling, and recruitment and survival of neutrophils in the early stages of infection leading to control of the bacterial load. A positive correlation between IL-17 and IFN-γ has also been reported.Citation21,Citation26,Citation30–Citation33 It has long been assumed that the central role of Th1 cells in the defense against TB is due to the ability of IFN-g to activate macrophages and stimulate phagocytosis, phagosome maturation, production of reactive nitrogen intermediates, and antigen presentation.Citation22,Citation34,Citation35 Investigators have reported that IFN-γ mediated protection by inhibiting the harmful response of Th17 cells rather than by inhibiting M. tuberculosis duplication.Citation36
In the present study, gene expression level of IFN-γ and IL-17A was estimated by qPCR in skin lesions of CTB and healthy control. Here we found that IL-17A and IFN-γ expression were significantly low in CTB patients. However, TGF-β was found to be significantly high in these patients as compared to HC group. Moreover, gene expression of IL-17 and IFN-γ were not showing any correlation. This may be unexplained kinetics of the production of cytokines. Results of the present study also demonstrated significant positive correlation and co-expression of FOXP3 and TGF-β by qPCR. To our surprise, IL-17 and IFN-γ did not show any correlations with FOXP3 and TGF-β gene expression. This may be because of Th17 and Treg cells are a distinct population of T helper cells.
To strengthen our study, we evaluated these findings by histopathological analysis followed by flow cytometric analysis to asses it at cellular levels; findings were further confirmed at the molecular level by qPCR. Expression of FOXP3, a transcription factor for Treg cells was also validated by real-time PCR. However, Quantification and analysis of IL-6 and IL-1β in all samples could have given a more insightful picture about this new aspect. Since Th17 and Treg cells have been established as opposite to each other. The differentiation of both cells depends on IL-6, IL-1β and TGF-β balance.Citation37 The involvement of IL-6 and IL-1β might be possible in Th17 and Treg cells differentiation in CTB patients. Therefore further investigation of IL-6 and IL-1β could have given a more conclusive picture. We also understand the heterogeneity of our study population which consists of children and adult in terms of immune impairment in children. Collectively, this study point out a shift in our understanding of the immunological features that mediate and regulate the immune suppression and the disease progression in CTB patients with a new paradigm (TGF-β producing Tregs) that IL-17 may be protective in nature during CTB infection.
Author contributions
All authors contributed toward data analysis, drafting and critically revising the paper, gave final approval of the version to be published, and agree to be accountable for all aspects of the work.
Acknowledgments
CS is grateful to the Department of Science and Technology to National Postdoc Fellowship (PDF/2016/001997), New Delhi, India, for financial support.
Disclosure
The authors report no conflicts of interest in this work.
Supplementary materials
Figure S1 Flow cytometry dot plot are showing gating strategy and unstimulated and PHA control for Th17 cells.
Abbreviation: PHA, phytohemagglutinin.
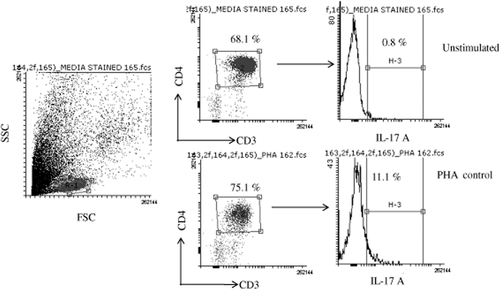
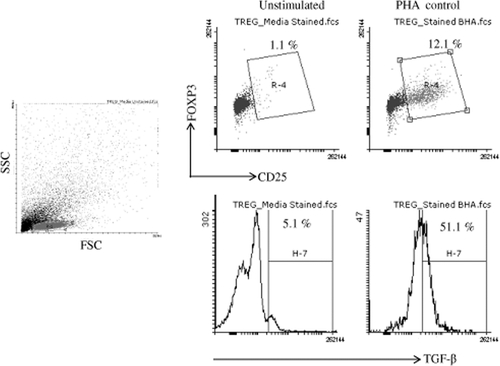
Figure S2 Flow cytometry dot plot are showing gating strategy and unstimulated and PHA control for TGF-β producing Treg cells.
Abbreviation: PHA, phytohemagglutinin.
References
- GlassrothJClinical considerations in designing trials of vaccines for tuberculosisClin Infect Dis200030Suppl 3S229S23210875789
- RowlandRMcShaneHTuberculosis vaccines in clinical trialsExpert Rev Vaccines201110564565821604985
- CasanovaJLAbelLGenetic dissection of immunity to mycobacteria: the human modelAnnu Rev Immunol20022058162011861613
- ChakraborttyRRahmanMAFerdousiKRPaulBKCutaneous tuberculosis: an updateMymensingh Med J201625238539127277379
- DiasMFBernardes FilhoFQuaresmaMVNascimentoLVNeryJAAzulayDRUpdate on cutaneous tuberculosisAn Bras Dermatol201489692593825387498
- LyadovaIVPanteleevAVTh1 and Th17 cells in tuberculosis: protection, pathology, and biomarkersMediators Inflamm2015201585450726640327
- AltareFDurandyALammasDImpairment of mycobacte-rial immunity in human interleukin-12 receptor deficiencyScience19982805368143214359603732
- JungYJLaCourseRRyanLNorthRJVirulent but not avirulent Mycobacterium tuberculosis can evade the growth inhibitory action of a T helper 1-dependent, nitric oxide synthase 2-independent defense in miceJ Exp Med2002196799199812370260
- VilaplanaCPratsCMarzoETo achieve an earlier IFN-γ response is not sufficient to control Mycobacterium tuberculosis infection in micePLoS One201496e10083024959669
- SakaguchiSSakaguchiNAsanoMItohMTodaMImmunologic self-tolerance maintained by activated T cells expressing IL-2 receptor alpha-chains (CD25). Breakdown of a single mechanism of self-tolerance causes various autoimmune diseasesJ Immunol19951553115111647636184
- YagiHNomuraTNakamuraKCrucial role of FOXP3 in the development and function of human CD25+CD4+ regulatory T cellsInt Immunol200416111643165615466453
- HoriSNomuraTSakaguchiSControl of regulatory T cell development by the transcription factor Foxp3Science200329956091057106112522256
- SainiCNathIRameshVRole of Th17 and Foxp3 T cells mechanisms underlying the leprosy spectrumLEPCONMarch 28–30, 2014PGIMR Chandigarh, India
- SainiCRameshVNathIIncrease in TGF-β secreting CD4+ CD25+ FOXP3+ T regulatory cells in anergic lepromatous leprosy patientsPLoS Negl Trop Dis201481e263924454972
- KumarSNaqviRAAliRRaniRKhannaNRaoDNCD4+CD25+ T regs with acetylated FoxP3 are associated with immune suppression in human leprosyMol Immunol201356451352023911408
- LarsonRPShafianiSUrdahlKBFoxp3(+) regulatory T cells in tuberculosisAdv Exp Med Biol201378316518023468109
- SainiCRameshVNathICD4+ Th17 cells discriminate clinical types and constitute a third subset of non Th1, non Th2 T cells in human leprosyPLoS Negl Trop Dis201377e233823936569
- SainiCSiddiquiARameshVNathILeprosy reactions show increased Th17 cell activity and reduced FOXP3+ Tregs with concomitant decrease in TGF-β and increase in IL-6PLoS Negl Trop Dis2016104e000459227035913
- SharmaSKRyanHKhapardeSIndex TB Guidelines: guidelines on extra-pulmonary tuberculosis for IndiaIndian J Med Res2017145444846328862176
- SantosJBFigueiredoARFerrazCEde OliveiraMHda SilvaPGde MedeirosVLSCutaneous tuberculosis: diagnosis, histopathology and treatment – part IIAn Bras Dermatol201489454555525054739
- TorradoECooperAMIL-17 and Th17 cells in tuberculosisCytokine Growth Factor Rev201021645546221075039
- WeissGSchaibleUEMacrophage defense mechanisms against intracellular bacteriaImmunol Rev2015264118220325703560
- BelkaidYRouseBTNatural regulatory T cells in infectious diseaseNat Immunol20056435336015785761
- LiMOWanYYSanjabiSRobertsonAKFlavellRATransforming growth factor-beta regulation of immune responsesAnnu Rev Immunol2006249914616551245
- SadhuSKhaitanBKJoshiBSenguptaUNautiyalAKMitraDKReciprocity between regulatory T cells and Th17 cells: relevance to polarized immunity in leprosyPLoS Negl Trop Dis2016101e000433826751584
- UmemuraMYahagiAHamadaSIL-17-mediated regulation of innate and acquired immune response against pulmonary Mycobacterium bovis bacille Calmette-Guerin infectionJ Immunol200717863786379617339477
- Gonzalez-LombanaCGimbletCBacellarOIL-17 mediates immunopathology in the absence of IL-10 following Leishmania major infectionPLoS Pathog201393e100324323555256
- CurtisMMWaySSInterleukin-17 in host defence against bacterial, mycobacterial and fungal pathogensImmunology2009126217718519125888
- SainiCNathIRameshVRole of TH17 cells in the leprosy spectrumInternational Leprosy CongressSeptember 18–21, 2013Brussels, Belgium
- HuSHeWDuXIL-17 production of neutrophils enhances antibacteria ability but promotes arthritis development during Myco-bacterium tuberculosis infectionEBioMedicine201723889928821374
- JuradoJOPasquinelliVAlvarezIBIL-17 and IFN-γ expression in lymphocytes from patients with active tuberculosis correlates with the severity of the diseaseJ Leukoc Biol2012916991100222416258
- CromeSQWangAYLevingsMKTranslational mini-review series on Th17 cells: function and regulation of human T helper 17 cells in health and diseaseClin Exp Immunol200915910911919912252
- NathICurtisJSharmaAKTalwarGPCirculating T-cell numbers and their mitogenic potential in leprosy – correlation with mycobacterial loadClin Exp Immunol1977293393400338218
- FlynnJLChanJLinPLMacrophages and control of granulomatous inflammation in tuberculosisMucosal Immunol20114327127821430653
- MaJChenTMandelinJRegulation of macrophage activationCell Mol Life Sci200360112334234614625680
- NandiBBeharSMRegulation of neutrophils by interferon-gamma limits lung inflammation during tuberculosis infectionJ Exp Med2011208112251226221967766
- Acosta-RodriguezEVNapolitaniGLanzavecchiaASallustoFInterleukins 1beta and 6 but not transforming growth factor-beta are essential for the differentiation of interleukin 17-producing human T helper cellsNat Immunol20078994294917676045