
Abstract
Background
The prevalence of neuropathic pain (NeP) has been estimated within specific health conditions; however, there are no published data on its broad prevalence in the US. The current exploratory study addresses this gap using the validated PainDetect questionnaire as a screener for probable NeP in a general-population health survey conducted with a multimodal recruitment strategy to maximize demographic representativeness.
Materials and methods
Adult respondents were recruited from a combination of Internet panels, telephone lists, address lists, mall-based interviews, and store-receipt invitations using a random stratified-sampling framework, with strata defined by age, sex, and race/ethnicity. Older persons and minorities were oversampled to improve prevalence estimates. Results were weighted to match the total adult US population using US Census data. Demographic information was collected, and respondents who experienced physical pain in the past 12 months completed the PainDetect and provided additional pain history. A cutoff score of 19 or greater on the PainDetect was used to define probable NeP.
Results
A total of 24,925 respondents (average response rate 2.5%) provided demographic data (52.2% female, mean age 51.5 years); 15,751 respondents reported pain (63.7%), of which 2,548 (15.7%, 95% confidence interval 14.9%–16.5%) had probable NeP based on the PainDetect, which was 10% (95% confidence interval 9.5%–10.5%) of all respondents. Among those reporting pain, the prevalence of probable NeP among Blacks and Hispanics was consistently higher than Whites in each age- and sex group. The highest prevalence among those with pain was among male Hispanics 35–44 years (32.4%) and 45–54 years (24.2%) old. The most commonly used medications reported by those with probable NeP were nonsteroidal anti-inflammatory drugs (44.2%), followed by weak opioids (31.7%), antiepileptics (10.9%), and strong opioids (10.9%).
Conclusion
This is the first study to provide an estimate of the prevalence of probable NeP in the US, showing significant variation by age and ethnicity.
Introduction
According to the International Association for the Study of Pain, neuropathic pain (NeP) is characterized by a “pain arising as a direct consequence of a lesion or disease of the somatosensory system”.Citation1 However, identification of NeP is challenging, given its association with other pain processes and the absence of a “gold standard” diagnostic test. Not surprisingly, it can be difficult to treat effectively and is associated with significant impairments in health-related quality of life along with a substantial economic burden.Citation2,Citation3
The existing literature has primarily investigated the epidemiology of NeP within the context of specific diseases, such as cancer, diabetic peripheral neuropathy (DPN), and chronic low-back pain (CLBP). For example, systematic reviews of patients with cancer have reported prevalence rates of NeP at 19%,Citation4 with similar estimates (20%) among patients with type 2 diabetes.Citation5–Citation9 However, as obesity rates and associated comorbid conditions, such as diabetes and CLBP (resulting from lumbar surgery interventions), continue to increase in the US, the total number of people experiencing NeP is likely to continue to grow.Citation10–Citation13 These trends highlight the need to examine the prevalence of NeP broadly, rather than from a disease-specific perspective.
In spite of the challenges associated with defining NeP, estimating the population prevalence is critical for a number of reasons, including but not limited to quantifying the potential societal burden, calculating the potential health care needs of this population, and guiding health policies. This is particularly pertinent, given that the majority of patients with NeP are treated by primary care physicians in the community, who do not necessarily specialize in the diagnosis or management of NeP.Citation14
To date, the largest NeP-prevalence study conducted in the US, using data from a survey, phone, and clinical examinations, found a prevalence rate of 9.8% among adult Minnesotans.Citation15 The current exploratory study estimates the prevalence of NeP, both overall and among those with pain, using data collected from a nationwide survey.
Materials and methods
Sampling
Data for this study were collected using a cross-sectional survey of adults in the US (aged 18 years and older). The sample size was calculated to ensure a level of precision in each sex-by-age-by ethnicity stratum (the smallest anticipated unit for prevalence calculations) that would not exceed ±2.5%. Subsequently, there is a 95% probability that the true population prevalence resides within 2.5% of the reported-prevalence estimate from our sample. This sample size was larger than what would be required if the true prevalence was around 20%. Participants were recruited via Internet, mail, telephone, shopping-mall interception, and retail store-receipt solicitation. This multimodal approach was used to maximize external validity and avoid potential biases that could occur if only a single approach were used. The frequency of each method was selected to enhance study feasibility and minimize recruiting time (eg, fewer respondents were recruited via mailing lists, because it requires more time and effort to receive responses than other modalities, such as the Internet).
The sampling frame was designed to ensure adequate numbers of participants were included within each age, sex, and race/ethnicity stratum so that reasonable population-prevalence estimates could be derived. Older (65 years of age and above) and minority respondents were oversampled relative to their true proportions in the population to ensure that there were at least 100 participants in each cell (see ). Sampling weights were calculated to adjust the demographic characteristics of the sample to reflect the total adult US population.
Table 1 Demographic characteristics of the study sample (n=24,925)
Recruitment
Participants were recruited from August 2014 to October 2014. Members from several Internet panels (Lightspeed,Citation16 Survey Sampling International,Citation17 and TolunaCitation18) were recruited for this study using previously established methods for mail and Internet surveysCitation19 and subgroup solicitation.Citation20 Potential participants were organized into demographic strata (eg, non-Hispanic White males aged 18–34 years, non-Hispanic White males aged 35–44 years). Then, random sampling was used to identify potential participants within each stratum. Selected individuals were emailed an invitation to complete the survey. Those who clicked on the link were taken to a statement of informed consent, which described the study as a general health survey. Consenters completed an online questionnaire.
Mailing and calling lists (purchased from Marketing Systems Group)Citation21 compiled from phone books and other sources were also used to recruit participants. These lists totaled over 153 million unique records. Potential respondents were first identified by age, sex, and race/ethnicity, and then either randomly mailed or called to ascertain interest. Those on the mailing list (n=80,004) were sent a paper version of the statement of informed consent, the survey, and a self-addressed stamped envelope so that they could return the materials to the research team. A total of 181,770 people on the telephone list were contacted by trained interviewers. Those who were willing to participate and who reported experiencing any pain in the previous 12 months were then asked whether they would prefer to complete the remainder of the survey using the Internet or receive materials by mail, since the PainDetect has not been validated for telephone administration.
To increase sample size, two additional recruitment methods were implemented during the last year of the study. In the first, trained researchers recruited a convenience sample of participants from 20 different shopping malls across the US. Those who were interested completed the informed consent and survey via computer. In the second modality, customers at pharmacies, grocery stores, and convenience stores were supplied with store receipts that included an invitation encouraging them to participate in the study. It directed them to a website that included the statement of informed consent and (upon completion) a link to the survey. All respondents were financially compensated between $1 and $10, depending on the recruitment modality. The study materials were reviewed and approved by an independent institutional review board (Sterling IRB, Atlanta, GA; protocol 161101387-2).
Data handling
For participants completing the survey via the Internet, data entry was completed instantaneously as the respondent answered the survey questions. For participants recruited via telephone, their data were entered manually into the online survey by the telephone interviewer. Respondents participating by mail had their responses manually entered into the database. All data were stored in a relational database, which housed the questionnaire responses and allowed for direct export into statistical software programs. With respect to analysis, all programming and outputs were reviewed by at least two independent researchers.
Measures
All respondents provided their sex, age, race/ethnicity, state of residence, and whether they had experienced any of 19 health conditions or any pain within the last 12 months. Those who self-reported experiencing any pain within the last 12 months were asked to complete the PainDetect, a validated NeP-screening tool and other questions, including demographic, physical, and psychiatric comorbidities, pain types, and medication use.
The PainDetect is a screening tool used to assess the presence of NeP.Citation22 Psychometric analyses indicate it can be used in a number of NeP subpopulations, including CLBP,Citation22 peripheral nerve damage,Citation23 HIV,Citation24–Citation26 posttrauma/postsurgical injury,Citation24–Citation26 spinal cord injury,Citation24–Citation26 small-fiber neuropathy,Citation24–Citation26 neck and shoulder pain,Citation23 and osteoarthritis of the knee,Citation27 as well as a heterogeneous NeP sample.Citation28 The questionnaire does not perform as well in people with neck/upper-limb painCitation29 or fibromyalgia, who were not included in this study.Citation30
Like other NeP-screening measures, the PainDetect includes verbal descriptors and clinical characteristics. It is comprised of three components: pain intensity, pain-course pattern, and gradations of pain. For the first part, respondents used a 0–10 numerical rating scale to report their pain at the time they were completing the questionnaire. Two other items asked participants to use the same rating scale to report the strongest pain and average pain during the preceding 4 weeks. Then, four graphs were presented, and the respondent was asked to choose which best described the course of their pain. Each graph was accompanied by one of the following labels: “persistent pain with slight fluctuations”, “persistent pain with pain attacks”, “pain attacks without pain between them”, or “pain attacks with pain between them”. The third part asked respondents to rate the intensity of seven different pain sensations (eg, burning, tingling) on a scale from 0 (never) to 5 (very strongly).
A total PainDetect score for each respondent was generated by summing the number of points earned on each of the three sections. The screening tool has been shown to have over 80% sensitivity and specificity in paper-and-pencil form, and responses between that format and electronic administration of the instrument were found to be equivalent.Citation31 PainDetect scores can be categorized into three groups: unlikely NeP (0–12), “unlikely” (13–18), and positive/likely NeP (≥19).Citation22 Since this study focused on estimating the prevalence of NeP, scores were dichotomized into “unlikely NeP” (0–18) and “probable NeP” (≥19), which indicates the patient is at risk of NeP.
Participants reported whether they experienced any physical pain in the last 12 months. Those that answered yes completed the PainDetect. Then, participants reported their pain-related experiences. Next, using a checklist, they selected pains that they had experienced for at least 3 of the last 12 months. Then, participants were asked: “Is the pain that you are experiencing nerve pain?” To ensure comprehension, participants were told: “Nerve pain may be described as the feeling of being pricked with pins and needles, shocked by electricity, or may include numbness, burning, or tingling, and can be due to irritation or damage to the nerve. For example, nerve pain from diabetes is often experienced as burning or tingling, and can be due to irritation or damage to the nerve.”
They were then supplied with a checklist that included the same pain types and asked to indicate yes or no for each. Additionally, participants also reported the duration of each pain type by indicating whether it was less than 1 year, between 1 and 5 years, or longer than 5 years. Finally, participants were asked to report the medications they were taking if they experienced nerve pain for at least 3 of the last 12 months. For this item, participants were provided a comprehensive list of medications specified by their trade and generic names and space to report medications not on the list. The medications were then categorized into 13 classes using the Institute of Medicine’s taxonomyCitation32 ().
Statistical analyses
The study was designed to estimate the prevalence of probable NeP by demographic strata. To achieve this objective, older (65 years and above) and minority respondents were oversampled. Sampling weights were calculated to adjust the proportions of demographic strata so that the rate aligned with the June 2015 Current Population Survey of the US Census.Citation33
Frequencies for the sample and the US population were calculated for sociodemographic variables, questionnaire modality, and region of residence. This was followed by calculation of the PainDetect scores and categorization of respondents into probable NeP and unlikely NeP groups. Then, weighted generalized linear models specifying a binomial distribution and controlling for age, sex, and race/ethnicity were used to estimate the adjusted mean percentages of those experiencing NeP by different questionnaire modality. A heat map was used to demonstrate the prevalence of probable NeP across sex, race, and age. Population estimates were used to report the proportions of the population with probable NeP and unlikely NeP by sex, age, race/ethnicity, and region of residence. Then, population estimates for comorbidity (physical and psychiatric) and pain type were derived for those with probable NeP and unlikely NeP. Next, means for the strongest and average pain items from the PainDetect were compared for those with probable and unlikely NeP and who had reported nerve pain for at least 3 of the last 12 months. Then, the frequency and percentage for duration of each pain type was calculated. Finally, population estimates of medication use were reported for those who reported NeP pain and those with likely NeP and self-reported NeP pain using the Institute of Medicine’s taxonomy.Citation32
Corresponding 95% confidence intervals (CIs) are reported when appropriate. The majority of data were collected via Internet questionnaire, which did not allow for skipping items; therefore, analyses were performed on those with completed questionnaires. All analyses were conducted using SAS 9.3.
Results
Prevalence of probable NeP
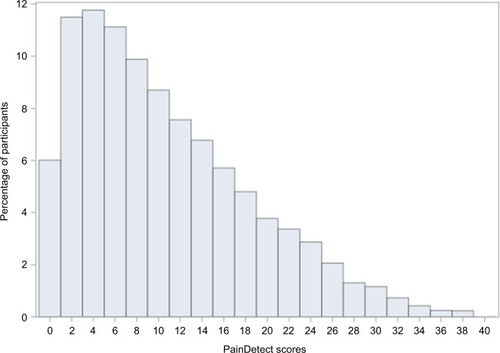
A total of 24,925 respondents were recruited using all five recruitment methods: Internet 15,088 (response rate 2.9%), mail 982 (response rate 1.2%), telephone 2,907 (response rate 1.6%), mall intercept 5,338, and store receipt 590 (response rate 0.3%). The average response rate was 2.5%. Over half (52.2%) of the respondents were female, and the mean age was 51.5 years (see ). Almost two-thirds (63.7%) of respondents reported they had experienced some form of physical pain in the past 12 months and completed the PainDetect to assess the presence of probable NeP (see ). The distribution of PainDetect scores is shown in (mean 10.2, median 8). Among those who reported at least some pain in the past 12 months, a weighted estimate of 15.7% (95% CI 14.9%–16.5%) had probable NeP. This corresponded to a weighted probable NeP-prevalence estimate of 10% (95% CI 9.5%–10.5%) among all respondents.
Figure 1 Study flowchart.
Abbreviation: NeP, neuropathic pain.
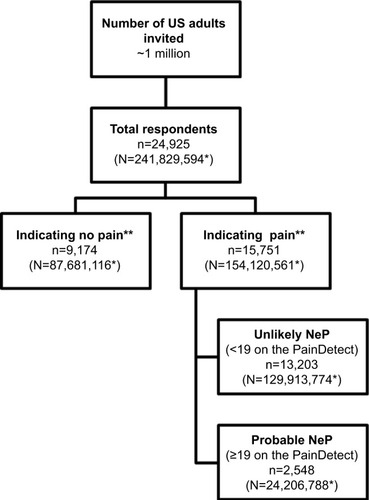
Figure 2 Distribution of PainDetect scores among those with pain (n=15,749).
The recruitment methods produced generally consistent prevalence estimates for probable NeP among adults experiencing pain (11.3%–17.2%). The calculated rate in the overall population was substantially more variable, and ranged from 4.1% to 12.4% (see ). There was substantial variation across demographic strata, as demonstrated in the heat map in . Among adults experiencing any pain, probable NeP was most frequent among Hispanic males 35–44 years old (32.4%), Hispanic males 45–54 years old (24.2%), and non-Hispanic Black females 45–54 years old (24.1%).
Figure 3 Heat map of the weighted prevalence of probable neuropathic pain, based on the PainDetect, among those with pain by demographic strata.
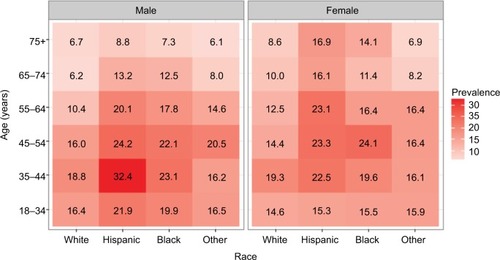
Table 2 Prevalence of NeP based on the PainDetect among all respondents and all respondents with pain by survey modality
Patient characteristics associated with probable NeP versus unlikely NeP
The demographic composition of the probable and unlikely NeP groups were similar across sex; however, the probable-NeP group tended to be younger. The probable-NeP group included more minority participants in general and a much larger percentage of Hispanics. Most participants were from the South, but the probable-NeP group had fewer participants from the Midwest (see ). Respondents with probable NeP reported higher rates of psychiatric-related comorbidities compared with those unlikely to have NeP, such as anxiety (38% vs 25.1%), depression (34.5% vs 21.1%), insomnia (34.2% vs 24.7%), and pain-related conditions like fibromyalgia (10.1% vs 2.6%) and rheumatoid arthritis (14.5% vs 3.9%; see ).
Figure 4 Weighted comorbidity-prevalence estimates among respondents with probable NeP and respondents with pain but unlikely NeP.
Abbreviations: COPD, chronic obstructive pulmonary disease; GERD, gastroesophageal reflux disease; IBS, irritable bowel syndrome; MS, multiple sclerosis; NeP, neuropathic pain; RLS, restless leg syndrome; RA, rheumatoid arthritis; TIA, transient ischemic attack.
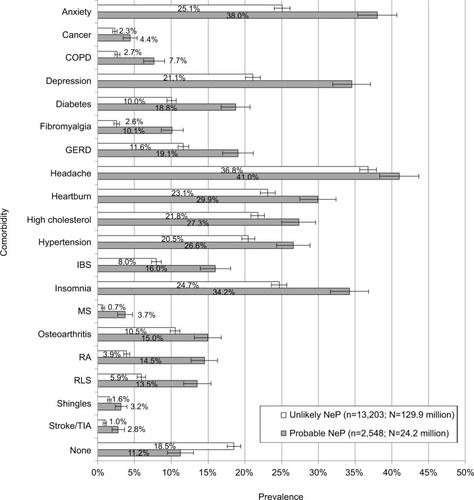
Table 3 Weighted demographic characteristics among respondents with probable NeP and respondents with pain but unlikely NeP
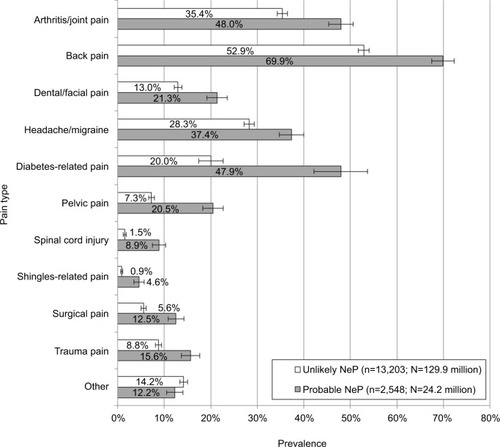
Additionally, respondents with probable NeP reported higher rates of all pain types (see ). For example, those with probable NeP reported higher rates of arthritis/joint pain (48%), back pain (BP) (69.9%), and dental/facial pain (21.3%) compared to those with unlikely NeP, who reported rates of 35.4%, 52.9% and 13%, respectively, for the same conditions. Some of the largest differences were observed for diabetes-related pain (47.9% vs 20% among those with diabetes), spinal cord-injury pain (8.9% vs 1.5%), shingles-related pain (4.6% vs 0.9%), and surgical pain (12.5% vs 5.6%).
Figure 5 Weighted pain-type prevalence among respondents with probable NeP and respondents with pain but unlikely NeP.
Abbreviation: NeP, neuropathic pain.
Self-reported nerve pain and medication use
Those who reported nerve pain for at least 3 of the last 12 months and probable NeP (n=2,177) had higher scores on PainDetect items assessing the strongest pain (mean 8.35, 95% CI 8.29–8.43) and average pain (mean 7.13, 95% CI 7.06–7.2) than unlikely NeP respondents who also reported nerve pain for at least 3 of the last 12 months (n=6,155; strongest pain, mean 6.8, 95% CI 6.74–6.86; average pain, mean 5.06, 95% CI 5–5.11). The majority of participants with probable NeP reported pain duration () of more than 5 years for six of the eleven pain types (arthritis/joint pain, BP, headache/migraine, spinal cord injury, trauma, and other). For three pain types, the majority of participants with probable NeP reported dental/facial pain, shingles, and surgical pain for less than 1 year. Two pain types included a majority of probable NeP respondents who reported experiencing pain for 1–5 years: diabetes-related pain and pelvic pain.
Table 4 Respondents’ duration of pain by pain type
Among respondents reporting nerve pain for at least 3 of the last 12 months, the most commonly reported medication was nonsteroidal anti-inflammatory drugs (48%), followed by weak opioids (32.1%), antiepileptics (11.5%), strong opioids (11.1%), and muscle relaxants (10%). Respondents with probable NeP and self-reported nerve pain for at least 3 of the last 12 months reported taking fewer nonsteroidal anti-inflammatory drugs (41.7%), but more weak opioids (43.1%) and nearly twice the rate of strong opioids (20.9%), muscle relaxants (19.7%), and all adjuvant medications, including antiepileptics (20.2%), antidepressants (12.4%), and N-methyl-d-aspartate antagonists (0.9%). “Other” (3%) included acetaminophen and herbal supplements (see ).
Table 5 Current NeP-medication use by respondents who self-reported experiencing nerve pain for at least 3 months
Discussion
Although some studies have examined the prevalence of broad NeP in Europe,Citation14,Citation26–Citation30 to our knowledge this is the first study to provide an estimate of the prevalence of probable NeP in the US. A total of 15,751 (63.7%) respondents reported experiencing some pain in the past 12 months, and based on PainDetect scores a weighted estimate of 15.7% had probable NeP. This corresponded to a probable-NeP prevalence of 10% in the US population. The proportion of people reporting pain in this study was higher than other studies, such as the National Health Interview Survey, which found that 56% of adults reported pain,Citation34 and the Gallup–Healthways survey, which found that 47% of adults reported pain.Citation35 These disparities may be related to methodological differences. For example, the prevalence identified in the National Health Interview Survey was likely lower because participants were asked to report pain within the last 3 months, rather than a year, as in our study. Nevertheless, the findings reported in this study are consistent with the range of NeP estimates identified in previous research.Citation14,Citation15,Citation36–Citation38 For example, the projected rate of probable NeP in the Gallup–Healthways survey of US respondents randomly selected from the general population was 7.4%,Citation35 the prevalence of NeP among adult Minnesotans was 9.8%,Citation15 and a systematic review of studies by van Hecke et al found that NeP prevalence ranged from 6.9% to 10%, but noted a range of 3%–17% in the 21 studies identified.Citation14
In Europe, the prevalence of NeP ranges from 6.5%Citation39 to 11.8%.Citation40 Torrance et al estimated the prevalence of NeP in the general adult population of the UK at 8%–9% using the Leeds Assessment of Neuropathic Symptoms and Signs.Citation36,Citation38 Bouhassira et al conducted a general-population survey in France using the Douleur Neuropathique 4 (DN4), and found that 6.9% of the population experienced chronic pain with NeP characteristics.Citation37 Similar estimates were reported in Germany (6.5%) using the DN4 and PainDetect.Citation39 A Spanish study of patients treated in the primary care setting reported a slightly higher prevalence of 11.8% for NeP based on clinical assessment.Citation40
Substantial variation was observed with respect to age and ethnicity. The finding that prevalence of probable NeP was highest among middle-aged Hispanics was unexpected, but there is some precedence for this finding. Prior research has found that severe pain and pain interference is more common among Hispanics and non-Hispanic Blacks than non-Hispanic Whites.Citation41 Further, Hispanics with NeP reported more severe pain than non-Hispanic Whites.Citation42
With respect to our finding of NeP peaking in middle age, Bouhassira et al also observed the same effect using the DN4 diagnostic tool to assess NeP.Citation37 Other studies in Finland and the Netherlands have found prevalence to be higher among older persons.Citation43,Citation44 The reason for this discrepancy is unclear. A possible explanation is that the US has a higher incidence of type II diabetes than Europe, which could result in increased levels of DPN and thus a younger population with NeP.Citation45 Studies have shown that surgery rates for CLBP, which can result in NeP, are substantially higher in the US than Europe.Citation11 It is also possible that the higher rates of obesity in the US compared to Europe may be causing NeP-related conditions like diabetes and CLBP to occur earlier.Citation46,Citation47
The results also suggest a significant comorbidity burden among respondents with probable NeP. The greatest differences between those with probable NeP and those unlikely to have it were observed for psychiatric, sleep disorder, and pain-related conditions. This finding is consistent with research conducted in other regions, and highlights the strong interrelationships between pain and mood.Citation48–Citation50 Additionally, the biggest differences in the pain types reported between respondents with probable NeP and those unlikely to have NeP were for pain types that were predominantly neuropathic in origin (eg, diabetes-related pain, spinal cord-injury pain, and shingles-related pain), indicating some convergence between their responses on the PainDetect and the condition reported.
Nevertheless, there were respondents with probable NeP who reported pain types not typically associated with neuropathic symptoms. This finding is consistent with previous work. A different set of studies was conducted to determine the clinical presentation and burden of illness in six different NeP conditions: HIV NeP,Citation51 posttrauma/postsurgical NeP,Citation52 spinal cord injury with NeP,Citation53 CLBP,Citation42 painful diabetic neuropathy,Citation54 and painful peripheral neuropathy with small-fiber involvement.Citation42 In these studies, physicians and patients were required to answer questions regarding NeP, comorbid medical and psychiatric conditions, and medication to treat NeP. These studies noted an increased incidence of medical and psychiatric conditions that were a function of pain severity. These medical conditions included other NeP conditions, fibromyalgia, restless-leg syndrome, and painful conditions typically thought to be nociceptive, such as rheumatoid arthritis. Therefore, it is not surprising that patients with NeP report an increased incidence of other painful conditions, regardless of their origin.Citation42,Citation51–Citation55 It is also possible that the 80% specificityCitation22 of PainDetect coded some nociceptive patients as false-positive NeP patients. If our findings are corroborated in future studies, this has important implications for general pain management and treatment.
Limitations
Although data were obtained from 24,925 respondents, the response rate was very low compared to studies with Internet recruitment (they tend to be 20%–30%), but those studies did not attempt to estimate prevalence.Citation56 However, the low response rate could have resulted in a bias toward respondents who have more painful illnesses than those who chose not to participate, which is evidenced by the finding that the overall rates of pain reported in this study were higher than other studies.Citation34,Citation35 The finding that middle-aged respondents reported higher levels of NeP may also be the result of a self-selection bias; older respondents with NeP could have disproportionately chosen to forgo study participation.
Further, the PainDetect is a screening tool, and the validation studies focused on patients with clear symptomatology. However, it has not been tested in every potential NeP pain (eg, headache). Further, while it might perform well in large-scale epidemiological studies, such as this one, the psychometric properties of the measure have only been examined in studies using selective samples and specific subtypes of NeP. Therefore, it is possible that participants responded in an unexpected manner that may have resulted in an overestimation of prevalence rates.Citation22 Additionally, the diagnosis of NeP cannot replace a thorough clinical assessment. Therefore, it is possible assessments by trained health care providers may yield a different prevalence rate for overall NeP.
Furthermore, all information collected in this study was patient-reported (eg, comorbidities, pain history) and thus subject to recall biases and other self-presentation effects. Additionally, only English-language questionnaires were used, which may have impacted the participation of those who were not fluent speakers of the language.
Conclusion
Among people in the US reporting at least some pain in the last year, 15.7% likely had a syndrome with a neuropathic component. This study suggests prevalence estimates may be higher among some ethnic minorities. Increased attention should be placed on the recognition and treatment of NeP among Hispanics and Blacks, given known health care disparities for pain managementCitation57 and evidence suggesting their pain severity and NeP prevalence is higher than Whites. Finally, the management of NeP should be considered in the context of patients’ overall pain syndrome and comorbid conditions, as these patients frequently have pain from multiple sources and report higher rates of medical and psychiatric comorbidities.
Acknowledgments
The authors would like to acknowledge the contributions of Dr Tim Victor, who provided input into the study design, and Dr Errol Philip, who provided input into the literature review. Dr Victor was a full-time employee of Kantar Health at the time of the study, and Dr Philip was a paid contractor to Kantar Health at the time of the study. This study was sponsored by Pfizer Inc.
The analyses included in this paper were presented at the 35th Annual Scientific Meeting of the American Pain Society, May 11–14, 2016, Austin, TX, USA.
Supplementary material
Table S1 Medications participants reported for nerve pain, categorized by class
Disclosure
AS, MH, BP, JCC, and PH are employees of Pfizer Inc. AHA was employed by Pfizer Inc during and after completion and submission of this study. KC and IK are employees of Kantar Health, which was paid by Pfizer for study design, execution, analysis, and manuscript development. MDD was an employee of Kantar Health at the time of this study. BRS, JDM, and JTF were investigators for the study. They were not financially compensated for their collaborative efforts or publication-related activities, but JTF and JDM have previously served as study design consultant for Pfizer and have received investigator initiated grant funding for studies of pain unrelated to this study. JDM has received research funding from Pfizer for clinical research unrelated to this study. The authors report no other conflicts of interest of this work.
References
- International Association for the Study of PainNeuropathic pain2012 Available from: http://www.iasp-pain.org/Education/Content.aspx?ItemNumber=1698&navItemNumber=576%20-%20NeuropathicpainAccessed January 9, 2017
- LangleyPCVan LitsenburgCCappelleriJCCarrollDThe burden associated with neuropathic pain in Western EuropeJ Med Econ2013161859522970839
- O’ConnorANeuropathic pain: quality-of-life impact, costs and cost effectiveness of therapyPharmacoeconomics20092729511219254044
- BennettMIRaymentCHjermstadMAassNCaraceniAKaasaSPrevalence and aetiology of neuropathic pain in cancer patients: a systematic reviewPain2012153235936522115921
- ArgoffCEColeBEFishbainDAIrvingGADiabetic peripheral neuropathic pain: clinical and quality-of-life issuesMayo Clinic Proceedings2006814 SupplS3S1116608048
- DaviesMBrophySWilliamsRTaylorAThe prevalence, severity, and impact of painful diabetic peripheral neuropathy in type 2 diabetesDiabetes Care20062971518152216801572
- van AckerKBouhassiraDDe BacquerDPrevalence and impact on quality of life of peripheral neuropathy with or without neuropathic pain in type 1 and type 2 diabetic patients attending hospital outpatients clinicsDiabetes Metab200935320621319297223
- SchmaderKEEpidemiology and impact on quality of life of postherpetic neuralgia and painful diabetic neuropathyClin J Pain200218635035412441828
- CaselliniCVinikAClinical manifestations and current treatment options for diabetic neuropathiesEndocr Pract200713555056617872358
- GuhDPZhangWBansbackNAmarsiZBirminghamCLAnisAHThe incidence of co-morbidities related to obesity and overweight: a systematic review and meta-analysisBMC Public Health200998819320986
- DeyoRAFusion surgery for lumbar degenerative disc disease: still more questions than answersSpine J201515227227425598279
- FishbainDAColeBLewisJEGaoJWhat Is the evidence that neuropathic pain is present in chronic low back pain and soft tissue syndromes? An evidence-based structured reviewPain Med201415141524118776
- ThomasDMWeedermannMFuemmelerBFDynamic model predicting overweight, obesity, and extreme obesity prevalence trendsObesity201422259059723804487
- van HeckeOAustinSKKhanRASmithBHTorranceNNeuropathic pain in the general population: a systematic review of epidemiological studiesPain2014155465466224291734
- YawnBPWollanPCWeingartenTNWatsonJCHootenWMMeltonLJ3rdThe prevalence of neuropathic pain: clinical evaluation compared with screening tools in a community populationPain Med200910358659320849570
- Lightspeed [website on the Internet] Available from: http://www.lightspeedresearch.comAccessed January 9, 2017
- Survey Sampling International [website on the Internet] Available from: https://www.surveysampling.comAccessed January 9, 2017
- Toluna [website on the Internet] Available from: http://www.toluna-group.comAccessed January 9, 2017
- DillmanDAMail and Internet Surveys – The Tailored Design Method: 2007 Update with New Internet, Visual, and Mixed-Mode Guide2nd edHoboken (NJ)John Wiley & Sons2006
- FowlerFJJrSurvey Research Methods5th edThousand Oaks (CA)Sage2013
- Marketing Systems Group [website on the Internet] Available from: http://www.m-s-g.com/web/index.aspxAccessed January 9, 2017
- FreynhagenRBaronRGockelUTölleTRPainDetect: a new screening questionnaire to identify neuropathic components in patients with back painCurr Med Res Opin200622101911192017022849
- TimmermanHWilder-SmithOvan WeelCWolffAVissersKDetecting the neuropathic pain component in the clinical setting: a study protocol for validation of screening instruments for the presence of a neuropathic pain componentBMC Neurol2014149424885108
- CappelleriJCKoduruVBienenEJSadoskyAA cross-sectional study examining the psychometric properties of the PainDetect measure in neuropathic painJ Pain Res2015815916725926754
- CappelleriJCBienenEJKoduruVSadoskyAMeasurement properties of PainDetect by average pain severityClinicoecon Outcomes Res2014649750425395867
- CappelleriJCKoduruVBienenEJSadoskyACharacterizing neuropathic pain profiles: enriching interpretation of PainDetectPatient Relat Outcome Meas20167939927462183
- MoretonBJTewVdas NairRWheelerMWalshDALincolnNBPain phenotype in patients with knee osteoarthritis: classification and measurement properties of PainDetect and Self-Report Leeds Assessment of Neuropathic Symptoms and Signs scale in a cross-sectional studyArthritis Care Res2015674519528
- De AndrésJPérez-CajaravilleJLopez-AlarcónMDCultural adaptation and validation of the PainDetect scale into SpanishClin J Pain201228324325321926908
- TampinBBriffaNKGouckeRSlaterHIdentification of neuropathic pain in patients with neck/upper limb pain: application of a grading system and screening toolsPain2013154122813282223973362
- GauffinJHankamaTKautiainenHHannonenPHaanpääMNeuropathic pain and use of PainDetect in patients with fibromyalgia: a cohort studyBMC Neurol2013132123409793
- JunkerUFreynhagenRLänglerKPaper versus electronic rating scales for pain assessment: a prospective, randomised, cross-over validation study with 200 chronic pain patientsCurr Med Res Opin20082461797180618485269
- Institute of MedicineRelieving Pain in America: A Blueprint for Transforming Prevention, Care, Education, and ResearchWashingtonNational Academies Press2011
- TheDataWeb [website on the Internet] Available from: http://thedataweb.rm.census.govAccessed January 9, 2017
- NahinRLEstimates of pain prevalence and severity in adults: United States, 2012J Pain201516876978026028573
- BrownAChronic pain rates shoot up until Americans reach late 50s2012 Available from: http://www.gallup.com/poll/154169/chronic-pain-rates-shoot-until-americans-reach-late-50s.aspxAccessed April 27, 2017
- TorranceNFergusonJAAfolabiENeuropathic pain in the community: more under-treated than refractory?Pain2013154569069923485369
- BouhassiraDLantéri-MinetMAttalNLaurentBTouboulCPrevalence of chronic pain with neuropathic characteristics in the general populationPain2008136338038717888574
- TorranceNSmithBHBennettMILeeAJThe epidemiology of chronic pain of predominantly neuropathic origin: results from a general population surveyJ Pain20067428128916618472
- OhayonMMStinglJCPrevalence and comorbidity of chronic pain in the German general populationJ Psychiatr Res201246444445022265888
- PérezCSaldañaMTNavarroAVilardagaIRejasJPrevalence and characterization of neuropathic pain in a primary-care setting in SpainClin Drug Investig2009297441450
- MosseyJMDefining racial and ethnic disparities in pain managementClin Orthop Relat Res201146971859187021249483
- SchaeferCSadoskyAMannRPain severity and the economic burden of neuropathic pain in the United States: BEAT neuropathic pain observational studyClinicoecon Outcomes Res2014648349625378940
- Rapo-PylkköSHaanpääMLiiraHNeuropathic pain among community-dwelling older people: a clinical study in FinlandDrugs Aging201532973774226363908
- KollenburgEGLavrijsenJVerhagenSCZuidemaSUSchalkwijkAVissersKCPrevalence, causes, and treatment of neuropathic pain in Dutch nursing home residents: a retrospective chart reviewJ Am Geriatr Soc20126081418142522788732
- GuariguataLWhitingDRHambletonIBeagleyJLinnenkampUShawJEGlobal estimates of diabetes prevalence for 2013 and projections for 2035Diabetes Res Clin Pract2014103213714924630390
- Centers for Disease Control and PreventionRates of diagnosed diabetes per 100 civilian, non-institutionalized population, by age, United States, 1980–20142015 Available from: http://www.cdc.gov/diabetes/statistics/prev/national/figbyage.htmAccessed January 9, 2017
- BurkeALMathiasJLDensonLAPsychological functioning of people living with chronic pain: a meta-analytic reviewBr J Clin Psychol201554334536025772553
- GerritsMMvan OppenPvan MarwijkHWPenninxBWvan der HorstHEPain and the onset of depressive and anxiety disordersPain20141551535924012953
- JainRJainSRaisonCLMaleticVPainful diabetic neuropathy is more than pain alone: examining the role of anxiety and depression as mediators and complicatorsCurr Diab Rep201111427528421611765
- LermanSFRudichZBrillSShalevHShaharGLongitudinal associations between depression, anxiety, pain, and pain-related disability in chronic pain patientsPsychosom Med201577333334125849129
- MannRSadoskyASchaeferCBurden of HIV-related neuropathic pain in the United StatesJ Int Assoc Provid AIDS Care201615211412526173942
- ParsonsBSchaeferCMannREconomic and humanistic burden of post-trauma and post-surgical neuropathic pain among adults in the United StatesJ Pain Res2013645946923825931
- MannRSchaeferCSadoskyABurden of spinal cord injury-related neuropathic pain in the United States: retrospective chart review and cross-sectional surveySpinal Cord201351756457023588572
- SadoskyASchaeferCMannRBurden of illness associated with painful diabetic peripheral neuropathy among adults seeking treatment in the US: results from a retrospective chart review and cross-sectional surveyDiabetes Metab Syndr Obes20136799223403729
- SchaeferCMannRSadoskyABurden of illness associated with peripheral and central neuropathic pain among adults seeking treatment in the United States: a patient-centered evaluationPain Med201415122105211925039856
- SchonlauMFrickerRDElliottMNConducting research surveys via e-mail and the web2002 Available from: http://www.rand.org/pubs/monograph_reports/MR1480.htmlAccessed January 10, 2017
- AndersonKOGreenCRPayneRRacial and ethnic disparities in pain: causes and consequences of unequal careJ Pain200910121187120419944378