
 ?Mathematical formulae have been encoded as MathML and are displayed in this HTML version using MathJax in order to improve their display. Uncheck the box to turn MathJax off. This feature requires Javascript. Click on a formula to zoom.
Abstract
Background
Chronic pain clinics aim to improve challenging conditions, and although numerous studies have evaluated specific aspects of therapies and outcomes in this context, data concerning service impact on outcome measures in a general pain population are sparse. In addition, current trends in commissioning increasingly warrant services to provide evidence for their effectiveness. While a plethora of outcome measures, such as pain-intensity or improvement scores, exist for this purpose, it remains surprisingly unclear which one to use. It also remains uncertain what variables predict treatment success.
Objectives
This cross-sectional study was conducted to evaluate clinic performance employing different tools (pain scores, pain categories, responder analysis, subjective improvement, satisfaction), and to determine predictors of outcome measures.
Patients and methods
Patients attending scheduled clinic follow-up appointments were approached. They were asked to complete the modified short-form Brief Pain Inventory (BPI-SF) that also included assessments for satisfaction and subjective improvement. Comparisons were made with BPI-SF responses that were completed by each patient on admission. Nonparametric tests were employed to evaluate service impact and to determine predictors for outcome.
Results
Data of 118 patients were analyzed. There was considerable variation in impact of pain clinics depending on the outcome measure employed. While median pain scores did not differ between admission and follow-up, scores improved individually in 30% of cases, such that more patients had mild pain on follow-up than on admission (relative risk 2.7). Furthermore, while only 41% reported at least moderate subjective improvement after admission to the service, the majority (83%) were satisfied with the service. Positive treatment responses were predicted by “number of painful regions” and “changes in mood”, whereas subjective improvement was predicted by “helpfulness of treatments”.
Conclusion
Depending on the outcome measure employed, pain clinics showed varying degrees of impact on patients’ pain experiences. This calls into question the current practice of using nonstandardized outcome reporting for evaluation of service performances.
Introduction
Chronic pain is a complex phenomenon that is estimated to affect approximately 10 million people in the UK.Citation1 It is notoriously difficult to treat, as every individual’s sensation of pain is determined by an intricate interplay between biopsychosocial factors in a specific context.Citation2,Citation3
During the Second World War, John Bonica was the first to recognize these multiple facets to chronic pain necessitated multimodal management.Citation4 His pioneering work led to the establishment of the first chronic pain clinics in the early 1960s.Citation5 Today, the number of clinics is growing rapidly, particularly in North America and Europe, as governments begin to understand the impact this pain epidemic has on the wider society.Citation6
Although the research concerning chronic pain is vast, the majority of studies have investigated either specific outcomes, such as patient satisfaction in a heterogeneous patient group,Citation7,Citation8 specific outcomes in specific types of chronic pain,Citation9,Citation10 or a range of outcomes in a homogeneous pain population.Citation11 However, data concerning general outcomes and indicating performance of general pain clinics remain sparse. From 2010 to 2012, the first National Pain Audit surveyed the provision of services caring for patients with chronic pain in the UK.Citation12 The audit also evaluated patient-reported outcome measures (PROMs) and experience measures (PREMs) and the tools utilized by clinics to measure the adequacy of their service provision.
PROMs and PREMs are used to gain insight into patients’ experiences of a service and how patients perceive the effectiveness of treatment. They are also increasingly used as a means for service evaluation by governments and as cost-effectiveness indices.Citation13 However, as yet there is not enough evidence to support their suitability for routine use in chronic pain. In addition, conflicting data exist as to whether variables routinely assessed in clinics, such as pain scores, quality-of-life (QoL) indicators, comorbidities, and patient demographics, correlate with or even predict such outcome measures as pain relief or patient satisfaction.Citation14–Citation16
With this survey, we thus aimed to 1) assess the overall performance of a tertiary chronic pain-management service using three different outcome and experience parameters (pain intensity, subjective improvement, and patient satisfaction), 2) determine if routinely assessed clinical variables correlate with these parameters, and 3) determine if routinely assessed clinical variables can predict outcomes.
Patients and methods
The pain-management service at Chelsea and Westminster Hospital, London, UK, is a multidisciplinary team comprising pain physicians, physiotherapists, nurse specialists, and clinical psychologists. It offers treatments for patients suffering from chronic pain, typically musculoskeletal or neuropathic in origin.
Service evaluation
The study was registered with the Research and Development Department at Chelsea and Westminster Hospital as service evaluation, and so did not require formal ethical approval. The data are reported in accordance with the STROBE (STrengthening the Reporting of OBservational studies in Epidemiology) statement.Citation17
Between April 2011 and July 2012, SS and AH, both impartial to the service and hospital, randomly approached patients scheduled for a follow-up appointment in chronic pain outpatient clinics. Patients were excluded if they had not completed an assessment form on admission to the clinic or had difficulties comprehending English.
After verbal consent had been obtained, patients were asked to complete short questionnaires independently and privately to avoid response bias. Patients were encouraged to complete the inventory honestly and as accurately as possible. They were also allowed to ask questions if they felt the questionnaire was unclear. The vast majority followed the instructions without needing further assistance.
On completion, questionnaires were handed directly to the receptionist and collected in a folder that was kept inaccessible to administrative staff and clinicians other than SS and AH. This helped to ensure documents were not read or reviewed on the day. At the end of each clinic, completed questionnaires were collected and stored as per trust information-governance policy.
Records of participating patients were reviewed, and data from Brief Pain Inventories (BPIs) that are routinely completed on patient’s admission to the service retrieved. This data was labeled “Initial assessment” for further analysis and subsequently compared with the follow-up data.
Questionnaires
Two types of questionnaires were employed for the evaluation. Initial assessments were conducted with the original short form of the BPI, (BPI-SF; Symptom Research, University of Texas, Houston, TX, USA), while for follow-up assessments a slightly modified inventory was used.
The BPI-SF was introduced by Cleeland and Ryan in the early 1990s as an assessment tool in cancer pain, but was subsequently also validated for use in chronic noncancer pain.Citation18,Citation19 It is a simple and quick self-reporting questionnaire that consists of nine items. The first six are concerned with the characterization of the painful experience (location and intensity), while two ask about prescribed analgesics and their effect. The last item evaluates the interference of pain with six QoL indices: mood, activity, ability to work, relationship to other people, sleep, and enjoyment of life.
Compared to the original BPI-SF, the follow-up inventory additionally contained questions about demographics, comorbidities, satisfaction with care, and a subjective improvement rating. For the assessments of pain intensity, QoL indices, patient satisfaction, and improvement 11-point numeric rating scales (NRS-11) were employed.
In pain-intensity and QoL evaluations, 0 represented the best- and 10 the worst-possible outcome. Assessments of patient satisfaction and patient improvement employed NRS scales that ranged from 0 (“not at all satisfied”, “no improvement”) to 10 (“complete satisfaction”, “complete improvement”).Citation20–Citation23 Lastly, patients were also given free space on the questionnaire for any comments or suggestions they wanted to share.
Information patients gave about current treatments was verified through review of clinical notes. Because of the plethora of treatments the service offers, evaluation of all therapies individually would have exceeded the scope of this survey. Since pharmacotherapy is a cornerstone in the treatment of chronic pain, “analgesic prescribing” was a priori deemed an appropriate indicator for therapeutic changes made by the service.Citation24,Citation25
Data analysis
First, data were analyzed descriptively. Age and duration of pain were treated as continuous data and presented as means with 95% confidence intervals (CIs). All other data were regarded as discrete or ordinal and shown as medians with range where appropriate.
Pain-intensity ratings, improvement, and satisfaction scores obtained with NRS-11 were converted into descriptive categories where appropriate. Subsequently, scores of 1–4 represented mild, 5–7 moderate, and 8–10 severe or large.Citation26 Changes in proportions of categories on follow-up compared to admission were determined using χ2 tests.
To determine how variables had changed on follow-up compared to admission, a “change score” was calculated:
(1)
A negative score indicated improvement, whereas positive scores implied worsening of the assessed variable. Change scores ≤−2 and ≥+2 were regarded as clinically significant.Citation27,Citation28 Scores were calculated for average pain intensity and all QoL variables. Based on the magnitude of the scores, patients were then divided into three groups: responders (scores ≤−2), nonresponders (scores −1 to +1), and “reverse responders” (scores ≥+2). Improvement and satisfaction scores were divided into only two categories: responders (scores ≥2) and nonresponders (scores ≤2).
Finally, correlations of pain and QoL-change scores with demographics, analgesia use, treatment effect, and pain intensity were analyzed using nonparametric methods (Kendall’s τ). Effect sizes of coefficients thus obtained were categorized as clinically negligible (0<τ<0.1), small (0.1<τ<0.3), medium (0.3<τ<0.5), and large (τ≥0.5).Citation29 Only variables with at least small effect sizes were included into logistic regression models to identify predictors for patients that were categorized responders for pain intensity and subjective improvement.
Figures were created with Prism 5 for Mac (GraphPad Software, La Jolla, CA, USA), and statistical analysis performed with SPSS version 19.0 (IBM Corporation, Armonk, NY, USA). P<0.05 was considered significant.
Results
During the observation period, a total of 126 patients satisfied the inclusion criteria. Eight patients were excluded for failing to complete the questionnaire, leaving 118 patients (47 males, 71 females) for final analysis (). Patients 21–87 years of age suffered from chronic pain for an average duration of 6.1 (range 1.4–18.0) years. The majority suffered from pain in the lower limbs and back. More than half of the cohort had pain in two or three locations ().
Table 1 Demographics and disease characteristics of patients included in the survey
Analgesic medication
The median number of analgesics prescribed increased from 1 (range 0–4) at admission to 2 (range 0–4) at follow-up (). Paracetamol and codeine were the most frequently prescribed drugs, whereas strong opioids were the least frequently prescribed (). The pain service made the largest changes on the prescribing of antidepressants, anticonvulsants, and nonsteroidal anti-inflammatory drugs (NSAIDs). The number of antidepressants and anticonvulsants prescribed increased from 17.8% (n=21) to 51.6% (n=61), whereas nonsteroidal anti-inflammatory drug prescriptions decreased from 24.6% (n=29) to 19.5% (n=23).
Table 2 Medications on admission and follow-up
Patient-reported outcome and experience measures
On admission, 5.1% of patients had pain-intensity scores equivalent to mild pain (). Scores representing moderate pain were present in 52.0%, and ratings equivalent to severe pain were recorded in 42.9% of patients. On follow-up, the proportion of patients reporting mild pain increased to 13.6%, while the proportion of patients with moderate pain decreased to 36.4% (). Changes were statistically significant for mild (P=0.031) and moderate (P=0.016) pain (χ2 test, 2 df; ). The relative risk for patients to experience mild pain was 2.7 (95% CI 1.0–7.1) times greater, and the risk for moderate pain was 30% (relative risk 0.7, 95% CI 0.5–1.0) less on follow-up compared to admission. The proportion of patients with severe pain (50% on follow-up) and its relative risk (1.2, 95% CI 0.9–1.6) remained unchanged ().
Figure 1 Pain-intensity scores on admission and follow-up.
Abbreviation: NA, not applicable (no response recorded).
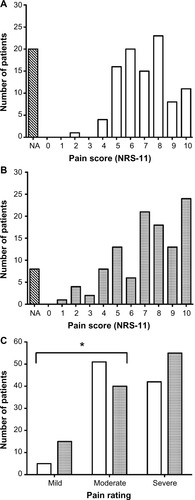
From admission to follow-up, the median (range) pain intensity for the entire study population increased marginally from 7.0 (2–10) to 7.5 (2–10) (). However, when individual change scores for pain intensity were calculated, a more differential picture emerged: now, 31.5% of patients showed improvements, while 68.5% had either deteriorated or not changed.
Table 3 Meaningful changes in BPI-SF variables
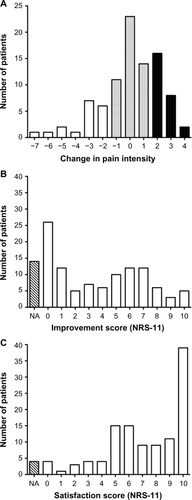
Clinically meaningful change scores for pain intensity ranged from −2 to −7 (improvement, n=18) and 2–4 (deterioration, n=26; ). Score changes of −2 or −3 in those with improvements were observed in 72.2%, and score changes of 2 or 3 in 92.3% for those who deteriorated. This indicated a considerable number of patients scoring just above the threshold for clinically significant changes.
Figure 2 Frequency distributions of scores for change in pain, subjective improvement, and patient satisfaction.
Abbreviation: NA, not applicable (no response recorded).
Change scores were also calculated for QoL indices and patients categorized using the same criteria as for pain intensity. Overall, 16.1%–22.9% of patients improved, while 13.6%–18.6% deteriorated and 37.3%–50.0% showed no change (). Most improvement was observed in patients’ ability to work (22.9%), while greatest deterioration was seen in patients’ mood (18.6%).
A total of 92.4% patients reported some symptom improvement (). In 15.3%, improvement was mild (scores 2–4), in 28.8% moderate (scores 5–7), and in 11.9% large (scores 8–10). However, in 32.2%, no meaningful change (scores <2) was observed. Similarly, 93.2% patients were satisfied with the service, with 50.0% reporting high, 33.1% moderate, and 9.3% low satisfaction ().
Correlation analysis
The change scores for pain intensity showed a significant negative correlation with the number of painful regions and a positive association with number of analgesics on follow-up (). Furthermore, change scores for pain were significantly positively correlated with changes in all QoL indices. However, associations were small except for mood and ability to work, which showed medium effect sizes (). Change in enjoyment of life was negatively correlated with comorbidities and helpfulness of treatments, whereas change in sleep was negatively associated with the number of painful regions.
Table 4 Correlation matrix of variables assessed
Correlation analysis for subjective patient improvement revealed a positive association with age and helpfulness of treatments, as well as a negative association with change in pain, work, and enjoyment of life (). In contrast, patient satisfaction was only positively correlated with the number of comorbidities and helpfulness of treatments ().
Regression analysis
Logistic regression was employed to identify predictors for patients categorized as responders for pain intensity and subjective improvement. A similar approach was attempted for satisfaction but abandoned, because of the skew of data toward high satisfaction ratings. Due to small effect sizes in the correlation analysis, only the QoL variables as well as the number of analgesics at follow-up and the number of painful regions were tested for pain intensity. The number of painful regions (odds ratio 1.5, 95% CI 1.0–2.3; P=0.033) and change in mood (odds ratio 0.6, 95% CI 0.4–0.9; P=0.016) were subsequently found to predict responders (ie, patients with more painful regions were 50% more likely to be responders, and those who had a deterioration in mood score were 40% less likely to be responders). Models employed could explain only 10% (demographic variables) and 41% (QoL variables) of the observed variability (Nagelkerke’s R2).
Further regression analysis for subjective improvement as a dependent variable employed change in pain, work, enjoyment of life, and helpfulness of treatments as independent variables. However, only helpfulness of treatments was identified as a predictor (odds ratio 1.7, 95% CI 1.3–2.2; P=0.001), with the model explaining 50% of the observed variability.
Qualitative data
A total of 35 patients (29.7%) made personal comments on three main issues: “complaints”, “praises”, and “no further comments”; 52.4% of complaints were about administration (cancellation, waiting times, frequency of appointments), 14.3% about staff (indifference, discourteousness), 28.6% about medical issues (condition not improving, inadequate therapies), and 4.8% about insufficient information provided. From all comments, 31.4% included praise for staff members and 8.6% included expressions of “no further comments”.
Discussion
Service impact
Patients included in this study were demographically similar to those of previous reports.Citation12 Most interestingly, however, this survey revealed that the impact of outpatient clinics on chronic pain is dependent on the outcome parameter used to judge it. For instance, if measures of central tendencies (mean or median) were employed to compare pain-intensity ratings on admission to those on follow up, pain clinics seemed not to have an effect at all. Although similar to what has been reported before, this nevertheless raises the question of the clinical appropriateness of this assessment and analytical approach.Citation12,Citation30,Citation31 Support for this notion is also provided here. If numerical scores were converted into categories of mild, moderate, or severe pain and changes analyzed accordingly, clinics were found to make an impact. For instance, patients admitted with moderate pain were almost three times more likely to experience mild pain on follow up. However, data also suggest severe pain was more difficult to treat as the number of patients in this category remained unchanged.
A further approach to measure the influence of pain clinics on patient outcome was the employment of a responder analysis.Citation32 Here, a cutoff was introduced that signified clinically meaningful changes in pain-intensity ratings in relation to treatment. When a cutoff of change of at least 1 points on an NRS-11 was used as suggested previously,Citation27,Citation28 a third of patients in this study were found to have responded to treatment. Conversely, pain intensity remained unchanged or even deteriorated in about two-thirds. Also striking was the observation that changes most often were small, encompassing just 2–3 NRS points. In this regard, it was also surprising that improvement in pain intensity was associated with worsened sleep and that a greater number of painful regions even predicted responders to treatment. Both findings are difficult to explain, as they contradict previous reports.Citation33,Citation34 Mood as predictor for responsive patients and the other QoL indices however changed as expected in parallel with pain intensity.Citation35
The picture of changing outcomes became even more convoluted if subjective patient improvement was taken into account as well. Now, 56% patients reported considerable benefit. Therefore, depending on how outcome was measured, pain clinics seemed to make an impact on 0 to nearly 60% of patients. In accordance with previous reports, 90% of patients were also satisfied with the service.Citation36 Hence, the variability across all assessed outcomes in this study was very large, possibly not only reflecting the multifaceted nature of pain but also the shortcomings of currently available measurement tools. Consequently, the characteristics and purpose of these variables need to be carefully considered before application.
Assessment tools used in pain medicine can be broadly divided into uni- and multidimensional, depending on how many aspects of pain they are appraising.Citation37 NRS scores, for instance, are widely used for self-reported unidimensional evaluation of pain intensity.Citation37 However, the reliability of single ratings has been questioned, and the use of composite NRS scores advocated instead.Citation38 Further, due to unresolved issues surrounding the translation of assessments into treatments, Moore et al even suggested their abandonment in clinical practice for simple questions, such as “Is pain more than mild?” with dichotomous outcomes.Citation31 The conversion of scores into pain categories as done here comes close to this suggestion. However, its retrospective nature might have introduced bias, as individual patients might have disagreed with their classification. Finally, all tools relying on patient self-report depend on intact cognitive function. Since there is mounting evidence indicating this to be altered in chronic pain, another risk of bias might therefore hamper current methods of pain assessment.Citation39
Patient satisfaction and subjective improvement are multidimensional variables, which amalgamate several factors that define a patient’s pain or service experience.16,35 Both are measures of global impression of change, which have been recommended as critical outcome parameters in clinical trials.16,35 However, satisfaction, in particular, is often difficult to interpret.Citation16,Citation40 It might, for instance, mean satisfaction with service provision or effect of treatments. In addition, it might also reflect satisfaction with communication between patient and health care provider or be an expression of patients’ emotional states, such as the feeling of gaining control over the pain again.Citation14,Citation36 Therefore, it is not necessarily specific for pain.Citation40 Here, because of its association with “treatments helping” and “number of comorbidities” but independence of pain intensity and QoL indices, it likely represented a mixed response. The finding that 74% of praise and complaints were about nonmedical issues further supported this notion.
Satisfaction was also related to subjective improvement in this study, a result hardly surprising given the observed large positive skew of both variables. The finding, however, also confirmed a previous report of chronic pain patients admitted into an integrated management program.Citation41 Subjective improvement was additionally associated with age, helpfulness of treatments, improvement in pain intensity, ability to work, and enjoyment of life similar to what has been shown before.Citation16,Citation41 For patients in this cohort, improvement was likely to be a consequence of both reduced pain and functional gain. The supposed positive impact of pain clinics on patients’ health was also supported by these results, as helpfulness of treatments was found to be the only predictor for subjective improvement.
As pharmacotherapy is a cornerstone of pain management, not surprisingly prescriptions of analgesics increased considerably for patients as a consequence of their admission to pain clinics. However, prescribing patterns were in accordance with the latest treatment recommendations.Citation42,Citation43 Therefore, the service made its biggest impact on the prescribing of anticonvulsants, as their use increased approximately from an eighth of patients on admission to a third on follow-up. Conversely, while preadmission use of weak opioids was scarcely changed, strong opioids were newly introduced in about a tenth of patients.
Study limitations
One limitation of the present study might have been the introduction of bias into the assessment of subjective improvement and patient satisfaction. As the employed tools did not allow grading for deterioration or dissatisfaction, a disproportionate skew toward positive responses may have occurred. However, previous reports have not only used similar methods but have also showed minimal negative grading, supporting the validity of the data shown here.Citation20,Citation36
As the statistical models could only explain up to 50% of variability in the data, the present study could be further criticized for not having employed enough predictive variables. However, research methodology has to balance the complex nature of pain with the practicability of questionnaires. Therefore, no method can be expected to cover most aspects of a patient’s pain experience. Nevertheless, as all assessments here were based on widely accepted tools, the results are most likely reliable.
Finally, this study might have also been hampered by the disproportionate inclusion of complex cases. This notion is based on the organizational structure of pain clinics at Chelsea and Westminster Hospital. For instance, patients after uneventful interventions usually receive a telephone follow-up and are often subsequently discharged if their therapeutic goals are met. This leaves further appointments only for patients whose therapeutic trials were unsuccessful or where specific concerns arose. The relatively small number of recruitments in the presence of a sampling period of more than 12 months reflects this. The small sample size also suggests that this study may have been underpowered, and so some of the effects observed could be attributed to type 1 errors (false-positive effects) or type 2 errors (false-negative effects). Although an a priori power calculation could have been conducted, this would have been a fruitless exercise, as the study design could not have been modified to meet any increases in patient numbers without substantially prolonging the sampling period. Despite these potential shortfalls and in light of the few previous reports about pain-service performances, this study is likely to give an accurate account of a contemporary UK outpatient pain clinic.Citation12
Conclusion
This study showed that the impact of a general chronic pain outpatient clinic was highly dependent on the outcome measures employed. Therefore, the question remains of which tool to use. Unidimensional assessments, such as ratings of pain intensity, are hampered by their ability to account only for a single aspect of pain. However, after transformation into a categorical variable, they seemed to be able to discriminate between responders and nonresponders to treatment. On the contrary, multidimensional tools like subjective improvement and satisfaction assess multiple aspects of pain, but were found to have low discriminative value, as the majority of patients presented high scores. As they nevertheless are often employed for service evaluations, the interpretability of results obtained remains uncertain. Therefore, more research is needed to develop instruments that are easily applicable and have high discriminative power. Furthermore, to allow appropriate judgments between services in the future, outcome assessments would not only need to be standardized but also would require benchmark comparisons. National consensus on benchmarks and standards could be achieved through collaboration between professional societies (eg, British Pain Society) and governmental institutions (eg, National Institute of Health and Care Excellence).
Acknowledgments
The authors thank Dr CS Cleeland for permission to use the Brief Pain Inventory. Part of this study was presented at the British Pain Society Annual Scientific Meeting 2012, Liverpool, UK, and the Association of Anesthetists Great Britain and Ireland Annual Congress 2014, York, UK.
Disclosure
The authors report no conflicts of interest in this work.
References
- British Pain SocietyNOP Pain Poll. [homepage on the Internet]LondonBritish Pain Society2005 Available from: https://www.britishpainsociety.org/contact-us/Accessed July 30, 2014
- VarrassiGMüller-SchwefeGPergolizziJPharmacological treatment of chronic pain – the need for CHANGECurr Med Res Opin20102651231124520337502
- WeisbergMBClavelALWhy is chronic pain so difficult to treat? Psychological considerations from simple to complex carePostgrad Med1999106614114210576008
- SenSMartinDPBaconDRExploring origins: Was John Bonica’s model of modern-day pain management influenced by John Lundy’s earlier work?Reg Anesth Pain Med200732325826217543824
- WitteWPain and anesthesiologyAnaesthesist201160655556621630064
- BreivikHCollettBVentafriddaVCohenRGallacherDSurvey of chronic pain in Europe: prevalence, impact on daily life, and treatmentEur J Pain200610428733316095934
- HirshATAtchisonJWBergerJJPatient satisfaction with treatment for chronic pain – predictors and relationship to complianceClin J Pain200521430231015951647
- SilvemarkAJKällménHPortalaKMolanderCLife satisfaction in patients with long-term non-malignant pain – relating LiSat-11 to the Multidimensional Pain Inventory (MPI)Health Qual Life Outcomes200867018811930
- DarlowBFullenBMDeanSHurleyDABaxterGDDowellAThe association between health care professional attitudes and beliefs and the attitudes and beliefs, clinical management, and outcomes of patients with low back pain: a systematic reviewEur J Pain201216131721719329
- GeorgeSZHirshATDistinguishing patient satisfaction with treatment delivery from treatment effect: a preliminary investigation of patient satisfaction with symptoms after physical therapy treatment of low back painArch Phys Med Rehabil20058671338134416003661
- OsteloRWde VetHCClinically important outcomes in low back painBest Pract Res Clin Rheumatol200519459360715949778
- PriceCHoggartBOlukogaOde C WilliamsABottleANational Pain Audit Final Report 2010–2012LondonBritish Pain Society2012 Available from: http://www.nationalpainaudit.org/media/files/NationalPainAudit-2012.pdfAccessed April 18, 2015
- Department of HealthEquity and Excellence: Liberating the NHSLondonDepartment of Health2010 Available from: https://www.gov.uk/government/uploads/system/uploads/attachment_data/file/213823/dh_117794.pdfAccessed April 18, 2015
- PellinoTAWardSEPerceived control mediates the relationship between pain severity and patient satisfactionJ Pain Symptom Manage19981521101169494309
- CarlsonJYoungbloodRDaltonJABlauWLindleyCIs patient satisfaction a legitimate outcome of pain management?J Pain Symptom Manage200325326427512614961
- DworkinRHJensenMPGouldETreatment satisfaction in osteoarthritis and chronic low back pain: the role of pain, physical and emotional functioning, sleep, and adverse eventsJ Pain201112441642420869325
- von ElmEAltmanDGEggerMPocockSJGøtzschePCVandenbrouckeJPThe Strengthening the Reporting of Observational Studies in Epidemiology (STROBE) statement: guidelines for reporting observational studiesJ Clin Epidemiol200861434434918313558
- CleelandCSRyanKMPain assessment: global use of the Brief Pain InventoryAnn Acad Med Singapore19942321291388080219
- KellerSBannCMDoddSLScheinJMendozaTRCleelandCSValidity of the Brief Pain Inventory for use in documenting the outcomes of patients with noncancer painClin J Pain200420530931815322437
- SalisburyCBurgessALattimerVDeveloping a standard short questionnaire for the assessment of patient satisfaction with out-of-hours primary careFam Pract200522556056915964865
- KeurentjesJCBlaneDBartleyMKeurentjesJJFioccoMNelissenRGSocio-economic position has no effect on improvement in health-related quality of life and patient satisfaction in total hip and knee replacement: a cohort studyPloS One201383e5678523520456
- SlomanRWrubleAWRosenGRomMDetermination of clinically meaningful levels of pain reduction in patients experiencing acute postoperative painPain Manag Nurs20067415315817145489
- AfilaloMTseliosCPain relief versus patient satisfactionAnn Emerg Med19962744364388604854
- ChenPPChenJGinTOut-patient chronic pain service in Hong Kong: prospective studyHong Kong Med J200410315015515181217
- GriffithsDPNoonJMCampbellFAPriceCMClinical governance and chronic pain: towards a practical solutionAnaesthesia200358324324812603454
- JensenMPSmithDGEhdeDMRobinsinLRPain site and the effects of amputation pain: further clarification of the meaning of mild, moderate, and severe painPain200191331732211275389
- FarrarJTYoungJPJrLaMoreauxLWerthJLPooleRMClinical importance of changes in chronic pain intensity measured on an 11-point numerical pain rating scalePain200194214915811690728
- SalaffiFStancatiASilvestriCACiapettiAGrassiWMinimal clinically important changes in chronic musculoskeletal pain intensity measured on a numerical rating scaleEur J Pain20048428329115207508
- HemphillJFInterpreting the magnitudes of correlation coefficientsAm Psychol2003581787912674822
- JensenMPHoffmanAJCardenasDDChronic pain in individuals with spinal cord injury: a survey and longitudinal studySpinal Cord2005431270471215968299
- MooreRAStraubeSAldingtonDPain measures and cut-offs – ‘no worse than mild pain’ as a simple, universal outcomeAnaesthesia201368440041223347230
- DionneRABartoshukLMogilJWitterJIndividual responder analyses for pain: does one pain scale fit all?Trends Pharmacol Sci200526312513015749157
- MooreRAStraubeSPaineJPhillipsCJDerrySMcQuayHJFibromyalgia: moderate and substantial pain intensity reduction predicts improvement in other outcomes and substantial quality of life gainPain2010149236036420347225
- AnderssonHIThe course of non-malignant chronic pain: a 12-year follow-up of a cohort from the general populationEur J Pain200481475314690674
- GeisserMEClauwDJStrandVGendreauRMPalmerRWilliamsDAContributions of change in clinical status parameters to Patient Global Impression of Change (PGIC) scores among persons with fibromyalgia treated with milnacipranPain2010149237337820332060
- McCrackenLMEvonDKarapasETSatisfaction with treatment for chronic pain in a specialty service: preliminary prospective resultsEur J Pain20026538739312160513
- BreivikHBorchgrevinkPCAllenSMAssessment of painBr J Anaesth20081011172418487245
- JensenMPTurnerJARomanoJMFisherLDComparative reliability and validity of chronic pain intensity measuresPain199983215716210534586
- SchiltenwolfMAkbarMHugAEvidence of specific cognitive deficits in patients with chronic low back pain under long-term substitution treatment of opioidsPain Physician201417192024452649
- GordonDBPellinoTAMiaskowskiCA 10-year review of quality improvement monitoring in pain management: recommendations for standardized outcome measuresPain Manag Nurs20023411613012454804
- TanGJensenMPThornbyJIAndersonKOAre patient ratings of chronic pain services related to treatment outcome?J Rehabil Res Dev200643445146017123185
- KalsoEAldingtonDJMooreRADrugs for neuropathic painBMJ2013347f733924355386
- National Institute for Health and Care ExcellenceLow Back Pain: Early Management of Persistent Non-specific Low Back PainManchesterNICE2009 Available from: http://www.nice.org.uk/guidance/cg88/resources/guidance-low-back-pain-pdfAccessed April 18, 2015