
Abstract
Purpose
Ginkgo biloba extract (GBE) contains diterpene ginkgolides (DGs), which have been shown to have neuroprotective effects by a number of previous studies. We previously demonstrated part of the action of DG. However, the impact of DG on the prefrontal cortex (PFC) remains unclear. Here, we evaluated the effects of DG and venlafaxine (for comparison) on behavioral and metabolite changes in the PFC using mice models and gas chromatography–mass spectrometry-based metabolomics.
Materials and methods
Mice were randomly divided into control (saline), DG (12.18 mg/kg) and venlafaxine (16 mg/kg) groups. After 2 weeks of treatment, depression and anxiety-related behavioral tests were performed. Metabolic profiles of the PFC were detected by gas chromatography–mass spectrometry.
Results
The DG group exhibited positive effects in the sucrose preference test. The differential metabolites were mainly related to amino acid metabolism, energy metabolism and lipid metabolism. The results indicated that the DG group exhibited perturbed lipid metabolism, molecular transport and small-molecule biochemistry in the PFC. Compared with the control group, pathway analysis indicated that venlafaxine and DG had similar effects on alanine, aspartate and glutamate metabolism.
Conclusion
These findings demonstrate that DG has antidepressant-like, but not anxiolytic-like, effects in mice, suggesting that it might have therapeutic potential for the treatment of major depressive disorder.
Introduction
Along with an increase in interpersonal and work-related stress, the incidence of some mental illnesses has risen in recent years, imparting a heavy burden on patients and society.Citation1 Mental illnesses such as depression and anxiety are major public health issues, and there is an urgent need to identify new effective drugs.Citation2–Citation5 Research has indicated that traditional Chinese medicines have great potential for treating these diseases. Moreover, compared with Western medicines, traditional Chinese medicines tend to have minor side effects,Citation6,Citation7 which is therapeutically advantageous.
Ginkgo biloba extract (GBE) contains many compounds, the most important of which are flavonoids (ginkgo-flavone glycosides) and terpenoids (ginkgolides and bilobalide).Citation8,Citation9 Recent studies have demonstrated that some components of GBE may exert antidepressant-like effects.Citation10–Citation14 The adverse effects of ginkgo are typically mild, transient and reversible, although potentially serious adverse effects include bleeding and seizures.Citation15–Citation18 Diterpene ginkgolides (DGs), components of GBE, yield a wide variety of biochemical properties and activities. Numerous pharmacologic studies have shown that DG, mainly composed of ginkgolides A, B and K (in the standardized extract EGb761), is responsible for the main pharmacologic (neuroprotective) effects of GBE.Citation12,Citation19–Citation21 DG Meglumine Injection, a novel medicinal plant product, primarily contains ginkgolides A, B and K.
The prefrontal cortex (PFC) plays major roles in emotion, cognition and learning.Citation22,Citation23 Convergent evidence highlights the differential contributions to the various regions of the PFC in cognitive control. The PFC has been shown to be critical in the development and improvement of depression. Research in our laboratory has focused on major depressive disorders for many years,Citation24–Citation27 and our previous studies have demonstrated the key roles of the PFC in depression in animal models and patients.Citation24,Citation28–Citation32
Metabolomics, which is the quantitative measurement of the dynamic metabolic response of living systems to pathophysiological stimuli or genetic modification, has recently been extensively used for investigating biochemical alterations, exploring potential pathophysiological mechanisms and evaluating the therapeutic effects of drugs.Citation33 In this study, we used gas chromatography–mass spectrometry (GC-MS)-based metabolomics combined with principal component analysis (PCA) and partial least squares-discriminant analysis (PLS-DA) to examine the metabolite changes induced by DG in the PFC of mice. We also examined the effects of DG on behavioral function. Furthermore, we compared the effects of DG with those of venlafaxine, in an effort to provide insight into the therapeutic potential of DG for the treatment of mental illnesses such as depression.
Materials and methods
Animals
C57BL/6J male mice (age 8 weeks; weight 18–20 g) were obtained from the Chongqing Medical University Laboratory Animal Center. They were housed in a room at 23°C±1°C, with a 12/12 h light/dark cycle, 50%±5% humidity and free access to food and water. This study was approved by the Ethics Committee of Chongqing Medical University, and all procedures were conducted in accordance with the National Institutes of Health Guide for the Care and Use of Laboratory Animals.
Reagents
DG was injected at a dose of 25 mg/mL and was provided by Jiangsu Kanion Pharmaceutical Co., Ltd (Jiangsu, China). Venlafaxine was purchased from Sigma-Aldrich (Shanghai, China).
Experimental design
The mice were habituated to the housing conditions for 1 week, then divided into the following three groups: control (saline), DG (dose of 12.18 mg/kg)Citation34 and venlafaxine (venlafaxine diluted in 0.9% NaCl solution to a dose of 16 mg/kg). Over the next 2 weeks, the mice were injected intraperitoneally daily between 8:00 AM and 10:00 AM with the same amount of solution.
Behavioral tests
We assessed behaviors using the sucrose preference test, the open field test and the elevated plus maze (EPM) test after treatment.
Sucrose preference test
Before the experiment, the mice were fed 1% sugar water for 72 h for habituation. Mice were then deprived of water and food for 24 h and given 1% sugar water and pure water. Then, 12 h later, the positions of the sugar water and pure water were switched. Thereafter, 24 h later, we calculated the preference for the sugar water.
Open field test
The open field test evaluates the spatial exploration behavior in rodents. The box (44×44×30 cm) was divided into two zones, with a 22×22 cm center zone. The mice were placed in the center of the box, habituated for 30 s and video-recorded for 5 min. We then measured the rearing time, the traveled distance, the permanence time and the number of entries into different zones using SMART software. All data were exported into an Excel file.
EPM test
The EPM is widely used to assess the anxiety-like behavior in rodents. In the current study, the maze was composed of two open arms and two closed arms (30×6 cm). The mice were placed in the center of the maze with the head toward the open arms, habituated for 30 s and video-recorded for 5 min. We then recorded the traveled distance, the permanence time and the number of entries into different zones using SMART software. All data were exported into an Excel file.
Tissue collection and processing
Mice were sacrificed by decapitation after a final injection. The PFCs were quickly frozen in liquid nitrogen and stored at −80°C until use in metabolomics analyses.
Sample processing
For the metabolomics study, the procedures were performed as in our previous study.Citation31 Each PFC was treated with 20 μL internal standard (L-2 chlorophenylalanine, 0.03 mg/mL in methanol) and 500 μL of a methanol, water and chloroform solution (5:2:2, v/v/v; Tissuelyser-192; Jingxin, Shanghai, China). The mixture was then sonicated for 5 min, incubated at 4°C for 20 min and centrifuged at 14,000 rpm for 15 min at 4°C. The supernatant (300 μL) was transferred to a derivatization bottle and dried using a centrifugal concentration apparatus. Thereafter, 80 μL of a 15 mg/mL methoxyamine hydrochloride solution in pyridine was added to the vial, vortexed for 2 min and incubated for 90 min at 37°C for the oximation reaction. Subsequently, the solution was derivatized with 80 μL of BSTFA (1% TMCS) and 20 μL of n-hexane at 70°C for 60 min and then placed at room temperature for 30 min before GC-MS analysis.
GC-MS analysis
GC-MS analysis was performed using the Agilent 7890 a/5975 c GC/MSD system, with an Agilent HP-5 ms capillary chromatographic column (30 m, 0.25 mm, 0.25 μm). The parameters were as follows: injection port temperature, 280°C; EI ion source temperature, 230°C; quadrupole temperature, 150°C; helium (purity >99.999%) as the carrier; carrier gas velocity, 6 mL/min; each sample was applied for metabolite separation; sample quantity, 0.5 μL; initial temperature of 70°C for 2 min, rate of 6°C/min until 160°C, then a rate of 10°C/min to 240°C, and a final rate of 20°C/min to 300°C, maintained for 6 min. Full scan mode was used to detect the mass spectrum, and the range of mass spectrometry detection was 50–600 (m/z). Continuous sample analysis using random order was performed, and the impact of instrument signal fluctuation was corrected.
Metabolite identification and data processing
GC-MS metabolite profiles were converted into the NetCdf file format using TagFinder for peak integration.Citation35 Low-molecular-weight metabolites were identified as chromatographic peaks in total ion current chromatograms. The R software platform was used for data preprocessing, including baseline filtering, peak identification, integration, correcting retention time and attribution analysis of mass spectrometry fragments. Excel software was used to correct for loss from the column and for rejecting impurity peaks and quantitating the ions. The final results were converted to a two-dimensional data matrix containing sample information, retention times and the response intensity of the mass spectrum. The internal standard was used for data quality control. Finally, we obtained 242 components. The peak area normalization method was used to normalize response spectrum peak intensity, and a data matrix was generated.
The data matrix was imported into a SIMCA-P+ 11.5 software package. We used unsupervised PCA to study the distribution between samples and the stability of the whole process of analysis. PCA is an unsupervised multidimensional statistical analysis method, which can assess the overall metabolic differences between groups and the variability within each group. To identify the differential metabolites among groups, we evaluated the overall difference with supervised PLS-DA. Variable weight (variable importance in projection [VIP]) >1 was considered to indicate a differential variable. To prevent overfitting, seven round cross-validation and 200-response permutation tests were used to verify the PLS-DA model.
We combined the PLS-DA and t-test were combined to screen for metabolites among groups (VIP >1, p<0.05). Differences in metabolites were identified using the workstation software, which can compare the characteristics of each compound’s fragmentation patterns with a standardized fragment ion spectral library in the National Institute of Standards and Technology and Fiehn metabolomics databases. In general, a similarity of >70% can be considered to indicate a match with the standard.
Cytoscape software 3.4.0 was used to build the correlation network between these differential metabolites in venlafaxine or DG. The correlation analyses between the behavioral results and the metabolites were performed using Pearson’s correlation coefficients.
Bioinformatics analysis
Ingenuity Pathways Analysis (IPA; Ingenuity Systems)Citation56 was used to analyze the metabolomics data for the various groups (DG, control and venlafaxine).Citation36 In addition, we used MetaboAnalyst 3.0Citation37 to obtain detailed information about the differential metabolites and to create heat maps of all the metabolites. This program employs the Kyoto EncyclopediaCitation57 of Genes and Genomes.
Statistical analysis
The behavioral and molecular data were expressed as means ± standard error of the mean and analyzed with one-way analysis of variance using SPSS 21.0 (IBM Corporation, Armonk, NY, USA). GraphPad Prism 7.0 was used for plotting all data. A p-value of <0.05 was considered to indicate a significant difference.
Results
Behavioral testing
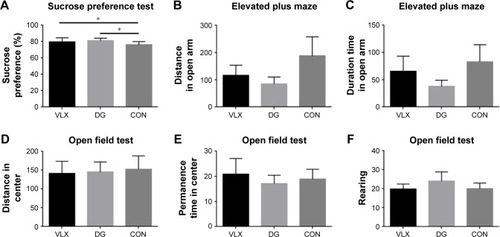
The sucrose preference test revealed a significant increase in sucrose preference in the DG group, consistent with our previous findingsCitation34 (). The open field test and the EPM were used to evaluate the level of anxiety-like behavior of rodents. There were no significant differences in the EPM test (; p>0.05). In the open field test, there was no significant difference among the three groups when analyzed using the standard distance in the center zone, duration time in the center zone and rearing behavior ().
Figure 1 (A) Sucrose preference (%). (B–F) Open field test and EPM test results. (B) Distance in the open arm. (C) Time spent in the open arm. (D) Distance traveled in the center. (E) Immobility time in the center. (F) Rearing. *p<0.05.
Metabolomic analysis
We performed the following comparisons: venlafaxine vs DG, venlafaxine vs control and venlafaxine vs DG, using PCA and PLS-DA. The PCA results were as follows: venlafaxine vs DG (R2X=0.598, Q2=0.376), venlafaxine vs control (R2X=0.569, Q2=0.324) and DG vs control (R2X=0.431, Q2=0.197). The main components of PCA are R2X and Q2. Generally, the main parameter for judging the quality of the model is R2X, which represents how well the model explains the data. An R2X value >0.4 indicates that the model is reliable. Therefore, the PCA model is suitable for explaining the metabolic differences among the three groups. The PLS-DA results were as follows: venlafaxine vs DG (R2X=0.844, R2Y=0.964, Q2=0.882), venlafaxine vs control (R2X=0.871, R2Y=0.996, Q2=0.974) and DG vs venlafaxine (R2X=0.722, R2Y=0.718, Q2=0.3). In the supervised PLS-DA, R2Y and Q2 are the two important parameters. Q2 >0.5 indicates that the model performs well in discriminant analysis (the greater the value, the better the performance in discriminant analysis). The results of the PCA and PLS-DA models are shown in . We examined the stability of the model with a permutation test using 200 iterations. The PLS-DA model was validated, with no overfitting (). The criteria for significant metabolic differences were VIP >1 and p<0.05 ().
Figure 2 PCA is an unsupervised multidimensional statistical analysis method, which can explain the overall metabolic differences between groups and the variability within each group.
Abbreviations: CON, control; DG, diterpene ginkgolide; PCA, principal component analysis.
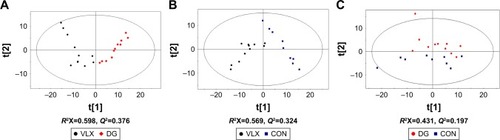
Figure 3 PLS-DA is a supervised analysis method. In the supervised PLS-DA, R2Y and Q2 are the two important parameters. Q2 >0.5 indicates that the model performs well in discriminant analysis.
Abbreviations: CON, control; DG, diterpene ginkgolide; PLS-DA, partial least squares-discriminant analysis; VLX, venlafaxine.
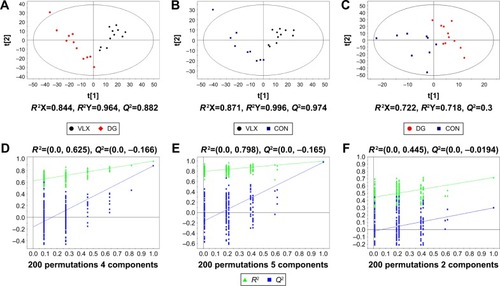
Table 1 Key differential metabolites in the DG and CON groups in the mouse prefrontal cortex
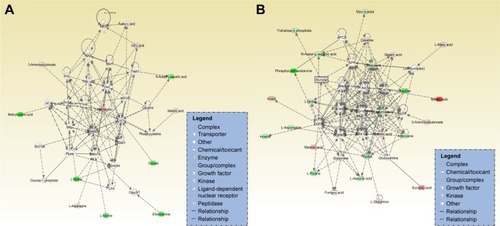
A total of 18 differentially expressed metabolites were identified by comparing the differences between the DG group and the control group (). The results for the Venlafaxine (VLX) group and the control group are shown in . These metabolites were subsequently uploaded to the IPA web site for molecular interaction network analysis. The most significantly altered network was then generated with a score of 34. The differential metabolites of VLX and DG groups are shown in . The network involved 12 metabolites, including citric acid, cholesterol, 3-aminoisobutyric acid, methionine, asparagine, malonic acid, alanine, octanal, ethanolamine, N-acetyl-l-aspartic acid (NAA), methylmalonic acid and l-proline (). Another network of venlafaxine is shown in . The differential metabolites of VLX and DG groups are shown in .
Figure 4 Heat map of the differential metabolites in the CON and DG groups.
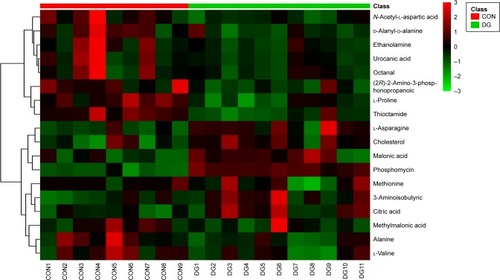
Figure 5 VLX and control groups.
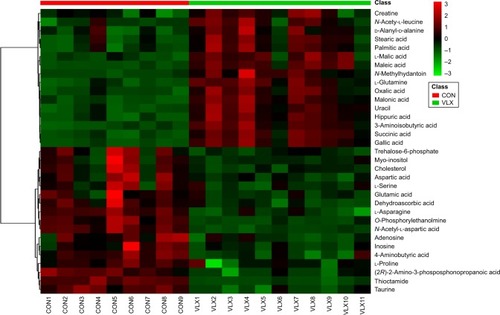
Figure 6 Red shows upregulation, green shows downregulation and yellow represents the opposite changes of the metabolites in the DG and VLX groups.
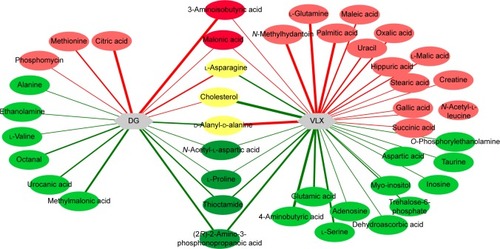
Figure 7 (A) The network involved 12 metabolites, including citric acid, cholesterol, 3-aminoisobutyric acid, methionine, asparagine, malonic acid, alanine, octanal, ethanolamine, N-acetyl-l-aspartic acid, methylmalonic acid and proline. Red indicates an increase in the metabolite, while blue indicates a decrease. Other metabolites are uncolored. (B) The relationship of metabolites in the network of venlafaxine.
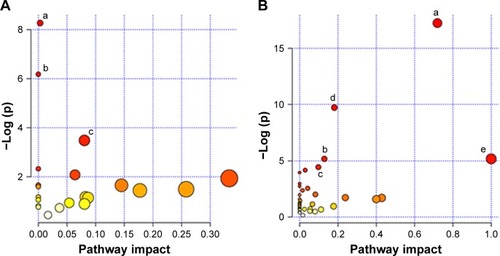
We also imported the differential metabolites of DG group into MetaboAnalyst 3.0 to identify the significant pathways. The major pathways were alanine, aspartate and glutamate metabolism, aminoacyl-tRNA biosynthesis, citrate cycle (tricarboxylic acid cycle) and pyrimidine metabolism (). These molecules are mainly involved in amino acid metabolism, energy metabolism and lipid metabolism. Similarly, the significant pathways in the venlafaxine group were alanine, aspartate and glutamate metabolism, arginine and proline metabolism, nitrogen metabolism, aminoacyl-tRNA biosynthesis, d-glutamate metabolism and cyanoamino acid metabolism ().
Figure 8 (A) Metabolite pathways in the DG group. (B) Metabolite pathways in the VLX group.
Abbreviations: DG, diterpene ginkgolide; TCA, tricarboxylic acid; VLX, venlafaxine.
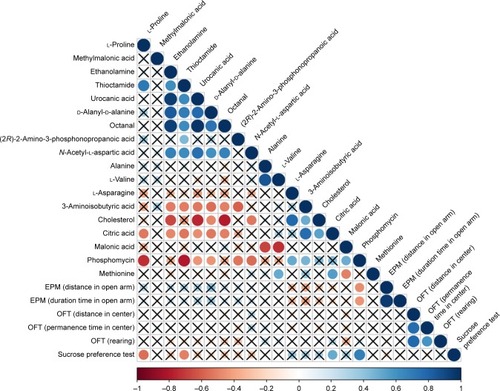
Correlation analysis was conducted between metabolites and behaviors. The results are shown in and . Comparing the VLX and control groups, N-methylhydantoin and sucrose preference test exhibited a positive correlation (). Correlation analysis of the DG group revealed a positive association of citric acid and phosphomycin in the sucrose preference test, a negative correlation of l-proline and thioctamide in the sucrose preference test and a negative association of phosphomycin in the EPM ().
Figure 9 Differential metabolites were correlated with behavior.
Abbreviations: EPM, elevated plus maze; OFT, open field test.
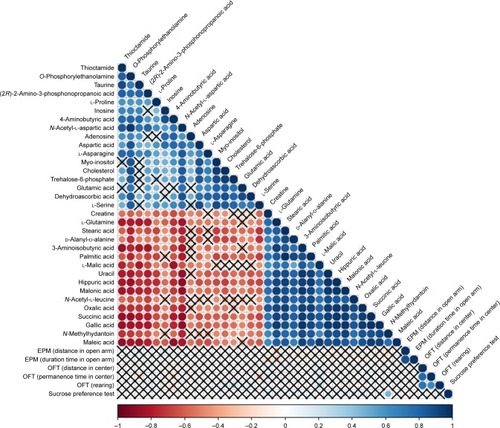
Figure 10 Correlation analysis of the DG group revealed a positive association of citric acid and phosphomycin in the sucrose preference test, a negative correlation of l-proline and thioctamide in the sucrose preference test and a negative association of phosphomycin in the EPM.
Discussion
Proton nuclear magnetic resonance, GC-MS and liquid chromatography–mass spectrometry are the main analytical platforms adopted in metabolomics studies, but proton nuclear magnetic resonance suffers from low sensitivity and may not detect metabolites with low abundance.Citation38 In recent years, combinations of gas chromatography–quadrupole time-of-flight mass spectrometry and liquid chromatography–quadrupole time-of-flight mass spectrometry have been applied successfully in numerous metabolomics studies to achieve more sensitive and accurate metabolic profiling and screening of biomarkers.Citation39 Gas chromatography–quadrupole time-of-flight mass spectrometry is a possible method that could be used for analyzing the metabolite changes and pathways.
DG-induced behavior change
Our previous studies on DG, using the sucrose preference test and the tail suspension test, revealed an antidepressant-like behavioral effect of the medicine. Our present findings are consistent with previous observations. However, there were no significant differences in the open field test or the EPM. Our findings revealed that DG improves depression-like behavior but does not exert an anxiolytic-like effect. Mice treated with venlafaxine exhibited little change in the open field and EPM tests, compared with the control or DG group. This is consistent with a previous study showing that venlafaxine does not ameliorate anxiety-like behavior in the EPM test.Citation40
Amino acid metabolism
The differential amino acids included proline, thioctamide, urocanic acid, alanine, valine, asparagine, NAA, 3-aminoisobutyric acid and methionine. Among these metabolites, asparagine, 3-aminoisobutyric acid and methionine were upregulated. The other metabolites were decreased. The enzyme asparagine synthetase produces asparagine, adenosine monophosphate, glutamate and pyrophosphate from aspartate, glutamine and adenosine triphosphate. Glutamine’s major role in the brain is that of a precursor of the neurotransmitter amino acids: the excitatory amino acids, glutamate (Glu) and aspartate (Asp), and the inhibitory amino acid, γ-aminobutyric acid (GABA). It is reported to be decreased in models of depression.Citation41 The increased concentration of asparagine suggests that asparagine synthetase is more active, which might increase glutamine and adenosine triphosphate levels. Moreover, NAA was decreased compared with the control group. NAA is a derivative of aspartic acid that is mainly stored in the neurons and can be used as an indicator or observation index in central nervous system diseases. Previous studies have shown that higher concentrations of NAA could be found in depressed rats,Citation28,Citation41 and antidepressants can downregulate its concentration. In the current study, NAA was also decreased in the venlafaxine group, consistent with previous findings. Therefore, the results indicated that DG can exert antidepressive effects. NAA may stimulate metabotropic glutamate receptors to affect neurons in CA3, which is one of the most vital regions of the hippocampus. Previous research in our laboratory suggested that the concentration of NAA and aspartic acid was lower in the hippocampus. The pathogenesis of depression is currently unclear, and the mechanisms underlying the action of antidepressants remain to be further elucidated. Some networks are known to operate between the hippocampus and PFC, and NAA may play a role in these networks when treating depression with antidepressants. All these require further research.Citation42
As the raw material of GABA, alanine can regulate the excitability of neurons, and chronic treatment with alanine can have an antianxiety-like effect. In addition, alanine can inhibit oxidative stress to relieve the cortical spread of depression. However, in the current study, alanine was downregulated compared with the control group.
The differential metabolites (malonic acid and 3-aminoisobutyric acid) were upregulated compared with the control group after treatment with DG and venlafaxine. The downregulated differential metabolites were l-proline, NAA, thioctamide and (2R)-2-amino-3-phosphonopropanoic acid, and the alanine, aspartate and glutamate metabolism pathways showed significant effects. Aspartate and glutamate are the major neurotransmitters in the central nervous system, and the latter is the precursor of GABA. GABA is a crucial inhibitory transmitter; hence, a perturbation in GABA levels might lead to anxiety or depression. Clinical data suggest that the deficit of GABA can relate to anxiety and panic disorder.Citation43 Therefore, the absence of alteration of GABA in our study suggests that even though DG has an antidepressant-like effect similar to venlafaxine,Citation44,Citation45 its anxiolytic-like effects remain to be discovered.
Energy metabolism
Citric acid is an intermediary substance in energy metabolism and can be found in all animal tissues. Previous studies demonstrated that chronic fluoxetine treatment can direct energy metabolism toward the citric acid cycle and oxidative phosphorylation.Citation46 The results suggested that citric acid could improve the symptoms of depression. Citric acid can also act as an antioxidant to enhance the resistance to oxidative stress.Citation47 Unopposed oxidative stress is linked to neurodegenerative diseases and depression.Citation48 Thus, DG treatment may be beneficial for nervous system function. Furthermore, the correlation analysis of the DG group and behavior revealed that citric acid was significantly increased in the sucrose preference test. Thus, DG may exert antidepressant-like effects by changing the concentration of citric acid.
Lipid metabolism
Lipid metabolism is critical for numerous cell biologic processes, playing a key role in energy metabolism in specialized tissues, such as the liver and adipose tissue. It is also important for the hormonal and neurologic control of cell functions that affect gene expression and cell signaling.Citation49 Previous studies by our research group identified a correlation between depression and lipid metabolism.Citation31,Citation50 Indeed, the IPA revealed that ethanolamine, which is correlated with lipid metabolism, was decreased. Ethanolamine can inhibit mitochondrial function and has been implicated in the pathophysiology of affective illnesses such as depression and bipolar disorder.Citation51 Other research groups have also demonstrated that ethanolamine has direct inhibitory effects on the mitochondrial electron transfer chain and oxidative phosphorylation in vitro. These findings suggest a close relationship between mitochondrial dysfunction and altered phospholipid content in the brains of patients with depression and bipolar disorder.Citation52 Therefore, DG may improve the symptoms of depression and bipolar disorder, at least in part, by altering lipid metabolism.
All of the metabolites included in energy metabolism were increased, while lipids were decreased. A number of previous studies have reported that depression is associated with changes in lipid levels, which can be altered by antidepressants.Citation25,Citation42,Citation53,Citation54 A previous study in our laboratory suggested that DG might inhibit lipid metabolism, thereby exerting an antidepressant effect.Citation34
In addition to the differential metabolites previously identified in the hippocampus,Citation34 we found that alanine and NAA were decreased in both the hippocampus and the PFC. In addition, asparagine was decreased and ethanolamine was increased in the hippocampus. However, opposite changes were observed in the PFC. Alanine is a precursor to glutamate, glutamine, β-alanine and GABA. These molecules play key roles in excitatory and inhibitory transmission in the brain.Citation55 The opposite changes in ethanolamine and asparagine levels in the PFC and hippocampus suggest that these brain regions may show different responses to DG. Further studies are needed to clarify the differential effects of DG in the brain and to further elucidate the specific metabolite changes and pathways involved.
Conclusion
The current study revealed an antidepressant-like behavioral effect of DG in mice, but not an anxiolytic-like effect. The major metabolite changes were in amino acid metabolism, energy metabolism and lipid metabolism. Our findings indicated that DG improves the symptoms of depression, and that it might yield neuroprotective effect. However, clinical data have not yet been obtained, highlighting the need for further research into the use of DG for the treatment of depression and other mental illnesses.
Acknowledgments
This work was supported by the National Key R&D Program of China 2017YFA0505700 and the National Natural Science Foundation of China (grant nos 81401140 and 81371310).
Disclosure
The authors report no conflicts of interest in this work.
References
- ZhengPZengBZhouCGut microbiome remodeling induces depressive-like behaviors through a pathway mediated by the host’s metabolismMol Psychiatry201621678679627067014
- NgQXPetersCHoCYXLimDYYeoWSA meta-analysis of the use of probiotics to alleviate depressive symptomsJ Affect Disord2017228131929197739
- NgQXVenkatanarayananNHoCYClinical use of hypericum perforatum (St John’s wort) in depression: a meta-analysisJ Affect Disord201721021122128064110
- KirschIDeaconBJHuedo-MedinaTBScoboriaAMooreTJJohnsonBTInitial severity and antidepressant benefits: a meta-analysis of data submitted to the food and drug administrationPLoS Med200852e4518303940
- JakobsenJCKatakamKKSchouASelective serotonin reuptake inhibitors versus placebo in patients with major depressive disorder. A systematic review with meta-analysis and trial sequential analysisBMC Psychiatry20171715828178949
- CaiSQWangXShangMYXuFLiuGX“Efficacy yheory” may help to explain characteristic advantages of traditional Chinese medicinesZhongguo Zhong Yao Za Zhi2015401734353443 Chinese26978986
- WongTWWongSLDonnanSPBTraditional Chinese medicine and Western medicine in Hong Kong: a comparison of the consultation processes and side effectsJ Hong Kong Med Assoc1993454278284
- ItilTMartoranoDNatural substances in psychiatry (Ginkgo biloba in dementia)Psychopharmacol Bull19953111471587675979
- KleijnenJKnipschildPGinkgo bilobaLancet19923408828113611391359218
- YehKYShouSSLinYXChenCCChiangCYYehCYEffect of Ginkgo biloba extract on lipopolysaccharide-induced anhedonic depressive-like behavior in male ratsPhytother Res201529226026625346240
- ZhaoYZhangYPanFThe effects of EGb761 on lipopolysaccharide-induced depressive-like behaviour in C57BL/6J miceCent-Eur J Immunol2015401111726155178
- MaSLiuXXuQZhangXTransport of ginkgolides with different lipophilicities based on an hCMEC/D3 cell monolayer as a blood-brain barrier cell modelLife Sci201411429310125139831
- RojasPSerrano-GarciaNMedina-CamposONPedraza-ChaverriJOgrenSORojasCAntidepressant-like effect of a Ginkgo biloba extract (EGb761) in the mouse forced swimming test: role of oxidative stressNeurochem Int201159562863621672588
- MaLWangSTaiFEffects of bilobalide on anxiety, spatial learning, memory and levels of hippocampal glucocorticoid receptors in male Kunming micePhytomedicine2012201899623083816
- ErnstEHarmless herbs? A review of the recent literatureAm J Med199810421701789528737
- ErnstEPossible interactions between synthetic and herbal medicinal products. Part 2: a systematic review of the direct evidencePerfusion20001326070
- ErnstEProfessional’s handbook of complementary and alternative medicinesFocus Altern Complement Ther20005156
- DeFeudisFVGinkgo biloba Extract: Pharmacological Activities and Clinical ApplicationsAmsterdamElsevier1991
- MaclennanKMDarlingtonCLSmithPFThe CNS effects of Ginkgo biloba extracts and ginkgolide BProg Neurobiol200267323525712169298
- OberpichlerHSauerDRossbergCMennelHDKrieglsteinJPAF antagonist ginkgolide B reduces postischemic neuronal damage in rat brain hippocampusJ Cereb Blood Flow Metab19901011331352298830
- LiebgottTMiollanMBerchadskyYDrieuKCulcasiMPietriSComplementary cardioprotective effects of flavonoid metabolites and terpenoid constituents of Ginkgo biloba extract (EGb 761) during ischemia and reperfusionBasic Res Cardiol200095536837711099163
- CardinalRNParkinsonJAHallJEverittBJEmotion and motivation: the role of the amygdala, ventral striatum, and prefrontal cortexNeurosci Biobehav Rev200226332135212034134
- MurrayEAWiseSPInteractions between orbital prefrontal cortex and amygdala: advanced cognition, learned responses and instinctive behaviorsCurr Opin Neurobiol201020221222020181474
- WangZLiWChenJProteomic analysis reveals energy metabolic dysfunction and neurogenesis in the prefrontal cortex of a lipopolysaccharide-induced mouse model of depressionMol Med Rep20161321813182026718926
- ZhengPChenJJHuangTA novel urinary metabolite signature for diagnosing major depressive disorderJ Proteome Res201312125904591124224655
- LiuXZhengPZhaoXDiscovery and validation of plasma biomarkers for major depressive disorder classification based on liquid chromatography-mass spectrometryJ Proteome Res20151452322233025784130
- ZhouXHetrickSECuijpersPComparative efficacy and acceptability of psychotherapies for depression in children and adolescents: a systematic review and network meta-analysisWorld psychiatry201514220722226043339
- ChenGYangDYangYAmino acid metabolic dysfunction revealed in the prefrontal cortex of a rat model of depressionBehav Brain Res201527828629224861712
- LiuLZhouXZhangYThe identification of metabolic disturbances in the prefrontal cortex of the chronic restraint stress rat model of depressionBehav Brain Res201630514815626947756
- WangWGuoHZhangSXTargeted metabolomic pathway analysis and validation revealed glutamatergic disorder in the prefrontal cortex among the chronic social defeat stress mice model of depressionJ Proteome Res201615103784379227599184
- WuYFuYRaoCMetabolomic analysis reveals metabolic disturbances in the prefrontal cortex of the lipopolysaccharide-induced mouse model of depressionBehav Brain Res201630811512727102340
- YangYYangDTangGProteomics reveals energy and glutathione metabolic dysregulation in the prefrontal cortex of a rat model of depressionNeuroscience201324719120023727007
- NicholsonJKWilsonIDOpinion: understanding “global” systems biology: metabonomics and the continuum of metabolismNat Rev Drug Discov20032866867612904817
- LiangZBaiSShenPGC-MS-based metabolomic study on the antidepressant-like effects of diterpene ginkgolides in mouse hippocampusBehav Brain Res201631411612427498146
- LuedemannAStrassburgKErbanAKopkaJTagFinder for the quantitative analysis of gas chromatography-mass spectrometry (GC-MS)-based metabolite profiling experimentsBioinformatics200824573273718204057
- MayburdALMartlinezASackettDIngenuity network-assisted transcription profiling: identification of a new pharmacologic mechanism for MK886Clin Cancer Res20061261820182716551867
- XiaJSinelnikovIVHanBWishartDSMetaboAnalyst 3.0-making metabolomics more meaningfulNucleic Acids Res201543W1W251W25725897128
- OngESCuiFCZouLOngCNA multi-analytical approach for metabolomic profiling of zebrafish (Danio rerio) liversMol Biosyst20095328829819225620
- ZhangBZhangHDuCMetabolic responses of the growing Daphnia similis to chronic AgNPs exposure as revealed by GC-Q-TOF/MS and LC-Q-TOF/MSWater Res201711413514328237781
- LapmaneeSCharoenphandhuJCharoenphandhuNBeneficial effects of fluoxetine, reboxetine, venlafaxine, and voluntary running exercise in stressed male rats with anxiety- and depression-like behaviorsBehav Brain Res201325031632523707245
- NiYSuMLinJMetabolic profiling reveals disorder of amino acid metabolism in four brain regions from a rat model of chronic unpredictable mild stressFEBS Lett2008582172627263618586036
- BaiSZhouCChengP1H NMR-based metabolic profiling reveals the effects of fluoxetine on lipid and amino acid metabolism in astrocytesInt J Mol Sci20151648490850425884334
- GoddardAWCortical and subcortical gamma amino acid butyric acid deficits in anxiety and stress disorders: clinical implicationsWorld J Psychiatry201661435327014597
- Gonzalez-BurgosGLewisDAGABA neurons and the mechanisms of network oscillations: implications for understanding cortical dysfunction in schizophreniaSchizophr Bull200834594496118586694
- RawlsSMGomezTStaglianoGWRaffaRBMeasurement of glutamate and aspartate in PlanariaJ Pharmacol Toxicol Methods200653329129516332445
- FilipovicDCostinaVPericIStanisavljevicAFindeisenPChronic fluoxetine treatment directs energy metabolism towards the citric acid cycle and oxidative phosphorylation in rat hippocampal nonsynaptic mitochondriaBrain Res20171659415428119059
- Abdel-SalamOMYounessERMohammedNAMorsySMOmaraEASleemAACitric acid effects on brain and liver oxidative stress in lipopolysaccharide-treated miceJ Med Food201417558859824433072
- NgQXKohSSHChanHWHoCYXClinical use of curcumin in depression: a meta-analysisJ Am Med Dir Assoc201718650350828236605
- WangSPYangHWuJWGauthierNFukaoTMitchellGAMetabolism as a tool for understanding human brain evolution: lipid energy metabolism as an exampleJ Hum Evol201477414925488255
- WuYTangJZhouCQuantitative proteomics analysis of the liver reveals immune regulation and lipid metabolism dysregulation in a mouse model of depressionBehav Brain Res201631133033927247144
- KatoTKatoNMitochondrial dysfunction in bipolar disorderBipolar Disord200023 Pt 118019011256685
- Modica-NapolitanoJSRenshawPFEthanolamine and phosphoethanolamine inhibit mitochondrial function in vitro: implications for mitochondrial dysfunction hypothesis in depression and bipolar disorderBiol Psychiatry200455327327714744468
- BiliciMEfeHKorogluMAUyduHABekarogluMDegerOAntioxidative enzyme activities and lipid peroxidation in major depression: alterations by antidepressant treatmentsJ Affect Disord2001641435111292519
- MaesMSmithRChristopheALower serum high-density lipoprotein cholesterol (HDL-C) in major depression and in depressed men with serious suicidal attempts: relationship with immune-inflammatory markersActa Psychiatr Scand19979532122219111854
- Francisco EdaSGuedesRCNeonatal taurine and alanine modulate anxiety-like behavior and decelerate cortical spreading depression in rats previously suckled under different litter sizesAminoAacids2015471124372445
- KrämerAGreenJPollardJJrCausal analysis approaches in Ingenuity Pathway AnalysisBioinformatics201430452353024336805
- HashimotoKGotoSKawanoSKEGG as a glycome informatics resourceGlycobiology200616563R70R