
Abstract
Background
Spinal cord injury (SCI) has imposed a great impact on the quality of life of patients due to its relatively young age of onset. The pathophysiology of SCI has been proven to be complicated. Microglia plays an important role in neuroinflammation and second injuries after SCI. Different environment and other factors may determine the microglial activation profile and what role they play. However, neither accurate time-course profiles of microglial activation nor influence factors have been demonstrated in varied SCI models.
Methods
A rat compressive SCI model was used. Microglial activation profile and contents of inflammatory factors including IL-1β, IL-6 and TNF-α were detected. Myelination status as well as levels of iron and glutamate concentration, adenosine triphosphate (ATP) and potassium are also assessed.
Results
Our results showed that the activated microglia participating in immune-mediated responses peaked at day 7 post SCI and gradually decreased during the following 3 weeks. Contrarily, myelination and oligodendroglia showed an opposite trend, indicating that microglia may be a key factor partly through inflammatory reaction. Iron and glutamate concentration were found to be the highest at day 7 after SCI while both ATP and potassium reached a low valley at the same time.
Conclusion
These findings showed a microglial activation profile and the alterations of associated factors after experiment SCI model. Moreover, our data suggest that high iron and glutamate concentration may be released by damaged oligodendroglia and contribute to the activation of microglial after SCI.
Introduction
Spinal cord injury (SCI) is a serious neurologic disease requiring more effective treatments. The incidence of SCI is varied and the data in Asia is 12–61 cases/1 million with a mortality rate of 5.8%–16%.Citation1 These data are much higher than those in developed countries.Citation2 Patients with SCI are often accompanied with severe physical activity disorders.Citation3 Due to a relatively young age of onset, SCI not only has great impact on the quality of life of the patients but also brings great pressure to the social health system.
The pathophysiology of SCI includes myelin loss, axonal degradation, oxidative stress, inflammatory response, activation of various cytokines, cell death, etc.Citation4–Citation7 Previous research has demonstrated that oligodendroglia apoptosis has been observed after SCI and has led to the occurrence of chronic demyelination.Citation8 Furthermore, microglia, widely located throughout the central nervous system (CNS), have also contributed to the mechanism of SCI. As the main mediator of the CNS’s innate immune response, microglia play an important role in neuroinflammation and second injuries after nerve injury.Citation9–Citation11 Primary traumatic SCI can induce the release of reactive oxygen species (ROS) and inflammatory factors, triggering the activation of microglia.Citation8 In recent years, it has been recognized that microglia play a dual role in traumatic brain and SCI.Citation12,Citation13 On the one hand, microglia can promote tissue recovery, but on the other hand, they also cause nerve degeneration. Different environment and other factors may determine the microglial activation profile and what role they play. However, accurate time-course profiles of microglial activation have not been demonstrated in varied SCI models. Abdanipour et alCitation8 showed that microglia activation reached a peak at day 2 as compared to other days after SCI, whereas other reports observed the peak had been at day 7 post-injury.Citation14 Thus, one purpose of our study was to evaluate the microglial activation profile using a rat compressive SCI model. Though the activation of microglial is influenced by many factors after injury, specific factors are far from clear.Citation10,Citation15 At certain concentrations, glutamate can induce microglial to activate, releasing pro-inflammatory factors.Citation16 Iron, ATP and potassium content are vital factors related to immune response post injury.Citation17–Citation19 The other objective of our study was to explore factors affecting the activation of microglia.
Materials and methods
Animals
A total of 108 male, adult Sprague Dawley rats (6–8 weeks) weighing between 230 and 270 g were purchased from Hua Fukang Biological Technology Co., Ltd, Beijing, China. They were housed on a 12-hour light/dark cycle at 23°C ± 1°C with free access to food and water and were acclimatized for 1 week before the experiment began. All experiment protocols of this study including animal usages and the surgical procedures were approved by the Animal Care and Use Committee of Nanjing Medical University and were in accordance with the Guide for the Care and Use of Laboratory Animals by the National Institutes of Health (NIH).
Groups and experimental design
Rats were randomized into six experimental groups: 1) sham operation group (n=18), 2) 1 day after SCI group (n=18), 3) 3 days after SCI group (n=18), 4) 7 days after SCI group (n=18), 5) 14 days after SCI group (n=18), and 6) 28 days after SCI group (n=18). All the rats from the groups underwent an assessment of their motor function before injury and at varied days after the operation. Finally, all the spinal cords were harvested. In each group, six rats were for the Western blot analysis, another six for histologic staining and the other six for detection of pro-inflammatory cytokines and factors.
Compressive SCI model
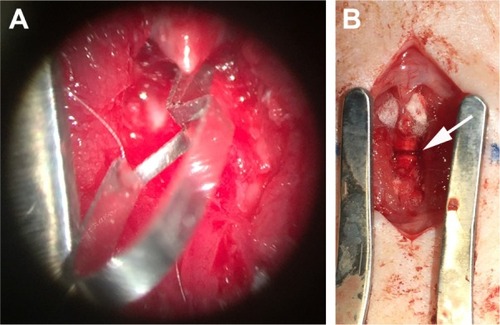
Rats were firstly anesthetized with 10% chloral hydrate (0.35 mL/100 g) through intraperitoneal injection. Half the quantity (0.17 mL/100 g) was then injected every hour for continuous anesthesia throughout the entire experiment. Rats were placed in the prone position on a warming pad. All surgeries were performed by the same surgeon following the methods outlined previously.Citation14,Citation20 Briefly under aseptic conditions, the T10 spinal cord segment was fully exposed by T9-T11 dorsal laminectomies leaving the dura intact using an operating microscope (M500-N, Leica, Heerbrugg, Switzerland). Subsequently, compressive injury was induced by a 2-minute compression SCI using a 10 g aneurysm clip (5.0 mm*0.8 mm, Kent Scientific, Torrington, CT, USA; ). Attention was paid to whether the rats had a tail flicking and several quick twitches of double hind limbs followed by soft paralysis. The clip was carefully removed avoiding rotation and traction 2 minutes post clipping and the stratified incision was finally closed. The sham operation group only received the vertebral laminectomies to expose the spinal cord according to the above steps without clipping.
Figure 1 Compressive SCI model.
Abbreviation: SCI, spinal cord injury.
Post-operative care
All rats were allowed to recover in a warmed cage, and food and water was easily accessible. Animals were given postoperative analgesia (50 mg/kg buprenorphine) subcutaneously to prevent pain. Saline (2 mL) was given through subcutaneous injection immediately after the operation. The antibiotic gentamicin (5 mg/kg, intramuscular) was also administered daily for the following 7 days or until the animals were euthanized.
Motor function assessment
The Basso, Beattie, and Bresnahan (BBB) Locomotor Rating Scale was performed to assess the motor function of the rats before the operation, after the rats recovered from anesthesia completely, and at days 1, 3, 7, 14, and 28 post injury in the different groups. The BBB score ranges from 0 (no hindlimb movement) to 21 (normal motor function).Citation21 Two blinded observers evaluated the score individually, and the average value of the two observers’ scores was chosen.
Spinal tissue preparation
At days 1, 3, 7, 14, and 28 post injury, the rats in the SCI group and the sham operation group were anesthetized, and transcardially perfused with pre-cooled saline. For isolation of protein, the spinal cord containing the lesion area was carefully removed from the vertebrae column, immediately frozen in liquid nitrogen, and then transferred to a −80°C freezer until use. For Luxol fast blue (LFB) staining and immunohistochemistry, the rats were perfused with the above saline followed by cold 4% paraformaldehyde. The injury site and adjacent spinal cord tissue were removed and immersed in 4% paraformaldehyde overnight. For immunofluorescence, the specimens were subsequently immersed in 20% sucrose followed by 30% sucrose. For determination of pro-inflammatory cytokines and factors such as iron, glutamate, ATP and potassium, the injured areas of spinal cord were removed and carefully collected.
Western blot analysis
Firstly, the frozen samples were homogenized in extract buffer with protease inhibitors (PMSF) and centrifuged at 12,000× g for 15 minutes at 4°C. Then, protein concentrations were determined by the Bradford method. Equal amounts of protein per lane were separated by 10% sodium dodecyl sulfate-polyacrylamide gel electrophoresis and transferred to polyvinylidene difluoride (PVDF) membranes. The membranes were blocked for 2 hours in blocking buffer [Tris-buffered saline/0.05% Tween 20 (TBST) containing 5% skim milk] and then incubated overnight at 4°C with primary antibodies against Myelin basic protein (MBP) (1:1,000; Abcam, Cambridge, MA, USA) and β-actin (1:5,000; Bioworld Technology Inc., St Louis Park, MN, USA) in blocking buffer. After being washed with TBST (3×10 minutes), the membranes were incubated with goat anti-rabbit horseradish peroxidase-conjugated IgG (1:5,000; Bioworld Technology) for 2 hours at room temperature. Finally, the protein bands were visualized by enhanced chemiluminescence (ECL) Western blot detection reagents (EMD Millipore, Billerica, MA, USA). Band density was quantified using Un-Scan-It 6.1 software (Silk Scientific Inc., Orem, UT, USA).
LFB staining
Myelination of the spinal cord was evaluated via LFB staining. Briefly, spinal cord serial sections (5 µm thick) were dehydrated in a gradient of ethanol and stained in 0.1% solvent blue 38 (Leagene Biotechnology Co., Ltd, Beijing, China) in acidified 95% ethanol overnight at 60°C. After rinsing with 95% ethanol and distilled water, sections were then differentiated with 0.05% Li2CO3 and 35% ethanol several times until the contrast between gray matter and white matter was clearly detected. The measurements were performed with the aid of ImageJ software (version 1.51; National Institutes of Health, USA). The mean integrated optical density (IOD) of positive areas in the six views was regarded as the data of each section. A total of four sections from each animal including two sections containing the epicenter of the lesion plus rostral area and the other two containing the epicenter of the lesion plus caudal area were used for quantification. The six random high-power fields (400×) within each section were selected without overlap from white matter. The final average number of the four sections was regarded as the data for each sample. All the processes were conducted by two investigators blinded to the grouping.
Immunohistochemistry
Consecutive 4 µm-thick serial sections were cut and routinely deparaffinized. Endogenous peroxidase was blocked with 3% H2O2/methanol. Nonspecific antibody binding was blocked by incubating the sections in blocking buffer (10% normal goat serum in PBS) for 30 minutes. Primary antibodies rabbit anti-MBP (1: 50; Abcam) and rabbit anti-Plastin L (LPL; 1: 100; Abcam) were applied overnight at 4°C. After being washed three times in PBS for 5 minutes each, the sections were incubated with horseradish peroxidase-conjugated IgG (1:500; Santa Cruz Biotechnology, Inc., Dallas, TX, USA) for 60 minutes. 3,3-Diaminobenzidine (DAB)/H2O2 solution was used for coloration. Finally, cell nuclei were counterstained with hematoxylin.
Six random nonoverlapping high-power fields (400×) in each coronary section were chosen from white matter, and the mean IODs of the MBP/LPL-positive areas in the six views was regarded as the data of each section. A total of four sections from each animal used for quantification included two sections containing the epicenter of the lesion plus rostral area and the other ones containing the epicenter of the lesion plus caudal area. The final average number of the four sections was regarded as the data for each sample. All the processes were conducted using Image-Pro Plus software (Media Cybernetics, Rockville, MD, USA) by two investigators blinded to the grouping.
Double immunofluorescence staining
For double immunofluorescence, serial 5 µm coronal sections were obtained using a cryostat. Four sections from each animal were collected using the same way of immunohistochemistry. Based on the established immunostaining protocol, the slides were incubated in blocking buffer (10% normal goat serum in PBS containing 0.1% Triton X-100) for 2 hours followed by overnight incubation at 4°C in primary antibodies [rabbit anti-ED-1 (1:100; PL Laboratories Inc., Richmond, BC, Canada); mouse anti-MHC-II (1:100; Abcam)]. The next day, the slides were washed with PBS three times for 5 minutes and then incubated with appropriate secondary antibodies for 1 hour at room temperature. The slides were washed three times in PBS, counterstained with 4′,6-diamidino-2-phenylindole (DAPI; Beyotime Biotechnology Inc., Nantong, China) for 2 minutes, and rinsed with PBS. Coverslips were applied with mounting media. Fluorescence was imaged on an Olympus IX71 inverted microscope system and analyzed using Image-Pro Plus 6.0 software (Media Cybernetics). The specificity of the immunofluorescence reaction was evaluated by replacing the primary antibody with PBS. The mean number of the activated microglial cells (ED-1/MHC-II double-stained cells) in the six views were regarded as the data of each section. The six random high-power fields (400×) were chosen without overlap from white matter within each section. The final average number of the four sections was regarded as the data for each sample. All procedures were performed by two investigators who were blind to the experimental groups. Data were presented as the ratio of mean IODs of different SCI group to sham operation group.
Determination of iron and glutamate levels in the injured tissue
Iron and glutamate levels in the injured tissue were measured using the Iron Assay Kit (Sigma-Aldrich Co., St Louis, MO, USA) and Glutamate Assay Kit (Sigma-Aldrich Co.). The injured areas of spinal cord were collected and weighed. Then, the tissue was rapidly homogenized in Iron Assay Buffer or Glutamate Assay Buffer and centrifuged at 13,000× g for 10 minutes at 4°C. Next, the supernatant was collected and the following procedure was performed according to the manufacturer’s instructions. The blank and sample tubes were measured three times and the absorbance values at 593 nm or 450 nm were recorded for analysis. Iron and glutamate levels were expressed as micromoles per gram of protein.
Enzymatic method for determining ATP and potassium
ATP Assay Kit (Jiancheng, Nanjing, China) and Potassium Assay Kit (Jiancheng) were performed to quantify the glutamate and potassium concentration in the injured tissue. First, collected injured areas of spinal cord were weighed, added nine times volume of deionized water, and homogenized. Second, protein precipitator was mixed. The third step was centrifugation at 1,200 × g for 10 minutes. Finally, the supernatant was tested according to the manufacturers’ instructions. The absorbance values at 636 nm or 450 nm were recorded for further reckoning. ATP and potassium concentrations were expressed as micromoles or millimoles per gram of protein.
Enzyme-linked immunosorbent assay (ELISA)
The frozen cortex tissue was mechanically homogenized in 1 mL of lysate buffer and centrifuged at 12,000 × g for 20 minutes at 4°C. Then, the supernatant was collected and total protein was determined using an ELISA kit. The protein levels of pro-inflammatory cytokines, such as tumor necrosis factor-α (TNF-α), interleukin 1-β (IL-1β) and interleukin 6 (IL-6), were quantified using specific ELISA kits for rat cytokines according to the manufacturers’ instructions (TNF-α, IL-1β and IL-6 from LKCX Biotechnology, Beijing, China). Absorbance at 450 nm was measured on an enzyme-linked immunometric meter (BioTek Instruments Inc., Winooski, VT, USA). All samples, standards, and positive controls were run in duplicate so that all tissue could be run on a single plate, reducing a potential source of variability. Cytokine protein concentrations were calculated by the standard curve and expressed as nanograms per liter.
Statistical analysis
Statistical analysis was performed using SPSS Statistics, version 24.0 (IBM Corporation, Armonk, NY, USA). For the BBB score, we used one-way ANOVAs with Fisher’s LSD post-test and paired t-tests; for other assays, one-way ANOVAs with Fisher’s LSD post-test or Dunnett’s T3 test were used in data analysis. Data were presented as mean ± SEM, and differences were reported as statistically significant at P<0.05.
Results
Neurofunctional outcome
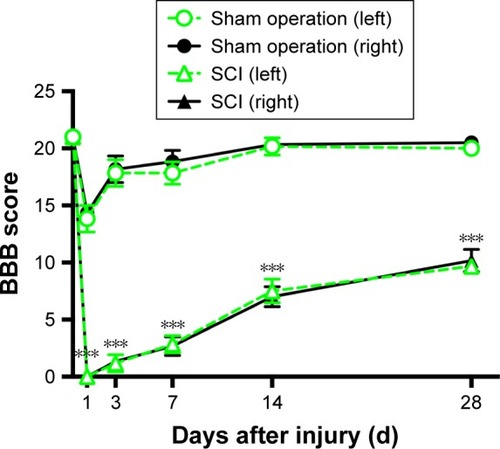
The motor function of all rats was normal (BBB Scale =21) pre-operative (). At 1 day after SCI, all animals in the SCI group were completely paraplegic, while rats in the sham operation group had a moderate level of BBB scores. In the following days, a slow recovery of hind limb locomotion, characterized by slight movement in one or two joints, was observed in both groups. After 28 days of recovery, rats in the sham operation group had returned to normal. However, the BBB scores of both sides were still lower in the SCI group than ones in the sham operation group at day 28 post-operative (P<0.001). Similarly, the BBB scores of both sides in other time points were significantly lower than the ones in the sham operation group (P<0.001).
Figure 2 Line chart of the BBB scores of rats in the SCI and sham operation groups.
Abbreviations: SCI, spinal cord injury; BBB, Basso, Beattie, and Bresnahan Locomotor Rating Scale.
Myelination of the spinal cord after SCI presented an anti-parabolic trend
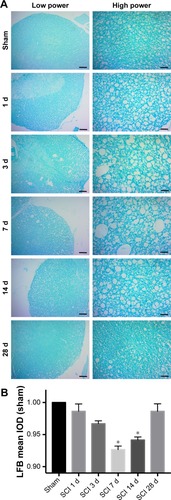
Representative images of LFB staining are shown in . Myelin vacuolation after SCI was obvious, and myelination of the spinal cord showed an anti-parabolic trend. In other words, it was progressively aggravated during the acute period, reached the trough at day 7 post injury (P<0.05), and then gradually recovered to close to the level of the sham operation group at day 28 post-operative.
Figure 3 Myelination of the spinal cord after SCI investigated through staining of LFB.
Abbreviations: d, days; SCI, spinal cord injury; LFB, Luxol fast blue.
Level of oligodendroglia was contra-parabola after SCI
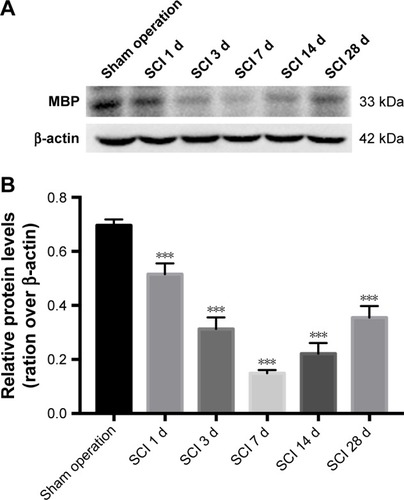
The level of MBP and LPL expression may reflect the degree of injury of oligodendrocytes after SCI. An equal contra-parabola trend after SCI was found in MBP and LPL stainings. As shown in and , the mean IODs of both MBP and LPL declined during the acute period, reached the lowest level at day 7 after SCI (P<0.001), and then gradually rose during 28 days post-operative. The protein expression of MBP protein in the six groups was detected using Western blotting analyses. As shown in , MBP declined firstly, reached the lowest level at day 7 after SCI (P<0.001), and gradually rose during 28 days post-operative (P<0.001).
Figure 4 Immunohistochemistry of MBP in the SCI and sham operation groups.
Abbreviations: d, days; MBP, Myelin basic protein; SCI, spinal cord injury; IOD, integrated optical density.
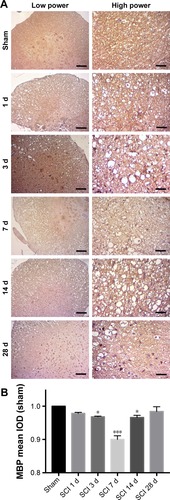
Figure 5 Immunohistochemistry of LPL in tissue from different time points after SCI and sham operation groups.
Abbreviations: d, days; LPL, rabbit anti-Plastin L; IOD, integrated optical density; SCI, spinal cord injury.
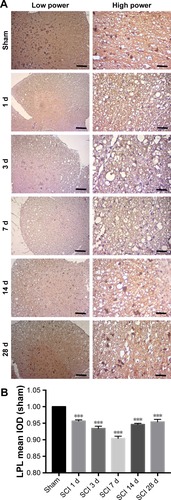
Figure 6 The protein expression of MBP was detected using Western blotting analyses.
Abbreviations: d, days; MBP, Myelin basic protein; SCI, spinal cord injury.
The microglial activation appeared a tendency of parabolic line after SCI
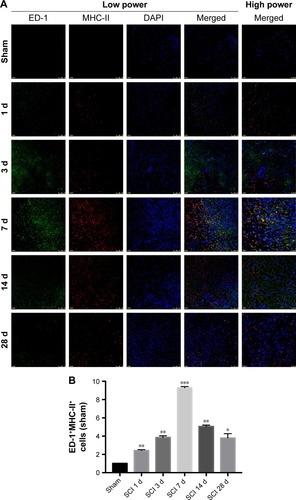
In rats, activated microglia that have reached the phagocytic stage express ED-1, a lysosomal antigen expressed in phagocytes, while microglia involved in immune-mediated responses upregulate MHC-II expression. Representative images of double immunofluorescence staining are shown in . A marked parabolic trend is shown in concerning the mean number of the activated microglial involved in immune-mediated responses. ED-1+MHC-II+ cells at day 7 after SCI were significantly more than ones of the sham operation group (P<0.001). The number of double positive cells decreased at 4 weeks after injury, but it was still higher than that of the sham operation group (P<0.05).
Figure 7 Double staining of ED-1 and MHC-II were used to investigate the microglial activation.
Abbreviations: d, days; DAPI, 4′,6-diamidino-2-phenylindole; SCI, spinal cord injury.
Iron and glutamate concentration were remarkably higher while ATP and potassium concentration were significantly lower at day 7 after SCI
After injury, damaged cells can be cracked or secreted to produce many factors such as potassium, ATP, iron, and glutamate. In the tissues around the injury site, the above factors were investigated. Interestingly, compared with the sham operation group, both iron and glutamate concentration began to rise significantly at 1 day (, P<0.01; and , P<0.001), peaked at 7 days (, P<0.01; and , P<0.001), and then declined until day 28 post-operative (, P<0.01; and , P<0.001).
Figure 8 Bar graphs of iron, glutamate, ATP and potassium concentrations in the tissues around the injury site were compared in the different groups.
Abbreviations: d, days; SCI, spinal cord injury.
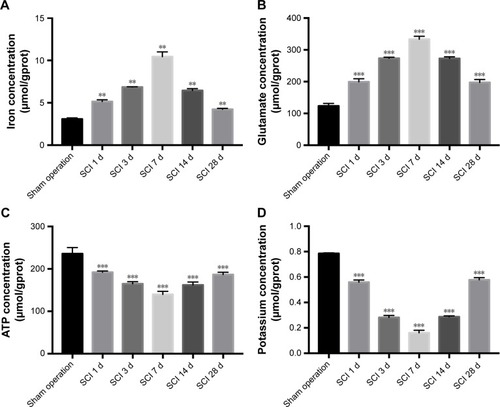
Conversely, both ATP and potassium concentrations began to decline significantly at 1 day (, P<0.001; and , P<0.001), reached a low valley at 7 days (, P<0.001; and , P<0.001), and then gradually recovered. But at day 28 post-operative, they still were below that of the sham operation group (, P<0.001; and , P<0.001).
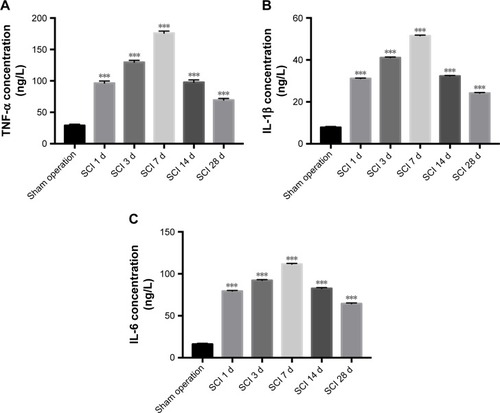
Inflammatory response was the most severe at day 7 after SCI
Activated microglia responding to SCI can produce pro-inflammatory cytokines such as TNF-α, IL-1β and IL-6. Levels of the above pro-inflammatory cytokines increased significantly at 1 day (, P<0.001), peaked at 7 days ( P<0.001), and gradually decreased. After 4 weeks, the three cytokine concentrations remained nearly 3-fold higher than the ones of the sham operation group (, P<0.001).
Figure 9 Bar graphs of the protein levels of pro-inflammatory cytokines, such as TNF-α, IL-1β, and IL-6, were compared in the SCI and sham operation groups.
Abbreviations: d, days; SCI, spinal cord injury.
Discussion
It is considered that SCI-inducing factors directly affect oligodendroglia cells and the myelin sheath, leading to primary injury of both, while microglia activation plays an important role in secondary injury after SCI.Citation5,Citation22 Secondary injury is the research emphasis owing to primary injury of non-intervention. Although the above factors have been studied for decades, the exact time-course profiles of micro-glial activation and the specific factors are varied and far from clear using different SCI models.Citation8,Citation23,Citation24 To clarify the microglial activation profile and associated factors, a rat compressive SCI model was employed in this study.
Currently recognized pathophysiology mechanisms following SCI mainly include oligodendroglial apoptosis along with degenerating axons in rats. A previous report demonstrated that many oligodendroglia apoptosis had been observed a day after SCI and lasted for more than 3 weeks, which eventually led to the occurrence of chronic demyelination.Citation8,Citation25 Severe chronic demyelination not only causes secondary injury of axons but also affects the morphology, structure and function of the normal myelin sheath characterized by “waterfall enlargement.”Citation26,Citation27 Studies in our laboratory and by Professor Totoiu in the USA have found clear chronic demyelinating changes in different animal SCI models.Citation27 Similarly, this study detected obvious myelin vacuolation and injury of oligodendrocytes after SCI. Furthermore, the level of myelination and oligodendroglia were contra-parabola after SCI. Damage was clear at day 1 post-operative, gradually deteriorated, peaked at day 7, and ameliorated gently thereafter. Those deteriorations of injury lasting for 7 days may lie in complex wound factors which accelerate the second course caused by malignant positive feedback mechanisms under the pathological conditions like acute pancreatitis.
Microglia are such key factors which may cause the 7-day deterioration of injury. Microglial cells are the resident tissue macrophages in the CNS and are on constant surveillance for perturbations resulting from injury.Citation28 However, different microglial activation profiles have been found in varied studies.Citation8,Citation11,Citation22 The results of glial cell quantification in the contusion rat SCI model showed a significant increase in glial cell density percentage at day 2 as compared to other days, and the highest increase in ED-1 immunoreactive cells was observed at day 2 (23.15%) post-injury.Citation8 Another study demonstrated that microglia had peaked at day 7 and then decreased at day 14 post-SCI to levels comparable to that observed at days 1 and 3 following spinal cord compression injury in the lys-egfp-ki mouse model.Citation14 Accurate time-course profiles of microglial activation have not been demonstrated hence. In our rat compressive SCI model, the activated microglia involved in immune-mediated responses increased dramatically after injury, reaching the peak at day 7, and then dropped subsequently. Our results are similar to those of previous results. Previous studies found that microglia had at least two different spatial and temporal patterns of activation after compressive SCI. One was rapid and most likely involved the blood-borne complement activating system. The other accompanied Wallerian degeneration and was independent of the blood-borne complement system. Varied activated patterns may lead to diverse microglial characters.
There is evidence that microglia contribute to secondary tissue damage in injury of the CNS.Citation29,Citation30 Activated microglia may demonstrate detrimental effects to impair the remaining oligodendroglia and myelin through the following ways.Citation3 First of all, they produce various pro-inflammatory cytokines, proteases, and other factors that are cytotoxic in the injured spinal cord.Citation31 IL-1, IL-6, and TNF are the most important pro-inflammatory cytokines and often act in conjunction.Citation17 In our test, the protein levels of TNF-α, IL-1β, and IL-6 peaked at 7 days which represented the most severe inflammatory response. Interestingly at this point, demyelination and microglial activation were also most serious within 4 weeks. This phenomenon indirectly reflected the increased inflammatory response after micro-glia activation post SCI. Similar findings demonstrated that microglia activation had resulted in inflammatory response in rats following SCI, and Dl-3-n-butylphthalide may have neuroprotective and anti-inflammatory properties in the treatment of SCI by inhibiting the activation of microglia via TLR4/NF-kappaB signaling.Citation20 Next, astrocytes were activated to further enhance the inflammation response.Citation32,Citation33 The finding showed after SCI, reactive astrocytes had undergone M1 microglia-induced necroptosis, partially through TLR/MyD88 signaling, and suggested that inhibiting astrocytic necroptosis may be beneficial for preventing secondary SCI.Citation33 The third one was to produce large amounts of hydrogen peroxide and superoxide anion for the generation of oxidative stress.Citation34,Citation35 The reduced activation of microglia after 7 days post injury also implied lessened injury of oligodendrocytes, demyelination and inflammatory response. After 4 weeks, approximate epistrophy of oligodendrocytes and myelination did not have matching neurofunctional outcomes and inflammatory responses. The still poor hind limb locomotion may be due to irreversible damage of neurons and regenerated myelin with incomplete function. We also speculate that probably the inflammatory response can be induced by other elements other than activation of microglia. Recent findings indicated that microglia may sculpt the structure of the CNS, refine neuronal circuitry and network connectivity, and contribute to plasticity rather than their detrimental effects.Citation12,Citation36 They function to maintain normal homeostasis and deal with issues of cell death in a manner that minimizes neuro-inflammation under different environments.Citation3,Citation37 In our SCI model, activated microglia may play a proinflammatory response primarily.
The activation of microglial has been shown to be influenced by many factors after injury. Except for injury, damaged or mutant oligodendroglia are likely to be another reason for the activation of microglial in our experimental SCI model. Zhang et al’s research suggested that as an internal environment detector, microglial cells did not express MHC-II at first and they had not been truly activated until many abnormal vesicles were generated in the remaining oligodendroglia.Citation11 More direct evidence comes from a review published on Journal of Neuroscience: extracellular high concentration of glutamate can produce excitotoxic cytotoxicity to oligodendroglia and the myelin sheath. At certain concentrations, glutamate can induce microglial to activate, releasing TNF-α and IL-1, and express metabotropic glutamate receptors (mGluR1-8) and ionotropic glutamate receptors (NMDA, AMPA, etc.).Citation16 In addition to microglial cells, the axon and the remaining oligodendroglia were also the main source of glutamate. Interestingly in our study, iron and glutamate content reached the peak at day 7 after SCI, the most significant time point for the activation of micro-glial. SCI may cause intracranial iron overload through the NOS–iron-responsive element/IRP pathway, resulting in central pain mediated by the oxidative stress response.Citation38 Other findings showed that high intracellular iron accumulation in macrophages had induced TNF expression.Citation17 Thus, iron accumulation after SCI may also contribute to the activation of microglial. However, both ATP and potassium reached a low valley at 7 days post-operative. Release of ATP induced the outgrowth of microglial processes to the site of injury. Both transmitter systems, NO and ATP, were active on spinal microglia. When ambient ATP decreased in the extracellular environment, local NO application elicited less process attractions which attenuated the activation of microglia finally.Citation18 Growing evidences indicate that the voltage-gated potassium channels have participated in neuronal damage and microglia function.Citation19 Potassium channels facilitate the refilling of intracellular Ca2+ stores following ATP or UTP activation of metabotropic P2Y-receptors, thus maintaining high Ca2+ and timing of intracellular signaling events important for microglia activation and proliferation.Citation39 Hence, we conclude that reduced potassium in the tissues around injury site is also vital for the activation of microglia after SCI. Our experiment demonstrated an increment in iron and glutamate content while a decrement in ATP and potassium post SCI. Based on the above clues and our results, such increments of glutamate and iron in particular time could potentially lead to consistent microglia activation.
Conclusion
Although the microglia roles after SCI have been studied for decades, the exact effect, time-course profile and factors are far from clear, resulting in a lack of targeted treatment and poor quality of life. Microglia activation plays an important role in second injuries post SCI. Our results showed a tendency of parabolic line in microglia activation after SCI, in which the seventh day was the peak with the most severe injury to oligodendroglia cells and the myelin sheath. Meanwhile, high iron and glutamate concentration may be released by damaged oligodendroglia and contribute to the activation of microglial after our experimental SCI model in rats. Therefore, a more in-depth study exploring an objective and feasible treatment method aimed at microglia and associated factors may possibly improve long-term neurological function of SCI and have greater medical benefits.
Acknowledgments
This work was funded by grants from the National Natural Science Foundation of China (no 81371356), the Youth Training Project (no 16QNP042), and the Jinling Hospital of Nanjing (no 2016017).
Disclosure
The authors report no conflicts of interest in this work.
References
- NingGZWuQLiYLFengSQEpidemiology of traumatic spinal cord injury in Asia: a systematic reviewJ Spinal Cord Med201235422923922925749
- LeeBBCrippsRAFitzharrisMWingPCThe global map for traumatic spinal cord injury epidemiology: update 2011, global incidence rateSpinal Cord201452211011623439068
- AlizadehAKarimi-AbdolrezaeeSMicroenvironmental regulation of oligodendrocyte replacement and remyelination in spinal cord injuryJ Physiol2016594133539355226857216
- HuHZGrangerNJefferyNDPathophysiology, clinical importance, and management of neurogenic lower urinary tract dysfunction caused by suprasacral spinal cord injuryJ Vet Intern Med20163051575158827527382
- HaytaEEldenHAcute spinal cord injury: A review of pathophysiology and potential of non-steroidal anti-inflammatory drugs for pharmacological interventionJ Chem Neuroanat201887253128803968
- EldahanKCRabchevskyAGAutonomic dysreflexia after spinal cord injury: Systemic pathophysiology and methods of managementAuton Neurosci2018209597028506502
- MaLYuHJGanSWp53-Mediated oligodendrocyte apoptosis initiates demyelination after compressed spinal cord injury by enhancing ER-mitochondria interaction and E2F1 expressionNeurosci Lett2017644556128237798
- AbdanipourATiraihiTTaheriTKazemiHMicroglial activation in rat experimental spinal cord injury modelIran Biomed J201317421422023999718
- WangWHuangXLiJMethane suppresses microglial activation related to oxidative, inflammatory, and apoptotic injury during spinal cord injury in ratsOxid Med Cell Longev Epub 201762017
- von LedenREKhayrullinaGMoritzKEByrnesKRAge exacerbates microglial activation, oxidative stress, inflammatory and NOX2 gene expression, and delays functional recovery in a middle-aged rodent model of spinal cord injuryJ Neuroinflammation201714116128821269
- ZhangSCGoetzBDCarréJLDuncanIDReactive microglia in dysmyelination and demyelinationGlia200134210110911307159
- DavidSKronerARepertoire of microglial and macrophage responses after spinal cord injuryNat Rev Neurosci201112738839921673720
- MagakiSDWilliamsCKVintersHVGlial function (and dysfunction) in the normal and ischemic brainNeuropharmacology2018134Pt B21822529122627
- ThawerSGMawhinneyLChadwickKTemporal changes in monocyte and macrophage subsets and microglial macrophages following spinal cord injury in the Lys-Egfp-ki mouse modelJ Neuroimmunol20132611–272023711349
- TatedaSKannoHOzawaHRapamycin suppresses microglial activation and reduces the development of neuropathic pain after spinal cord injuryJ Orthop Res20173519310327279283
- FernRMöllerTRapid ischemic cell death in immature oligodendrocytes: a fatal glutamate release feedback loopJ Neurosci2000201344210627578
- KronerAGreenhalghADZarrukJGPassos dos SantosRGaestelMDavidSTNF and increased intracellular iron alter macrophage polarization to a detrimental M1 phenotype in the injured spinal cordNeuron20148351098111625132469
- DibajPNadrignyFSteffensHNO mediates microglial response to acute spinal cord injury under ATP control in vivoGlia20105891133114420468054
- WendtSMaricosMVanaNChanges in phagocytosis and potassium channel activity in microglia of 5×FAD mice indicate alterations in purinergic signaling in a mouse model of Alzheimer’s diseaseNeurobiol Aging201758415328697378
- HeZZhouYLinLDl-3-n-butylphthalide attenuates acute inflammatory activation in rats with spinal cord injury by inhibiting microglial TLR4/NF-κB signallingJ Cell Mol Med201721113010302228842949
- SmithPDBellMTPuskasFPreservation of motor function after spinal cord ischemia and reperfusion injury through microglial inhibitionAnn Thorac Surg20139551647165323541432
- WeiZYuDBiYCaoYA disintegrin and metalloprotease 17 promotes microglial cell survival via epidermal growth factor receptor signalling following spinal cord injuryMol Med Rep2015121637025738567
- SchwabJMFreiEKlusmanISchnellLSchwabMESchluesenerHJAIF-1 expression defines a proliferating and alert microglial/macrophage phenotype following spinal cord injury in ratsJ Neuroimmunol2001119221422211585624
- AlluinODelivet-MongrainHGauthierMKFehlingsMGRossignolSKarimi-AbdolrezaeeSExamination of the combined effects of chondroitinase ABC, growth factors and locomotor training following compressive spinal cord injury on neuroanatomical plasticity and kinematicsPLoS One2014910e11107225350665
- Redondo-CastroEHernándezJMahyNNavarroXPhagocytic microglial phenotype induced by glibenclamide improves functional recovery but worsens hyperalgesia after spinal cord injury in adult ratsEur J Neurosci201338123786379824112298
- SilverJSchwabMEPopovichPGCentral nervous system regenerative failure: role of oligodendrocytes, astrocytes, and microgliaCold Spring Harb Perspect Biol201473a02060225475091
- TotoiuMOKeirsteadHSSpinal cord injury is accompanied by chronic progressive demyelinationJ Comp Neurol2005486437338315846782
- BermudezSKhayrullinaGZhaoYByrnesKRNADPH oxidase isoform expression is temporally regulated and may contribute to microglial/macrophage polarization after spinal cord injuryMol Cell Neurosci201677536427729244
- EmmetsbergerJTsirkaSEMicroglial inhibitory factor (MIF/TKP) mitigates secondary damage following spinal cord injuryNeurobiol Dis201247329530922613732
- QuWSTianDSGuoZBInhibition of EGFR/MAPK signaling reduces microglial inflammatory response and the associated secondary damage in rats after spinal cord injuryJ Neuroinflammation2012917822824323
- JungGYLeeJYRhimHOhTHYuneTYAn increase in voltage-gated sodium channel current elicits microglial activation followed inflammatory responses in vitro and in vivo after spinal cord injuryGlia201361111807182124038428
- GoldshmitYKannerSZacsMRapamycin increases neuronal survival, reduces inflammation and astrocyte proliferation after spinal cord injuryMol Cell Neurosci201568829125936601
- FanHZhangKShanLReactive astrocytes undergo M1 microglia/macrophages-induced necroptosis in spinal cord injuryMol Neurodegener2016111426842216
- Santos-NogueiraELópez-SerranoCHernándezJActivation of lysophosphatidic acid Receptor Type 1 contributes to pathophysiology of spinal cord injuryJ Neurosci20153528102241023526180199
- WangSZhangTYangZHeme oxygenase-1 protects spinal cord neurons from hydrogen peroxide-induced apoptosis via suppression of Cdc42/MLK3/MKK7/JNK3 signalingApoptosis201722344946227864650
- LoaneDJKumarAMicroglia in the TBI brain: the good, the bad, and the dysregulatedExp Neurol2016275Pt 331632726342753
- SalterMWBeggsSSublime microglia: expanding roles for the guardians of the CNSCell20141581152424995975
- MengFXHouJMSunTSEffect of oxidative stress induced by intracranial iron overload on central pain after spinal cord injuryJ Orthop Surg Res20171212428178997
- NguyenHMBlomsterLVChristophersenPWulffHPotassium channel expression and function in microglia: plasticity and possible species variationsChannels201711430531528277939