Abstract
We reviewed 143 papers that described the relationship between moderate drinking of alcohol and some aspect of cognition. Two types of papers were found: (1) those that provided ratios of risk between drinkers and nondrinkers (74 papers in total) and (2) those that, although they did not provide such ratios, allowed cognition in drinkers to be rated as “better,” “no different,” or “worse” than cognition in nondrinkers (69 papers in total). The history of research on moderate drinking and cognition can be divided into two eras: 1977–1997 and 1998–present. Phase I (1977–1997) was the era of neuropsychological evaluation involving mostly young to middle-aged (18–50 years old) subjects. Although initial studies indicated moderate drinking impaired cognition, many later studies failed to confirm this, instead finding no difference in cognition between drinkers and nondrinkers. Phase II (1998–present) was and is the era of mental status exam evaluation involving mostly older (≥55 years old) subjects. These studies overwhelmingly found that moderate drinking either reduced or had no effect on the risk of dementia or cognitive impairment. When all the ratios of risk from all the studies in phase II providing such ratios are entered into a comprehensive meta-analysis, the average ratio of risk for cognitive risk (dementia or cognitive impairment/decline) associated with moderate “social” (not alcoholic) drinking of alcohol is 0.77, with nondrinkers as the reference group. The benefit of moderate drinking applied to all forms of dementia (dementia unspecified, Alzheimer’s disease, and vascular dementia) and to cognitive impairment (low test scores), but no significant benefit against cognitive decline (rate of decline in test scores) was found. Both light and moderate drinking provided a similar benefit, but heavy drinking was associated with nonsignificantly higher cognitive risk for dementia and cognitive impairment. Although the meta-analysis also indicated that wine was better than beer or spirits, this was based on a relatively small number of studies because most studies did not distinguish among these different types of alcohol. Furthermore, a number of the studies that did make the distinction reported no difference among the effects of these different types of alcohol. Therefore, at present this question remains unanswered. Analysis also showed that the presence of the apolipoprotein E epsilon 4 allele eliminated the benefit of moderate drinking. However, this was based on a relatively small number of studies and several other studies have found a beneficial effect of the epsilon e4 allele. Further studies are necessary to settle this question. The benefit of moderate alcohol for cognition was seen in both men and women, although the amount and pattern of drinking is very different between the two sexes. Lastly, the finding of unaffected or significantly reduced cognitive risk in light to moderate drinkers was seen in 14/19 countries for which country-specific ratio data were available, with three of the five remaining countries showing nonsignificant reductions as well. Overall, light to moderate drinking does not appear to impair cognition in younger subjects and actually seems to reduce the risk of dementia and cognitive decline in older subjects.
Keywords:
Introduction
What is the effect of moderate “social” (not alcoholic) drinking of alcohol on cognition? Does it impair cognition? Does it have no effect on cognition? Or does it enhance or preserve cognition? We have reviewed and analyzed results from studies from the late 1970s through June of 2011, comparing cognitive risk (including dementia, cognitive impairment, and cognitive decline) in moderate social drinkers (not alcoholics) with cognitive risk in nondrinkers.
Our interest in this topic arose from our finding that 6 days of moderate alcohol exposure protects rat organotypic hippocampal-entorhinal cortex brain slice cultures from the toxicity of amyloid-β,Citation1 the protein that has been strongly implicated in the pathogenesis of Alzheimer’s disease (AD).Citation2 WeCitation3–Citation6 and othersCitation7,Citation8 have hypothesized a mechanism in which alcohol “protects” by its “preconditioning” effect on neurons and glia, which involves upregulation of heat shock proteins and other cellular pro-survival mechanisms such as N-methyl-D-aspartate receptors, protein kinase C epsilon, and focal adhesion kinase. This line of research naturally led us to inquire whether there was any evidence that drinking alcohol may “protect” from AD and other forms of dementia or cognitive impairment. There was a large scientific literature addressing this questionCitation9–Citation17 and our attempt to understand this literature led us to write this review.
Methods
Search strategies
The collection of studies reviewed here was assembled primarily by manual search using the bibliographies of each paper and was supplemented by literature searches using the PubMed database. Search terms used for database searches included alcohol or ethanol, dementia, AD, cognition, mild cognitive impairment (MCI), cognitive decline, and memory, all in various combinations. In addition, these terms were also combined with the names of more than 250 countries around the world. This strategy yielded studies providing ratios of risk from 19 countries (Australia, Brazil, Canada, China and Taiwan, Denmark, Finland, France, Germany, Greece, Hungary, Italy, Japan, Korea, the Netherlands, Nigeria, Spain, Sweden, the UK, and the US). Two additional countries (Ireland and Norway) were added to this list from “non-ratio” studies. (The total number increased by eleven if countries included in the Syst-Eur studyCitation18 were added [Belgium, Bulgaria, the Czech Republic, Estonia, Israel, Lithuania, Poland, Portugal, Romania, the Russian Federation, and Slovakia], but in this study it was not possible to associate any particular country with its results.)
Unfortunately, studies in languages other than English were not reviewed. In addition, there is no doubt that the search missed some studies for a variety of reasons, and we apologize for these omissions.
Two types of studies
Two types of studies are distinguished in this review: (1) those providing ratios of risk, such as odds ratios (ORs), risk ratios (RRs), or hazard ratios (HRs) (collectively termed “XRs”); and (2) those that, instead of providing such ratios, could be interpreted in terms of whether some aspect of cognition was “worse,” “no different,” or “better” in moderate drinkers than in nondrinkers. Historically, the studies without ratios preceded those with ratios, and so that is the order of presentation.
Studies without ratios of risk
There were 69 studies without ratios of risk that could have results grouped into categories of (1) worse, (2) no different, and (3) better cognition in drinkers than in nondrinkers, or in heavy drinkers than in light drinkers. The data in these three categories were plotted as cumulative sum histograms of the numbers of studies accumulating each year from 1975 to 2011. (A cumulative sum is a sequence of partial sums of a given sequence; for example, the cumulative sums of the sequence 1,2,1 are 1,3,4.) These histogram plots provide valuable information on the history of the field, including when studies in each category occurred and for how long and at what rate they continued to accumulate in each category. Data concerning the type of cognitive testing employed and the age of the subjects in the studies are also plotted.
Studies with ratios of risk
There were 74 studies that provided various ratios of risk, including ORs, RRs, or HRs. Such numbers allowed for relatively direct comparisons among studies and were used for meta-analysis. The XRs were pooled and plotted together in forest plots because such ratios are roughly equivalent when describing events such as AD or MCI that are relatively rare or uncommon.Citation19–Citation22
The present review does not follow what has become the conventional method for meta-analysis in which only a subset of studies that meet certain criteria for quality are selected for analysis from a larger set of studies collected in a field.Citation23–Citation25 Instead, and perhaps closer to the original concept of meta-analysis, which called for liberal inclusion criteria that incorporate “all studies, good bad and indifferent”Citation26 and for considering the unit of analysis to be all the findings from each study and not just one summary value for each study,Citation26 we chose to “uncritically” collect data from as many studies as possible and thus present the “big picture,” both for its own value and as a complement and a context for more restricted or selective meta-analyses. Therefore, if a study reported 1 OR or 50, all were included in the analysis. The second reason is that several meta-analyses of the effects of moderate drinking on cognition that employed the conventional, more restricted sample method have recently been published.Citation11,Citation12
The normal meta-analysis method of presenting a forest plot and calculating an overall ratio with its 95% confidence intervals (CIs) was followed. Since such an “uncritical” meta-analysis includes the effects of moderate drinking on a broad spectrum of cognitive function – including dementia, cognitive impairment, and cognitive decline – and different methods of measuring cognition, the presence of significant “heterogeneity” or inconsistency among studiesCitation27–Citation29 was determined. This was achieved by calculating the P-value (Qp) of the Q statistic (the weighted sum of squared differences between individual study effects and the pooled effect across studies) and the percentage of variability due to heterogeneity rather than chance (I2); these two numbers are reported in the forest plot figures and commented on in the text. The results of a random-effects model are always reported in the forest plots on the left-hand side of the figures. On the right-hand side of the figures are found plots of the “approximately normal”Citation30 distributions of the logs of the ratios (log[XR] values), along with the results of a fixed-effects model. In addition, small inset quantile–quantile (Q–Q) plots of the log(XR) values are presented to better display any deviations from normality; small inset funnel plots are also presented, to aid detection of “publication bias.”Citation31,Citation32 The tops of the funnel plots are labeled with the P-values of two tests for funnel plot asymmetry, the regression testCitation31 on the left and the rank correlation testCitation33 on the right.
The open-source R statistical programCitation34 and its metafor package, which can be obtained from http://www.r-project.org and http://www.metafor-project.org, respectively, were used to carry out the statistical meta-analysis and generate the plots.
Results
Does moderate drinking affect cognitive risk?
Before answering this question, because the methods of measuring cognition and the ages of the subjects studied have changed in important ways since 1977, it is important to describe the history of research in this field. This history begins with studies without ratios of risk, since the early work did not provide such ratios.
Cognition in studies without ratios of risk
and summarize the results from these 69 studies, which included a total of 111,909 subjects (56,934 women and 54,906 men) and provided a total of 87 judgments of whether cognition was worse, no different, or better in drinkers than in nondrinkers or in heavy drinkers than in light drinkers (there are more judgments than studies because some studies reported results for men and women separately). Of these 69 studies, 46 were from the US, 13 from Europe (Denmark; Finland; France; the Netherlands; Ireland, Scotland, Norway; Sweden; and the UK), seven from Australia, two from Asia (China and Japan), and one from Canada. As seen in , the 1977 study by Parker and NobleCitation35 is considered the beginning of investigation of alcohol’s effect on cognition in social drinkers. It reported worse cognition in social drinkers that was related to the quantity of alcohol consumed per occasion; this study is labeled along the x-axis as the first element on the “Worse” histogram (heavy, solid gray line). These authors concluded that their results supported the “continuity hypothesis” of RybackCitation36 that proposed, as summarized by Parsons and Nixon, that “there is a continuum of alcohol effects on the brain, ranging from the profound memory and abstracting impairment found in patients with Korsakoff ’s disease, through the moderate cognitive impairments found in non-Korsakoff alcoholics, to mild cognitive impairments that might be present in heavy to moderate social drinkers.”Citation37 However, within a few years studies reporting no difference (“NoDiff ” histogram; left, heavy black line) in cognition between drinkers and non-drinkers began to appear, and such studies have continued to accumulate up to the present (43 studies in total), while the “Worse” histogram plateaued and eventually stopped accumulating in 2003 (only 14 studies in total). In 1998 a third histogram (right, heavy black line) of studies reporting “Better” cognition in moderate drinkers began accumulating more rapidly (one study reporting “better” was seen earlier, in 1987), and this has continued up to the present (30 studies in total).
Figure 1 Cumulative sum histograms (heavy lines) of numbers of studies that did not report various ratios or risk but instead reported “Worse” (heavy solid gray line), “NoDiff” (left, heavy solid black line), or “Better” (right, heavy solid black line) cognition in “social” drinkers (not alcoholics) versus nondrinkers from 1975 to 2011. Thin dotted line at the lower right plots the cumulative sum histogram for studies that reported better cognition and used a MSE to evaluate cognition (b+mse). Thin dashed line plots the cumulative sum histogram for studies of subjects who were ≥55 years of age (gte55). Dashed vertical line at 1998 separates two phases of research on this question (phase I: neuropsychology; phase II: mental status). Inset table shows the breakdown by country of studies reporting worse, no different, or better cognition in drinkers.
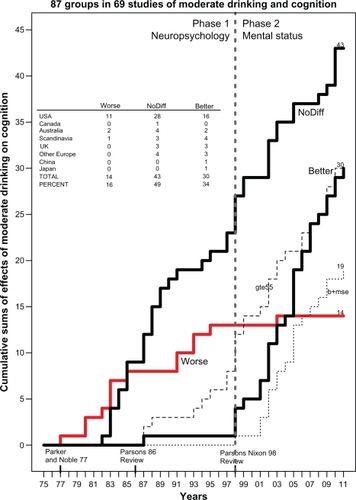
Table 1 Cognitive performance in drinkers in “non-ratio” studies, 1977–1986, 1986–1996, and 1997–present
Why did these studies finding “better” cognition in drinkers start appearing so late? There appear to be two reasons for the late appearance of better cognition in drinkers. First, more than 60% (18/29) of these “better” studies used some type of mental status exam (thin dotted line labeled b+mse in ), such as the Mini-Mental State Examination (MMSE), the Telephone Interview for Cognitive Status™ (TICS™), the TELE telephone interview, the Modified Mini-Mental State (3MS) examination, or the Cognitive Abilities Screening Instrument. Only one study employed a mental status exam before 1998; therefore, the history of studies of alcohol and cognition in social drinkers (not alcoholics) can be divided into two phases, with phase II (1998–2011) being the “mental status” era, as labeled in . Phase II is also characterized by more studies of older subjects (≥55 years old, thin dashed line labeled gte55 in ) than in phase I.
During phase I (1977–1997), in contrast, the studies measured various aspects of cognition primarily by a wide variety of neuropsychological tests, such as the Shipley Institute of Living Scale, the Wechsler Adult Intelligence Scale, the Wisconsin Card Sorting Test, various components of the Halstead–Reitan Neuropsychological Test Battery such as the Trail Making Test or the Category Test, the Stroop Color-Word Test, and others. For this reason, phase I is labeled as “Neuropsychology” in . The results of phase I studies of the relationship between social drinking and cognition were summarized in two reviews authored by Parsons, one in 1986Citation38 and the other, authored with Nixon, in 1998.Citation37 The earlier review concluded that “there are no stable or reproducible specific relationships” between drinking and performance on certain cognitive-perceptual tests and that “the results of studies to date are inconclusive.”Citation38 The later review concluded that “heavy social drinkers had significantly worse performance on one or more cognitive tests than the light drinkers,” supporting the alcohol-causal-threshold hypothesis that “persons drinking five or six US standard drinks per day over extended time periods manifest some cognitive inefficiencies.” Therefore, light to moderate drinking was not consistently associated with any cognitive deficits, although the evidence continued to be “fragmentary and in need of replication.”Citation37 This conclusion is further supported by the reanalysis by Parker et alCitation39 of their earlier study.Citation40 The reanalysis found that the cognitive deficits they had reported earlier were due to the effects of heavy drinkers (almost daily consumption of four drinks), since in lighter drinkers (two drinks/occasion, 1.6 times/week) “neither the quantity of alcohol consumed per occasion nor the frequency of consumption significantly predicted abstraction performance.”Citation39
lists the various studies that were included in . The first and second sections of the table list studies during phase I, as discussed. The third section of covers the period from 1997 to the present. Note that only 1/52 (2%) studies during this period found that social drinkers were cognitively worse than nondrinkers. In that study, of 230 male and female elderly African-Americans, Schinka et alCitation41 reported that “medium intensity” (30–60 drinks/month) moderate drinkers (n = 25) had poorer general cognitive performance (3MS, Hopkins Verbal Learning Test, and Stroop test) than both nondrinkers (n = 116) and “high intensity” (>119 drinks/month) heavy drinkers (n = 18). However, the same study’s hierarchical multiple regression analysis found drinking significantly “explained” variance in general cognition (2.4%), memory (4.8%), and executive function (4.9%), and the overall influence was beneficial or “facilitatory” – ie, drinking improved scores. Therefore, although listed in in the “Worse” column, this study could also have been listed under “Better.” Furthermore, Schinka et alCitation41 point out their study is inconsistent with their own work using identical methods to study an elderly, mostly white sampleCitation42 in which no significant effects of drinking or drinking intensity on cognition were seen. Shifting to the other categories, in 20/52 (38%) of the studies no difference was seen between drinkers and nondrinkers, and, in contrast to earlier research, better cognitive performance was seen in 28/52 (54%) of the studies. Many of these studies reporting better cognition in drinkers used mental status exams to evaluate cognition and also studied older (≥55 years old) subjects.
In summary, when “no ratio” studies are reviewed, it appears that, when evaluated by standard psychological tests in younger subjects (<55 years old), heavy drinking (4–6 drinks/day) is associated with cognitive impairment (the alcohol-causal-threshold hypothesis). However, there is no significant difference in cognition between light to moderate drinkers and nondrinkers. Interestingly, when various mental status exams are used to assess cognition, it appears that drinkers have a reduced risk of dementia or cognitive impairment compared with nondrinkers.
Cognition in studies with ratios of risk
As seen in the forest plot in and in , the 74 studies with ratios provided 446 ratios of risk (XRs) and included 253,791 subjects, including 173,970 women and 122,033 men. For 68 studies (92%), the subjects were aged ≥55 years, while for 52 studies (70%) the subjects were aged ≥65 years. About 87% of the ratios (388/446) were derived from studies that employed mental status exams as all or part of the measure of cognition. Eighty percent of these studies took place since 1998 and therefore can be considered part of the phase II mental status era. Of these 74 studies, 30 were from the US, 25 from Europe (Denmark, Finland, France, Germany, Greece, the Netherlands, Hungary, Italy, Spain, Sweden, and the UK), eight from Asia (China, Japan, Korea, and Taiwan), three from Australia, five from Canada, two from Africa (Nigeria), and one from South America (Brazil).
Figure 2 (A) Forest plot of all 446 XRs (white dots) plus or minus their 95% CIs (horizontal “whiskers”) from 74 studies providing ratios; ratios are listed in order from smallest to largest. XRwm is the weighted (wt = 1/SEM2) mean of all 446 ratios from a random-effects meta-analysis model with 95% CI in parentheses. Mean value ±95% CI is to the left of and significantly less than the thick solid vertical line at 1.00 that denotes no difference; this value indicated on the plot’s x axis with ±95% CI (vertical dashed lines). (B) Histogram of the probability density of the log(XR) values with a superimposed smooth probability density curve (solid line) and a superimposed normal distribution density curve (dashed line) calculated using the mean and variance of log(XR). XRm is the simple (not weighted) antilog of the mean of all log(XR) values with the 95% CI in parentheses; this value indicated on the plot’s x axis with ±95% CI (vertical dashed lines). Small inset graph on left is a normal Q–Q plot showing normality and departures from normality of the log(XR) distribution. Small inset graph on right is funnel plot with P-values for regression (left) and rank correlation (right) tests for asymmetry across top. Note that XRm is identical to XRwm.
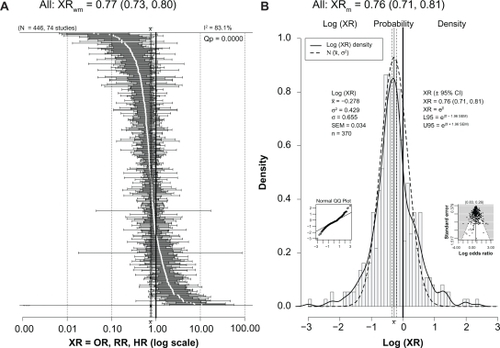
Table 2 The 74 studies providing ratios of risk listed by decade
As seen in , the overall weighted mean value (XRwm) from a random-effects meta-analysis was 0.77, and the 95% CI was relatively narrow (0.73–0.80), showing a significantly reduced risk for dementia, cognitive impairment, or cognitive decline in the drinkers. Significant heterogeneity was present (I2 = 83.1%; Qp = 0.0000). Since it is the log(XR) values that have an approximately normal distribution,Citation30 shows a histogram and smoothed (solid line) plot of all log(XR) values. Although both low and high ends of log(XR) distribution diverge slightly from normal compared with a pure normal distribution created with the same mean and variance (dashed line), the plot illustrates nonetheless that the log(XR) distribution is close to normal, with a mean of −0.278. This normality is also seen in the small inset normal Q–Q plot at the lower left of the figure. The funnel plot at the lower right was relatively symmetric and did not indicate publication bias. Taking the antilog of the mean gives an XRm of 0.76 (almost identical to that seen for the weighted average random-effects analysis) with a relatively narrow 95% CI (0.71–0.81), showing a significant reduction in cognitive risk in drinkers. The basic normality of the log(XR) distribution is consistent with it being close to the actual population distribution; therefore, it shows a real and beneficial effect of light to moderate drinking that reduces the risk of dementia, cognitive impairment, and cognitive decline in older adults by 20%–25%.
Does it make any difference if the reference group of nondrinkers includes former drinkers, who might be considered “sick quitters”?
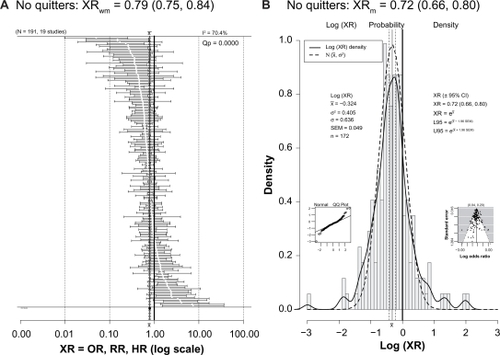
One criticism of studies reporting lower risk or better outcome in light to moderate drinkers is that the reference group of nondrinkers or nondrinkers includes former drinkers who might be considered “sick quitters”; this may bias the results by making the reference group “sicker” than it really is and, by comparison, make drinkers appear better off than they really are.Citation179–Citation183 However, shows that 19 studies with 191 ratios excluded former drinkers from the reference group and still found a protective effect of drinking (XRwm = 0.79 [95% CI: 0.75–0.84]; XRm = 0.72 [95% CI: 0.66–0.80]).
Figure 3 (A) Forest plot of 191 XRs (white dots) plus or minus their 95% CIs (horizontal “whiskers”) from 19 studies providing ratios with a reference group that did not include former drinkers. (B) Histogram of the probability density of the log(XR) values with a superimposed smooth probability density curve (solid line) and a superimposed normal distribution density curve (dashed line) calculated using the mean and variance of log(XR).
Notes: The XRwm in is close to that seen in . Other conventions are as for .
For example, Hendrie et alCitation120 used lifetime nondrinkers as the reference group, thereby avoiding former drinkers. Zuccala et alCitation123 attempted to compensate for the presence of sick quitters in the reference group of nondrinkers by adjusting for a comorbidity covariate. Ruitenberg et alCitation129 reported that the HR for dementia in light to moderate drinkers when subjects with changed drinking patterns were excluded was 0.57 (95% CI: 0.36–0.89), which is virtually the same as the HR of 0.58 (95% CI: 0.38–0.90) when they were not excluded. Mukamal et alCitation137 did not include either former drinkers or quitters in his reference group of nondrinkers, noting that “former drinkers and quitters had approximately 20% to 60% higher odds of dementia than long-term nondrinkers.” Anttila et alCitation139 found an OR of 0.48 (95% CI: 0.24–0.95) for cognitive impairment in infrequent drinkers when compared with a reference group of “never” drinkers that did not include former drinkers. The ORs for poor cognitive performance from the study of Britton et alCitation140 used a reference group of those who reported drinking within the past year but not in the past week, thereby avoiding questions associated with comparisons between former drinkers and nondrinkers. Similarly, when Ganguli et alCitation144 compared the minimal drinking group with life-long nondrinkers (excluding quitters), the lower odds of decline on the MMSE of 0.05 (95% CI: 0.01–0.26) remained significant; this also was seen for the ratio for the moderate drinking group for decline on the MMSE of 0.27 (95% CI: 0.09–0.84). Stampfer et alCitation147 excluded former drinkers or drinkers whose consumption greatly declined from the reference group of nondrinkers. Wright et alCitation153 distinguished past drinkers from “never drinkers” and only included the latter in their reference group; likewise, Yip et alCitation154 used never drinkers as the reference category. The HRs from Solfrizzi et alCitation156 showing a lower hazard of progression from MCI to dementia in light drinkers of alcohol of 0.15 (95% CI: 0.03–0.78) and light drinkers of wine of 0.15 (95% CI: 0.03–0.77) used a nondrinkers reference group from which former drinkers were excluded. Wadley et alCitation158 used life-long nondrinkers as the reference group. The reduced HR for dementia of 0.56 (95% CI: 0.38–0.82) in female wine drinkers seen in the study by Mehlig et alCitation160 was maintained when former drinkers were included as drinkers rather than as nondrinkers. Lobo et alCitation169 excluded former drinkers from the reference group of nondrinkers.
Is there any common factor in the ratios that showed significantly worse cognition in drinkers?
Of the 446 ratios in , 123 (28%) were significantly less than 1, indicating less risk or “better” cognition in drinkers; 300 (67%) were not significantly different than 1, indicating no difference in risk for drinkers and nondrinkers (“NoDiff ”); and only 23 (5%) were significantly greater than 1, indicating greater risk or “worse” cognition in drinkers. These 23 ratios from 18 studies are plotted in and will be discussed in detail.
Figure 4 Forest plot of 23 XRs plus or minus their 95% CIs (horizontal “whiskers”) from 18 studies providing ratios where drinkers were significantly worse than nondrinkers.
Abbreviations: ♀, female; ♂, male; 3MS, Modified Mini-Mental State examination; 8t, 8 additional tests; AD, Alzheimer’s disease; ADL, Activities of Daily Living; AMT, Abbreviated Mental Test; CI, confidence interval; D, dementia; DECO, Deterioration Cognitive Observee test; DSST, Digit Symbol Substitution Test; HAMT, Hodkinson Abbreviated Mental Test; HR, hazard ratio; MMSE, Mini-Mental State Examination; MSE, mental status exam; NINCDS/ADRDA, National Institute of Neurological Communicative Disorders and Stroke/Alzheimer’s Disease and Related Disorders Association criteria for AD; NoDiff, no different; OR, odds ratio; RR, risk ratio; TELE, telephone screen for cognitive impairment; WDRT, Word Delay Recall Test; XRs, hazard ratios, odds ratios, and risk ratios; XRwm, weighted mean ratio.
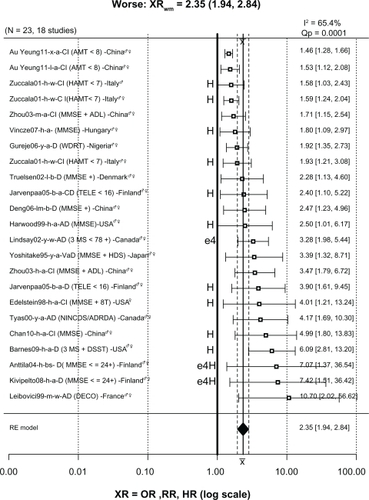
Of the 23 ratios in the “worse” group, twelve were associated with heavy drinking, including three (1.58, 1.59, 1.93) for cognitive impairment from Zuccala et alCitation123 in which subjects consumed more than 1 L/day of wine. The ratio of 1.80 for cognitive decline from the study in Hungary by Vincze et alCitation157 was for “regular” (heavy) drinkers. The ratios of 2.40 for cognitive decline and 3.90 for dementia from a Finnish study by Järvenpää et alCitation145 were both for heavy binge drinkers. The ratio of 2.50 for AD from Harwood et alCitation134 was for white non-Hispanic subjects in the US consuming more than two drinks/day, which was considered heavy drinking. The ratio of 4.01 from the study in the US by Edelstein et alCitation130 was for women drinking two drinks/day, which is considered heavy for women. The ratio of 4.99 from the study in China by Chan et alCitation167 was from heavy drinkers (>4 drinks/day). The ratio of 6.09 from the study by Barnes et alCitation162 was for heavy drinkers (>2 drinks/day). The ratios of 7.07 for dementia from Anttila et alCitation139 and 7.42 for dementia from Kivipelto et alCitation159 were from subjects in Finland drinking frequently, often in binges, who also had the apolipoprotein E epsilon 4 (APOE ɛ4) allele. Lastly, although not related to heavy drinking, the ratio of 3.28 for AD was from subjects in the Canadian Study on Health and AgingCitation127 with the APOE ɛ4 allele.
The remaining worse ratios were not clearly associated with heavy or binge drinking. The ratio of 1.46 for cognitive impairment from the study in China by Au Yeung et alCitation175 was for light drinkers, and the same study also reported a ratio of 1.53 for ex-drinkers. The ratio of 2.34 for dementia from the study by Truelsen et alCitation133 in Denmark was for beer drinkers compared with subjects who never or hardly ever drank beer. Similarly, the ratio of 2.47 for dementia from the study in China by Deng et alCitation149 was for light to moderate beer drinkers. The ratio of 3.39 for vascular dementia from Yoshitake et alCitation118 was for a broad group of drinkers in Japan in which alcohol consumption was not quantified but simply categorized into nondrinkers and drinkers. The 3.47 ratio for cognitive impairment from the study in China by Zhou et alCitation138 was for subjects consuming an unknown amount of alcohol daily; the same study reported a ratio of 1.71 for weekly consumption of an unknown amount of alcohol. The ratio of 4.17 for AD from the University of British Columbia cohort in the study in Canada by Tyas et alCitation119 was for any amount of alcohol use. Finally, the ratio of 10.70 for AD from the study in France by Leibovici et alCitation136 is for moderate wine drinkers in France only after adjustment for place of residence (community or institution); before adjustment the ratio was 0.13 (95% CI: 0.04–1.02), suggesting reduced risk. The authors explained this dramatic ratio change from 0.13 to 10.70 as due, at least in part, to demented and institutionalized residents being classed as nondrinkers due to drinking being forbidden in their facility and therefore inflating the number of AD cases in the nondrinkers group. Although this is a plausible explanation, it has not been replicated in other studies that included institutionalization as a covariate. For example, Huang et alCitation125 reported an OR for AD of 0.5 (95% CI: 0.3–0.7) in light to moderate drinkers after adjusting for age, gender, education, smoking, institutionalization (living place), and baseline MMSE score. In addition, when institutionalized subjects were excluded and the analysis repeated, the results did not change significantly. In fact, the study by McCallum et alCitation184 reported that light to moderate alcohol significantly delayed the hazard of nursing home placement.
In summary, 13/23 ratios (57%) in the “worse” group were associated with either heavy drinking (12) or the APOE ɛ4 allele (1). The remaining ten ratios linking light, moderate, or unknown amounts of alcohol consumption with significantly increased risk of dementia or cognitive impairment represent only 2.2% (10/446) of the total.
Other questions
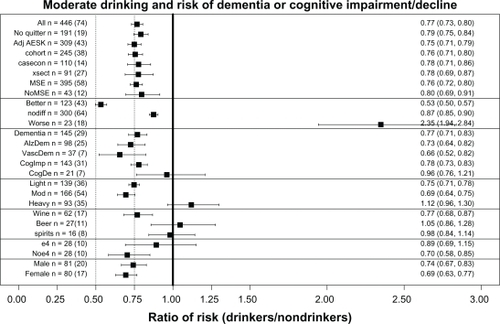
Similar meta-analyses were done for a number of other questions, which will be discussed in reference to , which presents a summary plot of the various meta-analyses carried out. As already discussed, comparing the lines labeled “All” and “Noquitter” in shows that there was no significant difference between the overall XRwm values of 0.77 for “All” and 0.79 for no “sick quitters” in the reference group. In addition, the 23 ratios from 18 studies in the line in labeled “worse” have also been discussed in detail. (For reference, the overall XRwm values for “better” and “nodiff ” groups of ratios are also presented; note that the overall weighted mean for “nodiff ” of 0.88 was also significantly less than 1).
Figure 5 Overall weighted mean ratios (XRwm) comparing cognitive function in drinkers and nondrinkers in the various groups analyzed. Group with number of ratios (number of studies) indicated on left; XRwm (95% confidence interval) given on right.
Abbreviations: AdjAESK, Adjusted for Age, Education, Sex, and Smoking; AlzDem, Alzheimer’s disease; casecon, case-control study; CogDec, cognitive decline; CogImp, cognitive improvement; e4, epsilon 4; heavy, heavy drinkers; light, light drinkers; mod, moderate drinkers; MSE, mental status exam; nodiff, no different; Noe4, no epsilon 4; NoMSE, no mental status exam; Noquitter, no quitters; VascDem, vascular dementia; XR, hazard ratio, odds ratio, and risk ratio; XRwm, weighted mean ratio; xsect, cross-sectional study.
Does statistical adjustment for age, education, sex, and smoking change the effect of alcohol on cognitive risk?
Only including studies with these adjustments produced no significant change in alcohol’s effects, as seen for AdjAESK (0.75) in .
Are there any significant differences among longitudinal cohort studies, case-control studies, or cross-sectional studies?
There was no significant difference in alcohol’s effects when the three different types of epidemiological studies were considered separately, as seen for cohort (0.76), casecon (0.78), and xsect (0.78) in .
Are there any significant differences between studies using mental status exams and those using other methods for measuring cognition?
There was no significant change in alcohol’s effects when cognition was measured in these two ways, as seen for MSE (0.76) and NoMSE (0.80) in . However, note that 90% of the ratio studies used mental status exams in some way in their measurement of cognition, so this question must also be answered by referring to the discussion of the plot in , which shows that mental status exams were more often associated with finding “better” cognition in drinkers, while neuropsychological tests were more often associated with finding “nodiff ” in cognition between drinkers and nondrinkers.
Are there different effects of moderate drinking on general dementia, AD, and vascular dementia?
There were no significant differences between alcohol’s effects on the different types of dementia, as seen for Dementia (0.77), AlzDem (0.73), and VascDem (0.66) in .
Are there specific effects of moderate drinking on cognitive impairment and cognitive decline?
shows the risk of cognitive impairment was similar to that for All and Dementia, but the risk for cognitive decline, which was measured in only 21 ratios from seven studies, did not remain significantly less than 1.0 (see CogImp [0.78] and CogDec [0.96]). The recent meta-analysis by Peters et alCitation11 also failed to find a significant benefit of alcohol use against cognitive decline (RR = 0.89; 95% CI: 0.67–1.17).
Do light, moderate, and heavy drinking have different effects on cognitive risk?
Both light and moderate drinking were associated with significantly reduced cognitive risk, while heavy drinking was associated with increased cognitive risk, as seen in (light [0.75], mod [0.69, and heavy [1.13]]).
Do different types of alcohol (wine, beer, and spirits) affect cognitive risk in the same way?
Wine provided a significant reduction in cognitive risk, while beer and spirits did not, as seen in (wine [0.77], beer [1.05], and spirits [0.98]). Consistent with this finding, in the Washington Heights-Inwood Columbia Aging Project (WHICAP) cohort Luchsinger et alCitation142 found a reduced risk (RR = 0.45) of AD only in those consuming up to three daily servings of wine who also lacked the APOE ɛ4 allele; there was no significant reduction of risk in those consuming beer (RR = 1.47) and spirits (RR = 1.51). However, this conclusion must be qualified in two ways. First, it is based on a relatively small number of ratios from a small number of studies. Second, a number of studies explicitly looked for but did not find a difference between types of alcohol. For example, Huang et alCitation125 found that light to moderate drinkers had a significantly reduced risk of developing dementia compared with nondrinkers (RR = 0.50), regardless of the type of alcohol consumed. Likewise, the Rotterdam StudyCitation129 found a significantly reduced risk (HR = 0.58) of dementia in moderate (≤3 drinks/day) drinkers of any type of alcohol. In addition, when Ruitenberg et alCitation129 used the HR for dementia of wine drinkers as the reference (1.00), they found the HR for beer was 0.64 (95% CI: 0.25–1.61) and for spirits was 1.32 (95% CI: 0.77–2.26), yielding no significant differences between these types of alcohol. However, male and female drinkers were combined for this analysis, and the two sexes have different drinking patterns, which may have masked genuine differences among types of alcohol.Citation160
Does the APOE ɛ4 allele alter the effect of alcohol on cognition?
The presence of the APOE ɛ4 allele appeared to eliminate the significantly reduced cognitive risk effect of moderate drinking, as seen for e4 (0.89) and noe4 (0.70) in . Consistent with this conclusion, in the WHICAP cohort Luchsinger et alCitation142 found a reduced risk (RR = 0.45) of AD only in those without the APOE ɛ4 allele who were drinking up to three daily servings of wine. Similarly, in Canada, Lindsay et alCitation127 reported an increased risk (OR = 3.28) for AD for drinkers (any amount) with the APOE ɛ4 allele. Likewise, the study in Finland by Anttila et alCitation139 found that infrequent (<1 drink/month) “binge” drinkers without the APOE ɛ4 had a nonsignificantly reduced risk of dementia (RR = 0.45) compared with nondrinkers, while infrequent “binge” drinkers with APOE ɛ4 had a large and significant increase in the risk of dementia (RR = 2.30). The same study reported an increased risk (OR = 7.07) for dementia in heavy (frequent) drinkers with the APOE ɛ4 allele. Furthermore, Harwood et alCitation185 reported that those with the APOE ɛ4 allele have an earlier onset of AD by an average of 2.6 (for one ɛ4) or 5.3 (for two ɛ4s) years.
In contrast, the Rotterdam StudyCitation129 reported the HR was reduced in subjects with the APOE ɛ4 allele, but the sample and the difference were both small. Likewise, Carmelli et alCitation132 found that light drinking (≤1 drink/day) by white male veterans was associated with a significantly reduced risk (OR = 0.60) of poor cognitive function using the MMSE, particularly among those with the APOE ɛ4 allele. Similarly, Tanaka et alCitation131 reported an OR of 1.60 (1.00, 2.55) for AD in moderate drinkers without the APOE ɛ4 allele.
Lastly, no effect of APOE ɛ4 was found in the Nurses’ Health StudyCitation147 in which women drinking moderately (1 drink/day) had a significantly reduced risk of cognitive decline (RR = 0.85), as measured by being in the worst 10% of the distribution of decline on the TICS.
In conclusion, although analysis found that the presence of APOE ɛ4 allele eliminated any significant “protective” effect of moderate ethanol on cognitive risk, a number of other studies have found an opposite effect and our results are based on a relatively small number of ratios from just ten studies, leaving this question unsettled.
Does the sex of the drinker alter the effect of alcohol on cognition?
There was no difference in alcohol’s effects between sexes, as seen in (male, 0.74; female, 0.69), despite the fact that men and women have very different drinking patterns. In general, male drinkers drink more than female drinkers and prefer beer and spirits, while female drinkers prefer wine.Citation77,Citation89,Citation129,Citation133,Citation137,Citation140
Does the effect of alcohol on cognition vary with country?
The beneficial association of moderate drinking with reduced cognitive risk was found in almost all countries studied (see ). These analyses were first done using all the ratios from each country, including ratios from heavy drinkers or those carrying the APOE ɛ4 allele. This “all ratios” approach found a significant benefit in the US (USA), the United Kingdom (UK), France, Italy, Spain, Germany, the Netherlands, Sweden, Australia, Brazil, and Korea (as seen above the heavy dashed line running horizontally in ), although for some countries (those below the same line in ) the approach failed to find a significant benefit. However, if ratios from heavy drinkers or those carrying the APOE ɛ4 allele were excluded, the country’s ratio then showed a significant benefit. For example, compare the canada and canada-ne4 (no ɛ4) lines, or the finland and finl-ne4h (no ɛ4 and no heavy drinkers) lines. In Denmark the initial analysis (denmark) showed no benefit, but a benefit was seen if only wine drinkers were included (denmark-wn). Similarly, China and Taiwan (chinat) initially showed no significant benefit, but if heavy drinkers were excluded (chinat-nh) a significant benefit was found. However, this strategy did not succeed in identifying a significant benefit for Hungary (compare hungary and hungary-nh lines) or for Japan (compare japan and japan-nh lines). However, in the case of Japan it should be noted that two studies of Japanese Americans (japan-amer)Citation114,Citation148 did find a significant benefit of alcohol, suggesting failure to find a significant benefit in the studies in Japan may not have a genetic basis. In addition, one “no ratio” study of Japanese Americans found better cognition in moderate drinkers.Citation79 No overall benefit was seen in two studies from Nigeria, although one of the studies did have an OR significantly lower than 1Citation151 while the other did notCitation150 (solid dots indicate these two ORs in ). Two studies of African-Americans did find nonsignificantly reduced risk in drinkers.Citation135,Citation151 Lastly, one study in GreeceCitation128 reported a nonsignificantly reduced risk in drinkers.
Figure 6 Overall weighted mean ratios (XRwm) comparing cognitive risk in drinkers and nondrinkers by country. Country with number of ratios (number of studies) indicated on left; XRwm (95% confidence interval) given on right.
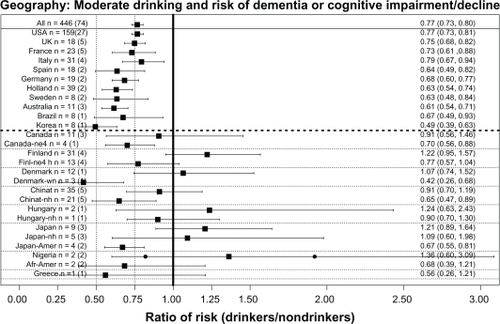
The absence of studies from Eastern Europe and Russia is notable, but a 2009 paper with a large number of Russian authors stated: “To our knowledge, there are no published or ongoing population-based studies designed to estimate the prevalence of AD and other forms of dementia in Russia.”Citation186
General discussion
Summary
The history of research on moderate drinking and cognition can be divided into two eras: 1977–1997 and 1998–present. Phase I (1977–1997) was the era of neuropsychological evaluation involving mostly young to middle-aged (18–50 years old) subjects. Although initial studies indicated moderate drinking impaired cognition, many later studies failed to confirm this, instead finding no difference in cognition between drinkers and nondrinkers. Phase II (1998–present) was and is the era of mental status exam evaluation involving mostly older (≥55 years old) subjects. These studies overwhelmingly found that moderate drinking either reduced or had no effect on the risk of dementia or cognitive impairment.
When all the ratios of risk from all the studies in phase II providing such ratios are entered into a comprehensive meta-analysis, the average ratio of risk for cognitive risk (dementia or cognitive impairment/decline) associated with moderate “social” drinking of alcohol is 0.77, with nondrinkers as the reference group. This value is similar to the values obtained by two recent and much more selective meta-analyses (Anstey et alCitation12 overall RR = 0.74; Peters et alCitation11 overall RR = 0.73). The benefit of moderate drinking applied to all forms of dementia and to cognitive impairment, but no significant benefit against cognitive decline was found.
Both light and moderate drinking provided a similar benefit, but heavy drinking was associated with nonsignificantly higher cognitive risk for dementia and cognitive impairment.
Although the meta-analysis also indicated that wine was better than beer or spirits, this was based on a relatively small number of studies because most studies did not distinguish among these different types of alcohol. Furthermore, a number of the studies that did make this distinction reported no difference between the effects of these different types of alcohol. Therefore, at present this question remains unanswered.
Analysis also showed the presence of the APOE ɛ4 allele eliminated the benefit of moderate drinking. However, the analysis was based on a relatively small number of studies, and several other studies have found the opposite effect. Further studies are necessary to settle this question.
The benefit of moderate alcohol was seen in both men and women, although the pattern of drinking is very different between the two sexes, with male drinkers drinking much more than female drinkers and women tending to prefer wine over other forms of alcohol.Citation129,Citation160
Overall, light to moderate drinking does not appear to impair cognition in younger subjects and actually seems to reduce the risk of dementia and cognitive decline in older subjects. This basic finding was the same in many different countries, particularly when results from heavy drinkers or subjects with the APOE ɛ4 allele were excluded.
Mental status exams
The MMSE,Citation187 which has been the “workhorse” of the mental status era, is considered to have several weaknesses, including relatively poor assessment of executive function and floor and ceiling effects because it has only 30 possible points.Citation188,Citation189 These limitations were reviewed in a recent meta-analysis of the MMSE, which concluded it was best for “ruling-out a diagnosis of dementia in community and primary care” and that “for all other uses it should be combined with or replaced by other methods.”Citation190 Nonetheless, the very fact of the MMSE’s widespread use means that “the same ruler” has been applied to measuring cognition in many studies, making the consistent results of a benefit of moderate drinking plausible. In addition, in about 60% of the 67 studies with and without ratios that used some type of mental status exam, the status exam was combined with one or more other measurements of cognition, making the judgment of dementia or cognitive impairment more reliable.
Comparison with other cognitive risk reducers
How does an overall ratio of 0.77 compare with ratios of risk associated with other “treatments” or activities that have shown some benefit against dementia and cognitive decline? Those who eat a Mediterranean diet – which includes high intake of vegetables, fruits, cereals, fish, olive oil, and wine – have an OR for dementia of 0.60.Citation191 Similarly, Gu et alCitation192 reported that the HR for AD was 0.62 (95% CI: 0.43–0.89) after multivariable adjustment for subjects in the highest third of conformity to a specific dietary pattern associated with reduced AD risk. Likewise, more years of education and the associated fuller participation in social and intellectual lifeCitation193 provide a benefit of similar magnitude (overall RR of 0.84), perhaps by producing a “cognitive reserve” that results in a more gradual rate of cognitive decline.Citation194 Gardening has also been associated with a reduced risk (HR = 0.64) of AD.Citation152 Therefore, the reduced cognitive risk from moderate drinking is similar in size to the reduced risk associated with other factors.
Other beneficial outcomes of moderate drinking
Mukamal et alCitation195 found that low to moderate alcohol consumption (5–30 g/day) further reduced the risk (OR = 0.38; 95% CI: 0.16–0.89) of myocardial infarction in men (8867 subjects), even if they were also nonsmokers who were active ≥30 min/day and had a body mass index of <25. Similarly, in the Healthy Aging: a Longitudinal study in Europe project, low to moderate alcohol consumption was found to have a similarly beneficial effect on risk of mortality (HR = 0.78) to a Mediterranean diet (HR = 0.77), physical activity (HR = 0.63), and nonsmoking (HR = 0.65), with the combination of all four beneficial factors reducing the risk of mortality to 0.35.Citation196 Imhof et alCitation197 found that low to moderate drinking reduced a variety of biomarkers of inflammation, including C-reactive protein, fibrinogen, white blood cell count, and plasma viscosity. Britton et alCitation198 found that a cardioprotective benefit of moderate drinking was found among those with poor health behaviors (little exercise, poor diet, and smoking), but no additional cardioprotective benefit of alcohol was found in those with the healthiest behavior profile. French and ZavalaCitation199 found that current moderate drinkers had the highest odds (OR = 1.27 for men, OR = 2.03 for women) of reporting above-average health status compared with nondrinkers. Karlamangla et alCitation200 found that light to moderate drinking was associated with a reduced risk for incident disability or death over 5 years compared with abstention (OR = 0.77). Tien et alCitation201 found that low to moderate blood alcohol level at the time of a traumatic brain injury is associated with reduced risk of mortality (OR = 0.76; 95% CI: 0.52–0.98). Overall, then, the reduced cognitive risk associated with moderate drinking is comparable with the reduced risk for death, cardiovascular disease, and other morbidities.
Conclusion
Heavy drinking (>3–4 drinks/day) is associated with an increased risk of dementia and cognitive impairment, in addition to all the other horrible and devastating consequences of alcohol abuse and alcoholism for the individual and their family and friends, and society in general. However, light to moderate drinking (≤2 drinks/day for men, ≤1 drink/day for women) by adults does not increase the risk of dementia, cognitive decline, or cognitive impairment – a conclusion also reached by a recent comprehensive review.Citation13 In fact, notwithstanding the conclusion in a recent article that “no evidence of even moderate scientific quality exists to support the association of any modifiable factor … with reduced risk for Alzheimer disease,”Citation202 there is substantial evidence that light to moderate drinking (as defined in the National Institute on Alcohol Abuse and Alcoholism’s position paper on moderate drinkingCitation203), particularly of wine, reduces the risk of dementia and cognitive impairment.
Acknowledgements
Support of the authors’ research by NIH (AA013568) is acknowledged.
Disclosure
The authors report no conflicts of interest in this work.
References
- BelmadaniAKumarSSchipmaMInhibition of amyloid-beta-induced neurotoxicity and apoptosis by moderate ethanol preconditioningNeuroreport2004152093209615486488
- GoldeTEAlzheimer disease therapy: can the amyloid cascade be halted?J Clin Invest2003111111812511580
- CollinsMANeafseyEJMukamalKJAlcohol in moderation, cardioprotection, and neuroprotection: epidemiological considerations and mechanistic studiesAlcohol Clin Exp Res20093320621919032583
- CollinsMANeafseyEJWangKModerate ethanol preconditioning of rat brain cultures engenders neuroprotection against dementia-inducing neuroinflammatory proteins: possible signaling mechanismsMol Neurobiol20104142042520422315
- MitchellRMNeafseyEJCollinsMAEssential involvement of the NMDA receptor in ethanol preconditioning-dependent neuroprotection from amyloid-beta in vitroJ Neurochem200911158058819694907
- SivaswamySNeafseyEJCollinsMANeuroprotective preconditioning of rat brain cultures with ethanol: potential transduction by PKC isoforms and focal adhesion kinase upstream of increases in effector heat shock proteinsEur J Neurosci2010321800181221050276
- YamaguchiTDaytonCBRossCRLate preconditioning by ethanol is initiated via an oxidant-dependent signaling pathwayFree Radic Biol Med20033436537612543252
- WangQSunAYSimonyiAEthanol preconditioning protects against ischemia/reperfusion-induced brain damage: role of NADPH oxidase-derived ROSFree Radic Biol Med2007431048106017761301
- PeeleSBrodskyAExploring psychological benefits associated with moderate alcohol use: a necessary corrective to assessments of drinking outcomes?Drug Alcohol Depend20006022124711053757
- FerreiraMPWeemsMKAlcohol consumption by aging adults in the United States: health benefits and detrimentsJ Am Diet Assoc20081081668167618926132
- PetersRPetersJWarnerJAlcohol, dementia and cognitive decline in the elderly: a systematic reviewAge Ageing20083750551218487267
- AnsteyKJMackHACherbuinNAlcohol consumption as a risk factor for dementia and cognitive decline: meta-analysis of prospective studiesAm J Geriatr Psychiatry20091754255519546653
- PanzaFCapursoCD’IntronoAAlcohol drinking, cognitive functions in older age, predementia, and dementia syndromesJ Alzheimers Dis20091773119494429
- PinderRMSandlerMAlcohol, wine and mental health: focus on dementia and strokeJ Psychopharmacol20041844945615582912
- BrustJCEthanol and cognition: indirect effects, neurotoxicity and neuroprotection: a reviewInt J Environ Res Public Health201071540155720617045
- LeeYBackJHKimJSystematic review of health behavioral risks and cognitive health in older adultsInt Psychogeriatr20102217418719883522
- SolfrizziVPanzaFFrisardiVDiet and Alzheimer’s disease risk factors or prevention: the current evidenceExpert Rev Neurother20111167770821539488
- SeuxMLThijsLForetteFCorrelates of cognitive status of old patients with isolated systolic hypertension: the Syst-Eur Vascular Dementia ProjectJ Hypertens1998169639699794736
- SistromCLGarvanCWProportions, odds, and riskRadiology2004230121914695382
- HolcombWLChaiworapongsaTLukeDAAn odd measure of risk: use and misuse of the odds ratioObstet Gynecol20019868568811576589
- HirtzDThurmanDJGwinn-HardyKHow common are the “common” neurologic disorders?Neurology20076832633717261678
- SolfrizziVPanzaFColaciccoAMVascular risk factors, incidence of MCI, and rates of progression to dementiaNeurology2004631882189115557506
- GlassGVPrimary, secondary, and meta-analysis of researchEducational Researcher1976538
- DurlakJALipseyMWA practitioner’s guide to meta-analysisAm J Comm Pschol199119291332
- StroupDFBerlinJAMortonSCMeta-analysis of observational studies in epidemiology: a proposal for reporting; Meta-analysis Of Observational Studies in Epidemiology (MOOSE) groupJAMA20002832008201210789670
- GlassGVMeta-analysis at 2520001 Available from: http://www.gvglass.info/papers/meta25.html. Accessed July 25, 2011.
- EngelsEASchmidCHTerrinNHeterogeneity and statistical significance in meta-analysis: an empirical study of 125 meta-analysesStat Med2000191707172810861773
- HigginsJPThompsonSGQuantifying heterogeneity in a meta-analysisStat Med2002211539155812111919
- Huedo-MedinaTBSáchez-MecaJMarín-MartínezFAssessing heterogeneity in meta-analysis: Q statistic or I2 index?Psychol Methods20061119320616784338
- BlandJMAltmanDGStatistics notes: the odds ratioBMJ2000320146810827061
- EggerMSmithG DaveySchneiderMBias in meta-analysis detected by a simple, graphical testBMJ19973156296349310563
- LauJIoannidisJPTerrinNThe case of the misleading funnel plotBMJ200633359760016974018
- BeggCBMazumdarMOperating characteristics of a rank correlation test for publication biasBiometrics199450108811017786990
- R Development Core TeamR: A language and environment for statistical computingViennaR Foundation for Statistical Computing2011
- ParkerESNobleEPAlcohol consumption and cognitive functioning in social drinkersJ Stud Alcohol19773812241232895141
- RybackRSThe continuum and specificity of the effects of alcohol on memory: a reviewQ J Stud Alcohol19713299510164944697
- ParsonsOANixonSJCognitive functioning in sober social drinkers: a review of the research since 1986J Stud Alcohol1998591801909500305
- ParsonsOACognitive functioning in sober social drinkers: a review and critiqueJ Stud Alcohol1986471011143713172
- ParkerESParkerDAHarfordTCSpecifying the relationship between alcohol use and cognitive loss: the effects of frequency of consumption and psychological distressJ Stud Alcohol1991523663731875711
- ParkerDAParkerESBrodyJAAlcohol use and cognitive loss among employed men and womenAm J Public Health1983735215266837815
- SchinkaJABelangerHMortimerJAEffects of the use of alcohol and cigarettes on cognition in elderly African American adultsJ Int Neuropsychol Soc2003969069712901775
- SchinkaJAVanderploegRDRogishMEffects of the use of alcohol and cigarettes on cognition in elderly adultsJ Int Neuropsychol Soc2002881181812240745
- ParkerESParsonsOAFabianMSComments on “cognitive functioning in men social drinkers: a replication study”J Stud Alcohol198243178182
- ParkerESBirnbaumIMBoydRANeuropsychologic decrements as a function of alcohol intake in male studentsAlcohol Clin Exp Res198043303346996520
- BirnbaumIMTaylorTHParkerESAlcohol and sober mood state in female social drinkersAlcohol Clin Exp Res198373623686362459
- JonesMKJonesBMThe relationship of age and drinking habits to the effects of alcohol on memory in womenJ Stud Alcohol1980411791867366213
- CalaLAJonesBBurnsPResults of computerized tomography, psychometric testing and dietary studies in social drinkers, with emphasis on reversibility after abstinenceMed J Aust198322642696646037
- MacVaneJButtersNMontgomeryKCognitive functioning in men social drinkers: a replication studyJ Stud Alcohol19824381957109619
- HannonRButlerCPDayCLAlcohol use and cognitive functioning in men and women college studentsRecent Dev Alcohol198532412523975451
- HannonRDayCLButlerAMAlcohol consumption and cognitive functioning in college studentsJ Stud Alcohol1983442832986645513
- BergmanHCognitive deficits and morphological cerebral changes in a random sample of social drinkersRecent Dev Alcohol198532652763975453
- HuntECogganPBergCThe effects of social drinking practices on cognitive performance Unpublished manuscript, Department of Psychology, University of Washington;1984
- ParsonsOAAre there nonacute effects of social drinking on mental functioning? Unpublished manuscript presented at: the 13th International Medical Advisory Conference;1984 Cambridge MA (cited in Parsons 1986 review).
- Jones-SaumtyDJZeinerARPsychological correlates of drinking behavior in social drinker college studentsAlcohol Clin Exp Res198591581633890597
- MartinESherKFWoodPKSubstance use and neuropsychological test performance in college studentsPaper presented at: the annual meeting of the Association for the Advancement of Behavior Therapy1991New York
- CareyKBMaistoSAEffect of a change in drinking pattern on the cognitive function of female social drinkersJ Stud Alcohol1987482362423657165
- FarmerMEWhiteLRAbbottRDBlood pressure and cognitive performance: the Framingham StudyAm J Epidemiol1987126110311143687920
- PageRDClevelandMFCognitive dysfunction and aging among male alcoholics and social drinkersAlcohol Clin Exp Res1987113763843307509
- NicholsJMMartinFKirkbyKCA comparison of the effect of lorazepam on memory in heavy and low social drinkersPsychopharmacology (Berl)19931124754827871060
- MangioneCMSeddonJMCookEFCorrelates of cognitive function scores in elderly outpatientsJ Am Geriatr Soc1993414914978486880
- BowdenSCBrain impairment in social drinkers? no cause for concernAlcohol Clin Exp Res1987114074103307513
- FoxAMMichiePTColtheartMMemory functioning in social drinkers: a study of event-related potentialsAlcohol Alcohol1995303033107545984
- GoodwinJSSanchezCJThomasPAlcohol intake in a healthy elderly populationAm J Public Health1987771731773799856
- EmmersonRYDustmanREHeilJNeuropsychological performance of young nondrinkers, social drinkers, and long- and short-term sober alcoholicsAlcohol Clin Exp Res1988126256293067605
- AltermanAIHallJGEffects of social drinking and familial alcoholism risk on cognitive functioning: null findingsAlcohol Clin Exp Res1989137998032690666
- WaughMJacksonMFoxGAEffect of social drinking on neuropsychological performanceBr J Addict1989846596672752196
- BatesMETracyJICognitive functioning in young “social drinkers”: is there impairment to detect?J Abnorm Psychol1990992422492212274
- SalaméPThe effects of alcohol on learning as a function of drinking habitsErgonomics199134123112411743180
- ScherrPAAlbertMSFunkensteinHHCorrelates of cognitive function in an elderly community populationAm J Epidemiol1988128108411013189282
- ArbuckleTYChaikelsonJSGoldDPSocial drinking and cognitive functioning revisited: the role of intellectual endowment and psychological distressJ Stud Alcohol1994553523618022184
- ChristianJCReedTCarmelliDSelf-reported alcohol intake and cognition in aging twinsJ Stud Alcohol1995564144167674676
- CarmelliDSwanGELaRueACorrelates of change in cognitive function in survivors from the Western Collaborative Group StudyNeuroepidemiology1997162852959430128
- CerhanJRFolsomARMortimerJACorrelates of cognitive function in middle-aged adults: Atherosclerosis Risk in Communities (ARIC) Study InvestigatorsGerontology199844951059523221
- DentOFSulwayMRBroeGAAlcohol consumption and cognitive performance in a random sample of Australian soldiers who served in the Second World WarBMJ1997314165516579180067
- BroeGACreaseyHJormAFHealth habits and risk of cognitive impairment and dementia in old age: a prospective study on the effects of exercise, smoking and alcohol consumptionAust N Z J Public Health1998226216239744220
- NixonSJAlcohol, aging, and cognitionGombergESLHegedusAMZuckerRAAlcohol problems and aging NIAAA Research Monograph No. 33, NIH Publication No. 98–4163Bethesda, MDNational Institute on Alcohol Abuse and Alcoholism1998213227
- EliasPKEliasMFD’AgostinoRBAlcohol consumption and cognitive performance in the Framingham Heart StudyAm J Epidemiol199915058058910489997
- SandsMLSchwartzAVBrownBWRelationship of neurological function and age in older women: the study of osteoporotic fracturesNeuroepidemiology1998173183299778598
- BondGEBurrRMcCurrySMAlcohol, aging, and cognitive performance in a cohort of Japanese Americans aged 65 and older: the Kame projectInt Psychogeriatr20011320722311495395
- KalmijnSvan BoxtelMPVerschurenMWCigarette smoking and alcohol consumption in relation to cognitive performance in middle ageAm J Epidemiol200215693694412419766
- ElwoodPCGallacherJEHopkinsonCASmoking, drinking, and other life style factors and cognitive function in men in the Caerphilly cohortJ Epidemiol Community Health19995391410326046
- LeroiISheppardJMLyketsosCGCognitive function after 11.5 years of alcohol use: relation to alcohol useAm J Epidemiol200215674775212370163
- WangLvan BelleGKukullWBPredictors of functional change: a longitudinal study of nondemented people aged 65 and olderJ Am Geriatr Soc2002501525153412383150
- BondGEBurrRRiceMMAlcohol, aging, and cognitive performance: a cross-cultural comparisonJ Aging Health20031537139012795279
- ReidMCMaciejewskiPKHawkinsKARelationship between alcohol consumption and Folstein mini-mental status examination scores among older cognitively impaired adultsJ Geriatr Psychiatry Neurol200215313711936241
- SchinkaJAVanderploegRDRogishMEffects of alcohol and cigarette use on cognition in middle-aged adultsJ Int Neuropsychol Soc2002868369012164677
- ZimmermanTMcDougallGJBeckerHOlder women’s cognitive and affective response to moderate drinkingInt J Geriatr Psychiatry2004191095110215481070
- LindemanRDWayneSJBaumgartnerRNCognitive function in drinkers compared to abstainers in the New Mexico elder health surveyJ Gerontol A Biol Sci Med Sci2005601065107016127114
- KrahnDFreeseJHauserRAlcohol use and cognition at mid-life: the importance of adjusting for baseline cognitive ability and educational attainmentAlcohol Clin Exp Res2003271162116612878923
- YonkerJENilssonLGHerlitzASex differences in spatial visualization and episodic memory as a function of alcohol consumptionAlcohol Alcohol20054020120715797882
- RodgersBWindsorTDAnsteyKJNon-linear relationships between cognitive function and alcohol consumption in young, middle-aged and older adults: the PATH Through Life ProjectAddiction20051001280129016128717
- RichardsMHardyRWadsworthMEAlcohol consumption and midlife cognitive change in the British 1946 birth cohort studyAlcohol Alcohol20054011211715582985
- StottDJFalconerAKerrGDDoes low to moderate alcohol intake protect against cognitive decline in older people?J Am Geriatr Soc2008562217222419093921
- ReidMCVan NessPHHawkinsKALight to moderate alcohol consumption is associated with better cognitive function among older male veterans receiving primary careJ Geriatr Psychiatry Neurol2006199810516690995
- CooperCBebbingtonPMeltzerHAlcohol in moderation, premorbid intelligence and cognition in older adults: results from the Psychiatric Morbidity SurveyJ Neurol Neurosurg Psychiatry2009801236123919620140
- McDougallGJBeckerHAreheartKLOlder males, cognitive function, and alcohol consumptionIssues Ment Health Nurs20062733735316546934
- AndersenKLolkAMartinussenTVery mild to severe dementia and mortality: a 14-year follow-up – the Odense studyDement Geriatr Cogn Disord201029616720110702
- NganduTHelkalaELSoininenHAlcohol drinking and cognitive functions: findings from the Cardiovascular Risk Factors Aging and Dementia (CAIDE) StudyDement Geriatr Cogn Disord20072314014917170526
- CaspersKArndtSYucuisREffects of alcohol- and cigarette-use disorders on global and specific measures of cognition in middle-age adultsJ Stud Alcohol Drugs20107119220020230716
- LangIWallaceRBHuppertFAModerate alcohol consumption in older adults is associated with better cognition and well-being than abstinenceAge Ageing20073625626117353234
- SabiaSGuéguenABerrCHigh alcohol consumption in middle-aged adults is associated with poorer cognitive performance only in the low socio-economic group: results from the GAZEL cohort studyAddiction20111069310120840170
- TownsendMKDevoreEKangJHThe relation between moderate alcohol consumption and cognitive function in older women with type 2 diabetesDiabetes Res Clin Pract20098532232719625098
- XuGLiuXYinQAlcohol consumption and transition of mild cognitive impairment to dementiaPsychiatry Clin Neurosci200963434919154211
- ArntzenKASchirmerHWilsgaardTModerate wine consumption is associated with better cognitive test results: a 7 year follow up of 5033 subjects in the Tromsø StudyActa Neurol Scand Suppl2010190232920586731
- YamazakiYMiwaTSakuraiHClinical backgrounds and morbidity of cognitive impairment in elderly diabetic patientsEndocr J20115810911521273735
- HeymanAWilkinsonWEStaffordJAAlzheimer’s disease: a study of epidemiological aspectsAnn Neurol1984153353416742780
- HofmanAvan DuijnCMAlzheimer’s disease, Parkinson’s disease and smokingNeurobiol Aging199011295
- CervillaJAPrinceMMannASmoking, drinking, and incident cognitive impairment: a cohort community based study included in the Gospel Oak projectJ Neurol Neurosurg Psychiatry20006862262610766894
- FrenchLRSchumanLMMortimerJAA case-control study of dementia of the Alzheimer typeAm J Epidemiol19851214144214014131
- IliffeSHainesABooroffAAlcohol consumption by elderly people: a general practice surveyAge Ageing1991201201232053500
- CommengesDScotetVRenaudSIntake of flavonoids and risk of dementiaEur J Epidemiol20001635736310959944
- AmaducciLAFratiglioniLRoccaWARisk factors for clinically diagnosed Alzheimer’s disease: a case-control study of an Italian populationNeurology1986369229313714054
- HebertLEScherrPABeckettLARelation of smoking and alcohol consumption to incident Alzheimer’s diseaseAm J Epidemiol19921353473551550089
- GalanisDJJosephCMasakiKHA longitudinal study of drinking and cognitive performance in elderly Japanese American men: the Honolulu-Asia Aging StudyAm J Public Health2000901254125910937006
- GuralnikJMKaplanGAPredictors of healthy aging: prospective evidence from the Alameda County studyAm J Public Health1989797037082729467
- EnsrudKENevittMCYunisCCorrelates of impaired function in older womenJ Am Geriatr Soc1994424814898176141
- HébertRLindsayJVerreaultRVascular dementia: incidence and risk factors in the Canadian study of health and agingStroke2000311487149310884442
- YoshitakeTKiyoharaYKatoIIncidence and risk factors of vascular dementia and Alzheimer’s disease in a defined elderly Japanese population: the Hisayama StudyNeurology199545116111687783883
- TyasSLKovalJJPedersonLLDoes an interaction between smoking and drinking influence the risk of Alzheimer’s disease? results from three Canadian data setsStat Med2000191685169610844727
- HendrieHCGaoSHallKSThe relationship between alcohol consumption, cognitive performance, and daily functioning in an urban sample of older black AmericansJ Am Geriatr Soc199644115811658855993
- DeCarliCMillerBLSwanGECerebrovascular and brain morphologic correlates of mild cognitive impairment in the National Heart, Lung, and Blood Institute Twin StudyArch Neurol20015864364711295996
- LaunerLJFeskensEJKalmijnSSmoking, drinking, and thinking: the Zutphen Elderly StudyAm J Epidemiol19961432192278561155
- ZuccalaGOnderGPedoneCDose-related impact of alcohol consumption on cognitive function in advanced age: results of a multicenter surveyAlcohol Clin Exp Res2001251743174811781507
- DufouilCDucimetièrePAlperovitchASex differences in the association between alcohol consumption and cognitive performance: EVA Study Group; Epidemiology of Vascular AgingAm J Epidemiol19971464054129290500
- HuangWQiuCWinbladBAlcohol consumption and incidence of dementia in a community sample aged 75 years and olderJ Clin Epidemiol20025595996412464371
- OrgogozoJMDartiguesJFLafontSWine consumption and dementia in the elderly: a prospective community study in the Bordeaux areaRev Neurol (Paris)19971531851929296132
- LindsayJLaurinDVerreaultRRisk factors for Alzheimer’s disease: a prospective analysis from the Canadian Study of Health and AgingAm J Epidemiol200215644545312196314
- TsolakiMFountoulakisKChantziERisk factors for clinically diagnosed Alzheimer’s disease: a case-control study of a Greek populationInt Psychogeriatr199793273419513031
- RuitenbergAvan SwietenJCWittemanJCAlcohol consumption and risk of dementia: the Rotterdam StudyLancet200235928128611830193
- EdelsteinSLKritz-SilversteinDBarrett-ConnorEProspective association of smoking and alcohol use with cognitive function in an elderly cohortJ Womens Health19987127112819929860
- TanakaNAsadaTKinoshitaTAlcohol consumption and risk of dementiaLancet200236049112241751
- CarmelliDSwanGEReedTThe effect of apolipoprotein E epsilon4 in the relationships of smoking and drinking to cognitive functionNeuroepidemiology19991812513310202267
- TruelsenTThudiumDGronbaekMAmount and type of alcohol and risk of dementia: the Copenhagen City Heart StudyNeurology2002591313131912427876
- HarwoodDGBarkerWWLoewensteinDAA cross-ethnic analysis of risk factors for AD in white Hispanics and white non-HispanicsNeurology19995255155610025786
- BachmanDLGreenRCBenkeKSComparison of Alzheimer’s disease risk factors in white and African American familiesNeurology2003601372137412707449
- LeiboviciDRitchieKLedésertBThe effects of wine and tobacco consumption on cognitive performance in the elderly: a longitudinal study of relative riskInt J Epidemiol199928778110195668
- MukamalKJKullerLHFitzpatrickALProspective study of alcohol consumption and risk of dementia in older adultsJAMA20032891405141312636463
- ZhouHDengJLiJStudy of the relationship between cigarette smoking, alcohol drinking and cognitive impairment among elderly people in ChinaAge Ageing20033220521012615566
- AnttilaTHelkalaELViitanenMAlcohol drinking in middle age and subsequent risk of mild cognitive impairment and dementia in old age: a prospective population based studyBMJ200432953915304383
- BrittonASingh-ManouxAMarmotMAlcohol consumption and cognitive function in the Whitehall II StudyAm J Epidemiol200416024024715257997
- LarrieuSLetenneurLHelmerCNutritional factors and risk of incident dementia in the PAQUID longitudinal cohortJ Nutr Health Aging2004815015415129300
- LuchsingerJATangMXSiddiquiMAlcohol intake and risk of dementiaJ Am Geriatr Soc20045254054615066068
- EspelandMAGuLMasakiKHAssociation between reported alcohol intake and cognition: results from the Women’s Health Initiative Memory StudyAm J Epidemiol200516122823815671255
- GanguliMBiltJ VanderSaxtonJAAlcohol consumption and cognitive function in late life: a longitudinal community studyNeurology2005651210121716247047
- JärvenpääTRinneJOKoskenvuoMBinge drinking in midlife and dementia riskEpidemiology20051676677116222166
- RozziniRTrabucchiMRe: “Association between reported alcohol intake and cognition: results from the Women’s Health Initiative Memory Study”Am J Epidemiol2005162294295 author reply29529615987726
- StampferMJKangJHChenJEffects of moderate alcohol consumption on cognitive function in womenN Engl J Med200535224525315659724
- DaiQPruettSBDifferent effects of acute and chronic ethanol on LPS-induced cytokine production and TLR4 receptor behavior in mouse peritoneal macrophagesJ Immunotoxicol2006321722518958703
- DengJZhouDHLiJA 2-year follow-up study of alcohol consumption and risk of dementiaClin Neurol Neurosurg200610837838316084641
- GurejeOOgunniyiAKolaLIncidence of and risk factors for dementia in the Ibadan study of agingJ Am Geriatr Soc20115986987421568957
- OgunniyiAHallKSGurejeORisk factors for incident Alzheimer’s disease in African Americans and YorubaMetab Brain Dis20062123524016850256
- SimonsLASimonsJMcCallumJLifestyle factors and risk of dementia: dubbo study of the elderlyMed J Aust2006184687016411871
- WrightCBElkindMSRundekTAlcohol intake, carotid plaque, and cognition: the Northern Manhattan StudyStroke2006371160116416601215
- YipAGBrayneCMatthewsFERisk factors for incident dementia in England and Wales: the Medical Research Council Cognitive Function and Ageing Study; a population-based nested case-control studyAge Ageing20063515416016414964
- McGuireLCAjaniUAFordESCognitive functioning in late life: the impact of moderate alcohol consumptionAnn Epidemiol200717939917027288
- SolfrizziVD’IntronoAColaciccoAMAlcohol consumption, mild cognitive impairment, and progression to dementiaNeurology2007681790179917515541
- VinczeGAlmosPBodaKRisk factors of cognitive decline in residential care in HungaryInt J Geriatr Psychiatry2007221208121617562518
- WadleyVGMcClureLAHowardVJCognitive status, stroke symptom reports, and modifiable risk factors among individuals with no diagnosis of stroke or transient ischemic attack in the REasons for Geographic and Racial Differences in Stroke (REGARDS) StudyStroke2007381143114717322077
- KivipeltoMRovioSNganduTApolipoprotein E epsilon4 magnifies lifestyle risks for dementia: a population-based studyJ Cell Mol Med2008122762277118318693
- MehligKSkoogIGuoXAlcoholic beverages and incidence of dementia: 34-year follow-up of the prospective population study of women in GoteborgAm J Epidemiol200816768469118222934
- UmegakiHIimuroSKanekoTFactors associated with lower Mini Mental State Examination scores in elderly Japanese diabetes mellitus patientsNeurobiol Aging2008291022102617434648
- BarnesDECovinskyKEWhitmerRAPredicting risk of dementia in older adults: the late-life dementia risk indexNeurology20097317317919439724
- CherbuinNReglade-MeslinCKumarRRisk factors of transition from normal cognition to mild cognitive disorder: the PATH through Life StudyDement Geriatr Cogn Disord200928475519628940
- PetersRBeckettNGenevaMSociodemographic and lifestyle risk factors for incident dementia and cognitive decline in the HYVETAge Ageing20093852152719553357
- SabiaSNabiHKivimakiMHealth behaviors from early to late midlife as predictors of cognitive function: the Whitehall II studyAm J Epidemiol200917042843719574344
- YaffeKFioccoAJLindquistKPredictors of maintaining cognitive function in older adults: the Health ABC studyNeurology2009722029203519506226
- ChanKKChiuKCChuLWAssociation between alcohol consumption and cognitive impairment in Southern Chinese older adultsInt J Geriatr Psychiatry2010251272127921086537
- GarciaAMRamon-BouNPortaMIsolated and joint effects of tobacco and alcohol consumption on risk of Alzheimer’s diseaseJ Alzheimers Dis20102057758620164550
- LoboEDufouilCMarcosGIs there an association between low-to-moderate alcohol consumption and risk of cognitive decline?Am J Epidemiol201017270871620699263
- LopesMAFurtadoEFFerrioliEPrevalence of alcohol-related problems in an elderly population and their association with cognitive impairment and dementiaAlcohol Clin Exp Res20103472673320102571
- LuckTLuppaMBrielSMild cognitive impairment: incidence and risk factors: results of the Leipzig longitudinal study of the agedJ Am Geriatr Soc2010581903191020840461
- SmithKFlickerLDwyerAFactors associated with dementia in Aboriginal AustraliansAust N Z J Psychiatry20104488889320932202
- VirtaaJJJärvenpääTHeikkiläKMidlife alcohol consumption and later risk of cognitive impairment: a twin follow-up studyJ Alzheimers Dis20102293994820858964
- YenCHYehCJWangCCDeterminants of cognitive impairment over time among the elderly in Taiwan: results of the national longitudinal studyArch Gerontol Geriatr201050Suppl 1S53S5720171458
- Au YeungSLLeungGMChanWMModerate alcohol use and cognitive function in an elderly Chinese cohortJ Am Geriatr Soc20115917217421226695
- KimKWParkJHKimMHA nationwide survey on the prevalence of dementia and mild cognitive impairment in South KoreaJ Alzheimers Dis20112328129121178286
- RusanenMKivipeltoMQuesenberryCPHeavy smoking in midlife and long-term risk of Alzheimer disease and vascular dementiaArch Intern Med201117133333920975015
- WeyererSSchäufeleMWieseBCurrent alcohol consumption and its relationship to incident dementia: results from a 3-year follow-up study among primary care attenders aged 75 years and olderAge Ageing20114045646321367764
- GoldmanENajmanJMLifetime abstainers, current abstainers and imbibers: a methodological noteBr J Addict1984793093146595025
- O’MahonyJFDohertyBIntellectual impairment among recently abstinent alcohol abusersBr J Clin Psychol199635Pt 177838673037
- FillmoreKMGoldingJMGravesKLAlcohol consumption and mortality, I: Characteristics of drinking groupsAddiction1998931832039624721
- LeinoEVRomelsjöAShoemakerCAlcohol consumption and mortality, II: Studies of male populationsAddiction1998932052189624722
- FillmoreKMGoldingJMGravesKLAlcohol consumption and mortality, III: Studies of female populationsAddiction1998932192299624723
- McCallumJSimonsLASimonsJDelaying dementia and nursing home placement: the Dubbo study of elderly Australians over a 14-year follow-upAnn N Y Acad Sci2007111412112917986578
- HarwoodDGKalechsteinABarkerWWThe effect of alcohol and tobacco consumption, and apolipoprotein E genotype, on the age of onset in Alzheimer’s diseaseInt J Geriatr Psychiatry20102551151819750560
- BobakMRichardsMMalyutinaSAssociation between year of birth and cognitive functions in Russia and the Czech Republic: cross-sectional results of the HAPIEE studyNeuroepidemiology20093323123919641328
- FolsteinMFFolsteinSEMcHughPR“Mini-mental state”: a practical method for grading the cognitive state of patients for the clinicianJ Psychiatr Res1975121891981202204
- FolsteinMFolsteinSInvited reply to “The death knoll for the MMSE: has it outlived its purpose?”J Geriatr Psychiatry Neurol20102315815920688970
- Nieuwenhuis-MarkREThe death knoll for the MMSE: has it outlived its purpose?J Geriatr Psychiatry Neurol20102315115720231732
- MitchellAJA meta-analysis of the accuracy of the mini-mental state examination in the detection of dementia and mild cognitive impairmentJ Psychiatr Res20094341143118579155
- ScarmeasNSternYTangMXMediterranean diet and risk for Alzheimer’s diseaseAnn Neurol20065991292116622828
- GuYNievesJWSternYFood combination and Alzheimer disease risk: a protective dietArch Neurol20106769970620385883
- RoeCMXiongCMillerJPEducation and Alzheimer disease without dementia: support for the cognitive reserve hypothesisNeurology20076822322817224578
- ScarmeasNSternYCognitive reserve: implications for diagnosis and prevention of Alzheimer’s diseaseCurr Neurol Neurosci Rep2004437438015324603
- MukamalKJChiuveSERimmEBAlcohol consumption and risk for coronary heart disease in men with healthy lifestylesArch Intern Med20061662145215017060546
- KnoopsKTde GrootLCKromhoutDMediterranean diet, lifestyle factors, and 10-year mortality in elderly European men and women: the HALE projectJAMA20042921433143915383513
- ImhofAWoodwardMDoeringAOverall alcohol intake, beer, wine, and systemic markers of inflammation in western Europe: results from three MONICA samples (Augsburg, Glasgow, Lille)Eur Heart J2004252092210015571824
- BrittonAMarmotMGShipleyMWho benefits most from the cardioprotective properties of alcohol consumption: health freaks or couch potatoes?J Epidemiol Community Health20086290590818791048
- FrenchMTZavalaSKThe health benefits of moderate drinking revisited: alcohol use and self-reported health statusAm J Health Promot20072148449117674634
- KarlamanglaASSarkisianCAKadoDMLight to moderate alcohol consumption and disability: variable benefits by health statusAm J Epidemiol20091699610419022829
- TienHCTremblayLNRizoliSBAssociation between alcohol and mortality in patients with severe traumatic head injuryArch Surg200614111851191 discussion 1192.17178960
- DaviglusMLBellCCBerrettiniWNational Institutes of Health State-of-the-Science Conference statement: preventing Alzheimer disease and cognitive declineAnn Intern Med201015317618120547888
- GunzerathLFadenVZakhariSNational Institute on Alcohol Abuse and Alcoholism report on moderate drinkingAlcohol Clin Exp Res20042882984715201626