Abstract
Background
In astigmatism clinical trials where more complex measurements are common, especially in nonrandomized small sized clinical trials, there is a demand for the development and application of newer statistical methods.
Methods
The source data belonged to a project on astigmatism treatment. Data were used regarding a total of 296 eyes undergoing different astigmatism treatment modalities: wavefront-guided photorefractive keratectomy, cross-cylinder photorefractive keratectomy, and monotoric (single) photorefractive keratectomy. Astigmatism analysis was primarily done using the Alpins method. Prior to fitting partial least squares regression discriminant analysis, a preliminary principal component analysis was done for data overview. Through fitting the partial least squares regression discriminant analysis statistical method, various model validity and predictability measures were assessed.
Results
The model found the patients treated by the wavefront method to be different from the two other treatments both in baseline and outcome measures. Also, the model found that patients treated with the cross-cylinder method versus the single method didn’t appear to be different from each other. This analysis provided an opportunity to compare the three methods while including a substantial number of baseline and outcome variables.
Conclusion
Partial least squares regression discriminant analysis had applicability for the statistical analysis of astigmatism clinical trials and it may be used as an adjunct or alternative analysis method in small sized clinical trials.
Introduction
Analysis of small-sized clinical trials may be a challenge to researchers in the field. The classical regression models may become problematic when there are large numbers of variables and a small sample size.Citation1 These methods assume statistical independence of x-variables and their complete relevance. This may not be the case in some ophthalmologic clinical trials. Multicollinearity and missing values are another field of concern using classical multivariate analysis methods like linear regression. In astigmatism clinical trials where more complex measurements are common, especially in nonrandomized small sized clinical trials, there is a demand for the development and application of newer statistical methods to improve the statistical power as well as validity of analysis methodology. Such methods may be investigated for their applicability either as an alternative or complementary method to classical statistical methods of data analysis. Limited attention is paid to this aspect of astigmatism research in the literature. Earlier versions of partial least squares regression (PLS) was presented back in 1975 by Wold et al in order to model complicated datasets in terms of chains of matrices that was later modified by other researchers.Citation2 PLS discriminant analysis (PLS-DA) and orthogonal projections to latent structures (OPLS) are later methodologies indicating their capacity to be used in the analysis of studies that investigate how different the patients treated with different methods may be, as in clinical trials, or the subjects developing different outcomes as in case-control studies.Citation3–Citation6 Regardless of their origin in social science or chemometrics, use of such methods is extending towards other areas of medical research. Little is known about the applicability of PLS or PLS-based methods for the analysis of astigmatism clinical trials. The research question in this study was whether these models can be used for discriminant analysis in astigmatism clinical trials.
Methods
Basics of PLS statistical methodology
Considering the journal audience, some basic knowledge is provided about PLS statistical methodology. PLS is generally a methodology based on formation of latent variables out of the original variable and extracting principal components. For those less acquainted with these methods, let’s start with the principal component analysis (PCA). PCA involves a mathematical procedure that transforms a number of possibly correlated variables into a smaller number of uncorrelated variables (latent variables) called principal components. There are usually two objectives sought by PCA: (1) to discover or to reduce the dimensionality of the data set, and (2) to identify new meaningful underlying variables.
Statistically, PCA finds lines, planes, and hyperplanes in the k-dimensional space that approximate the data as well as possible in the least squares sense. It is easy to see that a line or plane that is the least squares approximation of a set of data points makes the variance of the coordinates on the line or plane as large as possible. PLS is a regression extension of PCA, which is used to connect the information in two blocks of variables (x and y) to each other. PLS provides many model parameters and other residuals-based diagnostic tools, which are useful for understanding and interpreting the acquired regression model. PLS can be seen as a particular regression technique for modeling the association between x and y. The first PLS component is a line in x-space and another line in y-space. These two lines are calculated in a way to accurately approximate the point swarms in x and y. The lines intersect with the average points, and by projecting the observations onto them, the scores of t1 and u1 are obtained for x and y, respectively. For those with lower statistical knowledge who are interested to learn the details of statistical methodology, references that include easy-to-understand materials and figures are recommended for further reading.Citation1,Citation7,Citation8
Source data
The source data belonged to a project on astigmatism treatment in Nikoukari Ophthalmology University Hospital (Tabriz, Iran). Some of these data come from studies published or accepted to be published in Clinical Ophthalmology (New Zealand) and Clinical and Experimental Ophthalmology (Australia). Data regarding a total of 296 eyes undergoing different astigmatism treatment modalities were used.
Patients with stable refraction having medium-high astigmatism were enrolled to undergo any of the three treatment methods:
Wavefront-guided photorefractive keratectomy using the VISX® system (VISX Inc, Santa Clara, CA). VISX wavefront software version 3.67.2006.1107 was used. The method was applied for 200 eyes.
Photorefractive keratectomy by cross-cylinder method using Nidek EC-5000 (Nidek Co, Ltd, Gamagori, Japan) excimer laser with repetition rate of 40 Hz and software version 1.26 W. The method was applied for 48 eyes.
Monotoric (single) photorefractive keratectomy using Nidek EC-5000. The method was applied for treating 48 eyes.
All surgeries were performed by one surgeon (MRS) at Tabriz Excimer Laser Center (Tabriz, Iran).
Premodeling analysis
Data were primarily analyzed using Stata® version 11 (StataCorp LP, College Station, TX). Simple descriptive statistics were produced. Considering the characteristics of astigmatism treatment, vector analysis was performed. The surgically-induced astigmatism (SIA) vector, target-induced astigmatism (TIA) vector, astigmatic correction index (CI), index of success (IOS), angle of error, magnitude of error, flattening effect (FE), and flattening index were analyzed using methods described by Alpins.Citation9,Citation10 SIA is the vector of the astigmatic change actually induced by the surgery. TIA is the vector of the astigmatic change intended to be induced by the surgery. CI, preferably equal to 1.0, is the ratio of SIA to TIA. CI > 1.0 and CI < 1.0 indicate an overcorrection and undercorrection, respectively. A preestablished nomogram was used.
Difference vector (DV) is the magnitude and axis of astigmatic change that would enable the initial surgery to achieve its intended target. DV is an absolute measure of success and is preferably equal to zero. IOS is calculated by dividing DV by TIA. IOS is a relative measure of success and is preferably equal to zero. A CI of 1.0 and an IOS of zero indicate obtaining the desired results. The magnitude of error is the difference between the magnitude of SIA and TIA. The angle of error is the difference between the angles of SIA and TIA. FE is the amount of astigmatism reduction achieved by the effective proportion of SIA at the intended meridian (FE = SIA Cos2* angle of error). The flattening index, which preferably equals 1.0, is obtained by dividing FE by TIA. Higher order aberrations including coma, trefoil, and spherical aberrations were measured using the OPD Scan Wavefront Aberrometer (NIDEK). For details on definitions and methods, please refer to the main sources cited here.Citation9–Citation11
PLS-DA modeling procedure
The main model developments assessing procedure are:
Preprocessing the data by checking for the distributions, unit variance scaling, and mean centering.
For those variables which were far from normal distribution, log transformation was applied to reshape the value distribution and improve modeling procedure. DV, CI, and IOS were among the variables log transformed.
Prior to fitting PLS-DA, a preliminary PCA was done for data overview.
To provide a measure of statistical significance for the predictive power in cross-validation, response permutation was used. In this process, the x-data were left intact while the y-data were permuted to appear in a different order. The model was then fitted to the permuted y-data, and by using cross-validation, R2Y and Q2Y were computed for the derived model.
A validation plot was drawn after 20 permutations to investigate how likely it was for the model to be spurious.
Leverage was assessed using Hottelling’s T-squared distribution to which it is proportional.
Outliers were assessed using tolerance ellipse in a scores scatter plot, Hottelling’s T-squared range plot, and residual plot.
Model significance testing was done using analysis of variance of cross-validated residuals methodology.
Residual distribution graphs were plotted.
For presentation of the discriminant analysis in comparing the three astigmatism treatment methods, a scores scatter plot, loadings scatter plot, and mainly the coefficients plot and list were used. The regression coefficients were centered and scaled and presented along with their 95% confidence intervals.
Ethics
The regional committee of ethics approved the research protocol and written informed consent was obtained from all the participants. The main ethical items important in the ethics of clinical trials were taken into account.
Results
Some descriptive results
Mean age of the participants was 27.5 years. About 71% of the participants were female. Although females had a slightly lower proportion in the wavefront group, the difference was not statistically different. Main ophthalmologic measures of treatment are compared for the three treatment modalities in .
Table 1 Main ophthalmologic measures of treatment are compared for the three treatment modalities
Modeling results
The PLS-DA to distinguish patients treated with the three different methods was fitted yielding cumulative R2Y (fraction of y-variation modeled in the component) and Q2 (overall cross-validated R2Y for the component) values to be equal to 0.38 and 0.36, respectively. The overall model was found to be significant based on the analysis of variance of cross-validated residuals test results. Hottelling’s T-squared range plot found very few observations above the critical range (). The existence of strong outliers was investigated using a scores scatter plot and two strong outliers were distinguished and excluded from the final model (). Only one component was extracted to predict membership probability in each of the three treatment groups.
Figure 1 Hottelling’s T-squared range plot of the partial least squares regression discriminant analysis model to separate three types of astigmatism treatments.
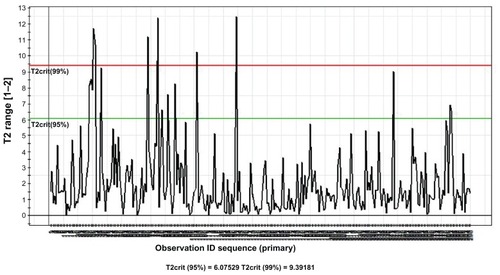
Figure 2 Scores scatter plot for partial least squares regression discriminant analysis to separate three types of astigmatism treatments.
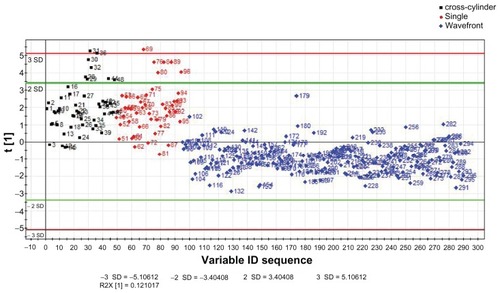
As can be found in the scores scatter plot, the model could successfully discriminate the wavefront method (blue color) from the two other treatment methods. However, the model was not able to separate the cross-cylinder method (black color) from the single method (red color) in regards to the measured variables of interest including baseline measures and outcome variables such as CI or IOS. The higher homogeneity among patients treated with the wavefront technique can be clearly seen in .
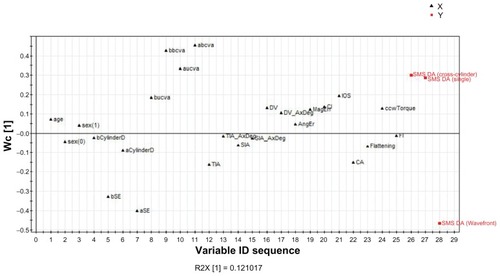
The associations among the variables in discriminant analysis of the three classes can be assessed through the loadings plot in . The figure shows how close the cross-cylinder and single methods versus the wavefront method are in treating the astigmatism.
Figure 3 Loadings plot of the partial least squares regression discriminant analysis model to compare the three astigmatism treatment methods.
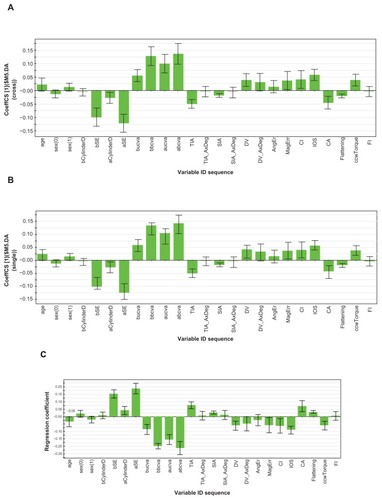
The model found the patients treated by the wavefront method to be different from the two other treatments both in baseline and outcome measures. The regression coefficients of class membership for each of the three therapeutic modalities are given in along with the 95% confidence intervals of the scaled and centered regression coefficients. As can be found in this figure, the most significant coefficients were similar for the cross-cylinder and single methods, but different for the wavefront method. Astigmatic CI, IOS, and DV were among the important significant outcome measures.
Figure 4 Plot of coefficients of variables predicting the class membership for the three astigmatism treatment methods: (A) cross-cylinder, (B) single method, (C) wavefront.
Abbreviations: bSE, spherical equivalent (before treatment); aSE, spherical equivalent (after treatment); bUCVA, uncorrected visual acuity (before treatment); aUCVA, uncorrected visual acuity (after treatment); bBCVA, best corrected visual acuity (before treatment); aBCVA, best corrected visual acuity (after treatment); TIA, target induced astigmatism; TIA_AxDeg, target induced astigmatism axis in degrees; SIA, surgically-induced astigmatism; SIA AxDeg, surgically-induced astigmatism axis in degrees; DV, difference vector; AngEr, angle of error; MagErr, magnitude of error; CI, correction index; IOS, index of success; CA, coefficient of adjustment; FI, flattening index.
Regarding the predictability of the PLS-DA model, the misclassification ratio was calculated and tested. Accepting the cross-cylinder and single methods to be similar, the correct classification ratio was calculated to be 87%. This means that only 13% of the patients were wrongly predicted by the models not to be in their real group.
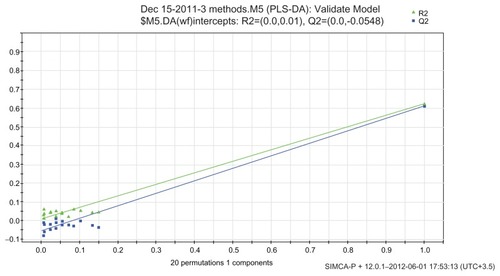
Regarding the model validity, the cross-validation plot in , which was plotted after 20 permutations, shows that both the blue and green regression lines of the Q2 and R2 points intersect the vertical axis at, or below, zero. This was indicative of the validity of the original model.
Figure 5 Validation plot to assess the validity of the fitted partial least squares regression discriminant analysis model for discriminant analysis of three astigmatism treatment modalities.
Discussion
Alpins in presentation of his methodology states that:
This method recognizes the need to define an astigmatism goal, allowing the surgeon to obtain precise, separate measures of the magnitude and the angle of surgical error. From this, the surgeon can evaluate what surgery may be required to achieve the initial preoperative goal.Citation10
Such valuable methodology helps to overcome concerns in assessing the effect of astigmatism treatment at an individual level. However, as indicated by Alpins, the methodology provides the input for applying statistical methods in inferential statistics to compare various methods through the comparison of groups of patients treated in different ways. Perhaps in analyzing the strictly controlled large-scale randomized clinical trials, simple bivariate statistical methods will suffice if the researcher can define an a priori primary outcome. However, this may not be the common practice in astigmatism research. As partly seen in the current study, there may be many situations in which such assumptions do not hold. Such that results are compared when there are different experimental studies, different designs (eg, mixing results from randomized and nonrandomized trials), correlated data especially in complex forms (eg, in some patients only one eye being enrolled and in some patients both eyes being enrolled), the need to control for the multiple number of confounders and cofactors, multiple outcome measures not clearly prioritized, and moderate amounts of missing values. Development of newer methods or assessment of the applicability of available advanced methodologies, possibly capable of managing such problems, could be a field of research interest in ophthalmology that is partly addressed in the current study. The PLS-DA model found the patients treated by the wavefront method to be different from the two other treatments both in baseline and outcome measures. Also, the model found that the patients treated by the cross-cylinder method versus the single method didn’t appear to be different from each other. This analysis put forward an opportunity to compare the three methods while including a substantial number of baseline and outcome variables. However, bivariate comparisons are often subject to confounding especially in nonrandomized clinical trials or small sized randomized clinical trials. Lower statistical power and possibility of multicollinearity are also the main concerns of classical multivariate regression analysis methods used when larger number of variables are to be modeled with a small sample size. Multicollinearity not only increases standard errors of regression coefficients and decreases power, but also makes it difficult to separate individual effects of predictor variables making the regression coefficients less reliable.Citation12 PLS is a methodology that copes well with some major problems in traditional statistical methods, and is also shown to yield higher statistical power of study.Citation1,Citation8,Citation13,Citation14 However, a major disadvantage of PLS methodology is that sometimes it leads to complex models with substantial numbers of components. Alternative methodologies such as OPLS have been developed to overcome this drawback and improve the interpretability of PLS models. Citation1,Citation6 Nevertheless, in models with very few PLS components, there may be no need for the use of OPLS methodology. In the current study, the PLS-DA model was so parsimonious regarding the number of components that the use of any other modeling technique to cope with multiple components was not considered. However, it cannot be guaranteed that it will be parsimonious for other astigmatism clinical trials in future. Therefore, in case of model interpretability problems, the use of OPLS is recommended.
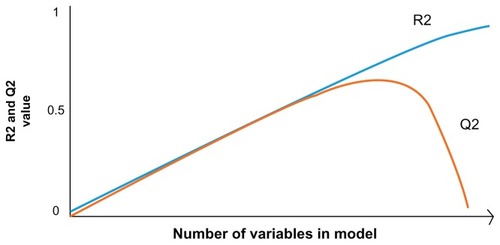
The validity and goodness of fit of modeling techniques are always considered a major concern in statistics. As found in this study, a wide range of techniques have been used to assess the fitted models. In this study, while doing the PLS model, the model goodness of fit was jointly assessed using R2 and Q2. R2 is an inflationary measure and rapidly approaches unity as the model complexity increases; Q2 is recommended to be used for the primary assessment of model predictability. As can be found in , Q2 is not inflationary and doesn’t approach the maximum value of 1.0 with increased model complexity. Q2Y also increases with increasing model complexity; however, at a certain degree of complexity, predictive ability doesn’t improve any further. Therefore, the combined assessment of R2 and Q2 is kind of a cross-validation and a trade-off between fit and predictive ability.
Figure 6 Pattern of change in R2 compared to Q2, with increasing model complexity (X-axis).
A validation plot was also used in the modeling procedure. A validation plot helps to assess the likelihood of building a spurious model. The plot shows, for a selected y-variable, on the vertical axis the values of R2 and Q2 for the original model at the right hand of the plot and of the y-permuted models to the left. The horizontal axis shows the correlation between the permuted y-vectors and the original y-vector for the selected y. The depicted plot strongly indicates that the original model was valid. The criteria for validity are recommended to be considered as “all blue Q2-values to the left to be lower than the original points to the right or the blue regression line of the Q2-points to intersect the vertical axis at, or below, zero.”Citation1,Citation15
Conclusion
When taking into account all variables of interest to compare the three astigmatism treatment modalities, the patients treated by the cross-cylinder method versus the single method didn’t appear to be different from each other, but they were largely distinguishable from those treated by the wavefront procedure. PLS-DA appeared to have applicability for the statistical analysis of astigmatism clinical trials and it may be used as an adjunct or alternative analysis method in small sized clinical trials. However, its stronger recommendation can only be supported after investigating its behavior and external validity in consistent future research.
Disclosure
The authors report no conflicts of interest in this work.
References
- ErikssonLJohanssonEKettaneh-WoldNTryggJWikstromCWoldSMultivariate and Megavariate Data Analysis: Advanced Applications and Method ExtensionsUmeaUmetrics AB2006
- WoldSSjornMErikssonLPLS-regression: a basic tool of chemometricsChemom Intell Lab Syst2001582109130
- BylesjoMRantalainenMCloarecONicholsonJKHolmesETryggJOPLS discriminant analysis: combining the strengths of PLS-DA and SIMCA classificationJ Chemom2006208–10341351
- Sadeghi-BazarganiHMehdizadehRFathiKSavadi-OskoueiDFarhoudiMApplication of PLS and OPLS modeling techniques to study the possible predictors of stroke prognosis after six monthsPaper presented at: Seventh International Triennial Calcutta Symposium on Probability and StatisticsDecember 28–31, 2009Calcutta, India
- Sadeghi-BazarganiHBangdiwalaSIMohammadKMaghsoudiHMohammadiRCompared application of the new OPLS-DA statistical model versus partial least squares regression to manage large numbers of variables in an injury case-control studySci Res Essays201162043694377
- TryggJWoldSOrthogonal projections to latent structures (O-PLS)J Chemom2002163119128
- Sadeghi-BazarganiHEpidemiology and Statistical Modeling in Burn InjuriesStockholmKarolinska Institute Publications2011
- Sadeghi-BazarganiHBangdiwalaSIMohmmadiRApplicability of new supervised statistical models to assess burn injury patterns, outcomes, and their interrelationshipAnn Burns Fire Disasters201124419119822639562
- AlpinsNAstigmatism analysis by the Alpins methodJ Cataract Refract Surg2001271314911165856
- AlpinsNAA new method of analyzing vectors for changes in astigmatismJ Cataract Refract Surg19931945245338355160
- SedghipourMSorkhabiRMostafaeiAWavefront-guided versus cross-cylinder photorefractive keratectomy in moderate-to-high astigmatism: a cohort of two consecutive clinical trialsClin Ophthalmol2012619920422331978
- DohooIRDucrotCFourichonCDonaldAHurnikDAn overview of techniques for dealing with large numbers of independent variables in epidemiologic studiesPrev Vet Med19972932212399234406
- FathiKSadeghi-BazarganiHMehdizadehRSavadi-OskoueiDFarhoudiMSonographic predictors of stroke prognosis: application of OPLS statistical modeling compared to linear regressionNeuropsychiatr Dis Treat2012838739222973104
- McIntoshARChauWKProtznerABSpatiotemporal analysis of event-related fMRI data using partial least squaresNeuroimage200423276477515488426
- Sadeghi-BazarganiHMohammadiSBananiAUsing SIMCA statistical software package to apply orthogonal projections to latent structures modelingPaper presented at: World Automation CongressSeptember 19–23, 2010Kobe, Japan