
Abstract
Purpose
To investigate epithelial thickness-distribution characteristics in a large group of keratoconic patients and their correlation to normal eyes employing anterior-segment optical coherence tomography (AS-OCT).
Materials and methods
The study group (n=160 eyes) consisted of clinically diagnosed keratoconus eyes; the control group (n=160) consisted of nonkeratoconic eyes. Three separate, three-dimensional epithelial thickness maps were obtained employing AS-OCT, enabling investigation of the pupil center, average, mid-peripheral, superior, inferior, maximum, minimum, and topographic epithelial thickness variability. Intraindividual repeatability of measurements was assessed. We introduced correlation of the epithelial data via newly defined indices. The epithelial thickness indices were then correlated with two Scheimpflug imaging-derived AS-irregularity indices: the index of height decentration, and the index of surface variance highly sensitive to early and advancing keratoconus diagnosis as validation.
Results
Intraindividual repeatability of epithelial thickness measurement in the keratoconic group was on average 1.67 μm. For the control group, repeatability was on average 1.13 μm. In the keratoconic group, pupil-center epithelial thickness was 51.75±7.02 μm, while maximum and minimum epithelial thickness were 63.54±8.85 μm and 40.73±8.51 μm. In the control group, epithelial thickness at the center was 52.54±3.23 μm, with maximum 55.33±3.27 μm and minimum 48.50±3.98 μm epithelial thickness. Topographic variability was 6.07±3.55 μm in the keratoconic group, while for the control group it was 1.59±0.79 μm. In keratoconus, topographic epithelial thickness change from normal, correlated tightly with the topometric asymmetry indices of IHD and ISV derived from Scheimpflug imaging.
Conclusion
Simple, OCT-derived epithelial mapping, appears to have critical potential in early and advancing keratoconus diagnosis, confirmed with its correlation with established Scheimpflug-derived asymmetry topometric indices.
Keywords:
Introduction
There is an increasing awareness pertaining to epithelial thickness characteristics in keratoconus (KCN).Citation1–Citation3 Specifically, overall corneal epithelial thickness,Citation4,Citation5 as well as epithelial thickness topographic variability, may serve as diagnostic elements, in synergy with other topographic and Scheimpflug tomographic screening indicators, such as irregular corneal thicknessCitation6,Citation7 and anterior-surface topographic variability.Citation8,Citation9
In addition, the corneal epithelial layer-thickness distribution can be very useful in clinicalCitation10 as well as in basic research.Citation11,Citation12 We have introducedCitation10 and reportedCitation13 a potentially novel epithelial clinical indicator for biomechanical corneal instability in keratoconus (KCN) as a criterion demonstrating increased overall corneal epithelial thickness. We have thus proposed this simple clinical parameter as an early keratectasia diagnostic marker.
The recent popularity of clinical in-vivo epithelial mapping by anterior-segment optical coherence tomography (AS-OCT) presents a new and potentially more practical tool, with the speed of optical imaging and noncontact-mode ease of use compared to the previous gold standard for epithelial imaging, high frequency ultrasound.Citation14–Citation16
This work aims to investigate three-dimensional epithelial layer thickness characteristics in a large pool of keratoconic patients via clinically available AS-OCT. Keratoconic investigation and severity stratification was facilitated by Scheimpflug imaging; OCT-derived epithelial thickness characteristics were correlated on one-to-one basis with Scheimpflug-derived KCN classification and AS-irregularity indices, which have been previously identified and reported as robust indicators for KCN severity and progression.Citation8
Materials and methods
This comparative case-series study received approval by the ethics committee of our institution, adherent to the tenets of the Declaration of Helsinki. Informed written consent was obtained from each subject at the time of the first clinical visit.
Patient inclusion/exclusion criteria
Study group A (n=160 different eyes) consisted of cases with keratoconic eyes, confirmed by a complete ophthalmologic evaluation and corneal imaging, in which no previous surgery had been applied. KCN diagnosis was established by slit-lamp biomicroscopy for clinical signs of KCN, such as the pattern of opposing central and peripheral retinoscopic movements, the conical reflection on the nasal cornea under temporal lighting (Rizzutti’s sign), the Fleischer ring, “iron deposits” within the epithelium near the cone base, and finally the presence of Vogt’s striae.Citation17 The KCN diagnosis was further confirmed by the WaveLight® Oculyzer™ II (Alcon Surgical, Fort Worth, TX, USA) and a Pentacam High-Resolution Scheimpflug imaging camera (Oculus Optikgeräte, Wetzlar, Germany).Citation18 Quantitative data supporting the KCN diagnosis included keratometry >45.00 D and asymmetric topographic patterns. In addition to not having been subjected to any previous ocular intervention, for a patient to be included in study group A, the following criteria had to be met: absence of systemic disease, no history of chemical injury, or delayed epithelial healing.
The control group, B (n=160 different eyes), consisted of normal, healthy eyes, confirmed by a complete ophthalmologic evaluation and corneal imaging. While participants were randomly selected from the pool of screening patients, age and sex were considered in order to match study group A. Exclusion criteria for the control group (B) included current or past ocular pathology, previous surgery, present irritation, or dry-eye disorder, as well as contact lens wear.
Female patients with ongoing pregnancy or lactating at the time of the study were excluded from either group. In all cases, to minimize testing variations, OCT and Scheimpflug imaging were conducted by skilled trained investigators and preceded ocular clinical examination.
Sample-size determination
The sample size was established by the following parameters: estimated epithelial thickness variability (standard deviation), minimum spotted difference, significance criterion, and statistical power.Citation19 The epithelial thickness variability was established by a recent studyCitation20 to be in the order of 2.5 μm. The minimum spotted difference was 1 μm, while the significance criterion was set to 0.05 and the intended statistical power was set to 0.95. Based on these criteria, the total sample size was estimated to be n=320.
OCT epithelial imaging
The Fourier-domain AS-OCT system RTVue® 100 (Optovue, Fremont, CA, USA), running on analysis and report software version A6 (9.0.27), was employed in the study. Data output included total corneal and epithelial thickness maps corresponding to a 6 mm-diameter area. The settings were: L-Cam lens, eight meridional B scans per acquisition, consisting of 1,024 A scans each with 5 μm axial resolution. The main analysis report produced by the system displayed total corneal (reported as pachymetry) and epithelial three-dimensional thickness maps covering the 6 mm-diameter area, examples of which are provided in .
Figure 1 Total corneal (left) and epithelial (right) three-dimensional pachymetry maps. Top, a right eye with topographic variability of 8.4 μm and epithelial range of −28 μm, classified as KC2 (IHD =0.065, ISV =64); bottom, a right eye with topographic variability of 9.6 μm and epithelial range of −30 μm, classified as KC3 (IHD =0.107, ISV =104).
Abbreviations: IHD, index of height decentration; ISV, index of surface variance.
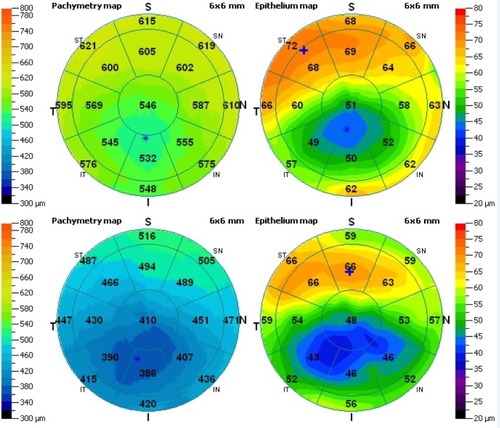
As shown in , each pachymetry map is divided in to 17 sectors. Specifically, these are the 2 mm-diameter pupil-center disk of 12.56 mm2 area, eight sectors (octants) within the annulus between the 2–5 mm zones, each of 8.24 mm2 area, and eight sectors (octants) within the annulus of 5–6 mm zones, each of 4.32 mm2 area. For each one of these sectors, the average thickness is displayed numerically over the corresponding area.
In our study, the reported “epithelium center” thickness corresponded to the numeric indication over the center disk. The superior, inferior, minimum, and maximum thickness, as well as the topographic thickness variability (computed by the epithelial thickness standard deviation of the 17 segments) were obtained directly by the statistics report. Epithelial thickness range, defined as the minimum minus the maximum epithelial thickness, was derived accordingly. Mean epithelial thickness was computed by the integer values of the seventeen octant numerical results, and the peripheral epithelial thickness was computed by the average of the thickness corresponding to eighteen equispaced points along the 5 mm radius (data collected via mouse-over indication on the epithelial thickness map). To assess intraindividual repeatability, three consecutive acquisitions per eye were performed. The standard deviation of the three respective values was reported as repeatability, while the mean of these values has been included in the study.
Scheimpflug imaging anterior-surface topometric indices
Scheimpflug imaging was employed to provide simulated keratometry (in diopters), topographic KCN classification (TKC), and AC-irregularity indices.Citation21 These data are offered, eg, by the “refractive” and “topometric” reports provided by the Pentacam software. Specifically, the TKC grading scheme comprised of the following stages, indicating not KCN, KC1, KC1–2, KC2, KC2–3, KC3, KC3–4, and KC4, indicating advancing stages of KCN, from the mildest to the most severe, respectively. To facilitate statistical analysis, we introduced a numeric conversion, ie, grade (−) was set to 0, KC1 to 1, KC1–2 to 2, KC2 to 3, KC2–3 to 4, KC3 to 5, KC3–4 to 6, and KC4 to 7, as was previously introduced.Citation22
The AS-irregularity indices investigated in the study were: index of surface variance (ISV), the value of the standard deviation of individual corneal sagittal radii from the mean curvature; and index of height decentration (IHD), the value of the decentration of elevation data in the vertical direction, calculated from a Fourier analysis. Both of these indices have been recently studied in screening, classification, and clinical follow-upCitation8,Citation18,Citation21,Citation23 of keratoconic patients, indicating a robust correlation with KCN severity.
To investigate further the possible correlation of OCT-derived epithelial thickness characteristics with Scheimpflug-derived KCN severity, two subgroups were formed from group A. Specifically, subgroup A1 (n=40) was formed from the cases whose KCN grading (TKC) was less or equal to KC1, while subgroup A2 (n=58) was formed from the advanced KCN cases (TKC equal to or greater than KC3).
Descriptive statistics, linear regression, analysis of variance to seek possible correlations, and analysis of variance between subgroups were performed by Minitab version 16.2.3 (Minitab, Coventry, UK) and Origin® version 9 (OriginLab, Northampton, MA, USA). Paired analysis P-values less than 0.05 were considered an indication of statistically significant results. Results are presented in the form of means ± standard deviation of the mean (minimum to maximum).
Results
The keratoconic study group (A) was formed from 160 eyes, of which 72 belonged to female and 88 belonged to male patients. The mean age of patients at the time of examination was 33.8±9.7 (18–60) years. There were 83 right (oculus dexter) and 77 left (oculus sinister) eyes. Average simulated keratometry for group A (KCN), as provided by the Scheimpflug imaging, was K1 (flat) 46.63±3.78 D, and K2 (steep) 50.86±5.14 D. Average TKC was between the KC2 and the KC2–3 stages. The AS-irregularity indices had the following values: IHD 0.076±0.055 (0.030–0.287) and ISV 82.8±47.7 (10–237).
The control group (B) was formed from 160 eyes, of which 70 belonged to female and 90 to male patients. The mean age of patients at the time of examination was 34.8±9.3 (18–59) years. There were 80 right and 80 left eyes. Average simulated keratometry for this control group, as provided by the Scheimpflug imaging, was K1 (flat) 42.78±1.33 D and K2 43.47±1.95 D. Average TKC was (−). The AS-irregularity indices had the following values: IHD 0.029±0.21 and ISV 31.78±22.61.
Repeatability and ease of OCT measurement
In all cases, following correct fixation and centering, OCT epithelial imaging-acquisition time was less than 0.5 second. No patient reported reservations or expressed discomfort regarding this noncontact measurement. Following acquisition, the epithelial thickness summary report was furnished in less than 1 minute.
Intraindividual repeatability for the epithelial thickness for the center, superior, inferior, maximum, minimum, and topographic thickness variability was evaluated by the standard deviation of four consecutive acquisitions in each case. As reported in , for study group A (keratoconic eyes), the epithelial thickness had an average repeatability for center 1.78±1.31 μm, superior 1.92±0.99 μm, inferior 1.58±1.01 μm, minimum 1.33±1.15 μm, maximum 1.72±1.30 μm, and topographic thickness variability 0.46±0.25 μm. For the control group (B, normal eyes), the epithelial thickness had an average repeatability for center 0.89±0.75 μm, superior 1.21±0.89 μm, inferior 0.73±0.67 μm, minimum 1.07±1.02 μm, maximum 1.73±1.05 μm, and topographic thickness variability 0.19±0.11 μm, respectively.
Table 1 Intraindividual-repeatability descriptive statistics for epithelial thickness, as computed by the standard deviation of the respective values obtained by four consecutive acquisitions per eye
Epithelial thickness statistical analysis
For study group A (keratoconic eyes), the center epithelial thickness was on average 51.75±7.02 (36–72) μm, with superior 55.57±6.79 (42–76) μm, inferior 49.65±5.54 (33–72) μm, minimum 40.73±8.51 (19–60) μm, maximum 63.54±8.85 (49–94) μm, mean 52.39±5.48 (43.50–70.33) μm, and mid-peripheral thickness 52.52±5.36 (43.60–70.00) μm. For the control group (B, healthy eyes), the center epithelial thickness was 52.54±3.23 (45–59) μm, with superior 51.35±3.41 (44–60) μm, inferior 53.13±3.27 (45–59) μm, minimum 48.50±3.98 (28–57) μm, maximum 55.33±3.67 (46–64) μm, mean 52.24±3.21 (44.58–59.42) μm, and mid-peripheral thickness 52.18±3.23 (44.50–59.50) μm. These results are reported in and are illustrated in the form of box plots in .
Figure 2 Box plots of epithelial thickness (showing center, superior, inferior, minimum, maximum, mean, and peripheral) showing median level (⊗), average (⊕), 95% median confidence, and interquartile interval range boxes. Top, keratoconic group; bottom, control group.
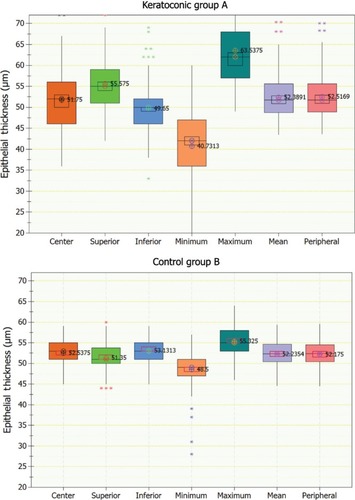
Table 2 Central epithelial thickness (center), superior, inferior, minimum, maximum, topographic thickness variability, range, mean, and peripheral for the two study groups (control and keratoconus [KCN])
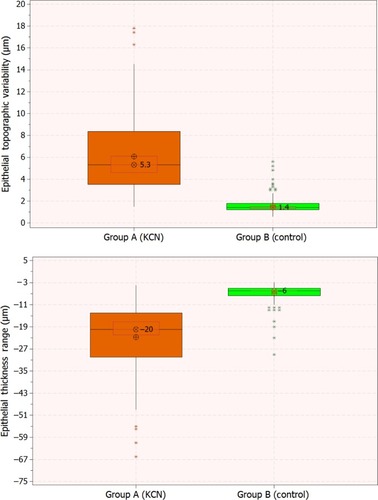
The epithelium was thinner in the center in the KCN group (−0.79 μm), while thicker overall (+0.15 μm) and mid-peripherally (+0.35 μm) in comparison to the control group (0.0760 and 0.0491, respectively; P=0.0199). The epithelium at the superior position (+4.22 μm) and maximum (+8.21 μm) was thicker, while the inferior (−3.48 μm) and minimum (−7.77 μm) were thinner in the KCN group in comparison to the control group (in all cases, P<0.01). More pronounced were the differences in topographic thickness variability (+4.48 μm) and range (−15.94 μm), both significant statistical differences (P<0.001). illustrates (in the form of box plots) epithelial thickness topographic variability and epithelial thickness range for the two groups. We note the negative sign in the thickness range, a result of the definition adopted by the AS-OCT software, which we preserved in this study for conformity.
Figure 3 Box plots of epithelial thickness topographic variability (top) and range, defined as minimum minus maximum (bottom) for the two groups. Graphs include median level (⊗), average (⊕), 95% median confidence, and interquartile interval range boxes.
Epithelial thickness in relation to keratoconus stage
We further investigated distribution characteristics within the two subgroups formed within study group A, namely the lower keratoconic stage A1 and the advanced-stage subgroup A2. The center epithelium was thicker in the lower keratoconic stage subgroup A1 (+0.36 μm, P=0.118) and thinner in the advanced-stage subgroup A2 (−1.93 μm, P=0.032) in comparison to the control group. Mean and peripheral epithelial thickness was also higher in the lower keratoconic subgroup A1 (+0.63 and +1.14 μm, P=0.045 and 0.021, respectively) in comparison to the control group. Detailed descriptive statistics are reported in .
The epithelial thickness topographic variability was 2.46±0.75 (−4 to −18) μm in the lower keratoconic stage subgroup A1 and 9.27±3.25 (−14 to −66) μm in the advanced-stage subgroup A2. The analysis between topographic variability for the control group (B), KCN group (A), and subgroups A1 and A2 indicated (P<0.01) that the means differed at the 0.05 level of significance. Similar results were obtained for the epithelial range: in the advanced KCN subgroup A2, the epithelial thickness range was −34.05±11.31 (−14 to −66) μm, in the entire KCN group −22.81±12.55 (−4 to −66) μm, and in the low KCN subgroup A1 −10.33±3.82 (−4 to −18) μm, while in the control group it was −6.86±3.33 (−3 to −29) μm (P<0.001).
Epithelial thickness topographic variability and range compared to Scheimpflug-derived anterior-surface irregularity indices
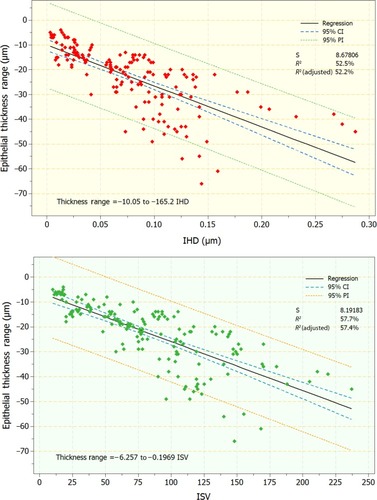
As indicated by the statistically significant differences observed in the topographic thickness variability and thickness range (difference of the minimum minus the maximum) in relation to the keratoconic severity, we further considered the one-to-one correlation of these two epithelial thickness topographic variables, obtained by OCT with two AS-irregularity indices, IHD and ISV, obtained by Scheimpflug imaging. Specifically, regression analysis was performed on the following pairs: epithelial thickness variability versus IHD and ISV, and epithelial thickness range versus IHD and ISV. Regression analysis indicated statistically significant relationships (P<0.01 in both pairs; coefficients of determination 0.58, 0.61, 0.53, and 0.58, respectively). Scatter and fitted-line plots for these relationships are illustrated in and .
Figure 4 Scatter and fitted-line plots of topographic epithelial thickness variability versus index of height decentration (IHD; top) and index of surface variance (ISV; bottom). Graphs include regression, 95% confidence interval (CI), and 95% prediction interval (PI) lines.
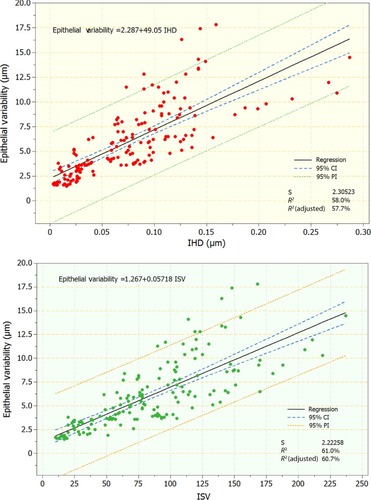
Figure 5 Scatter and fitted-line plots of topographic epithelial thickness range versus index of height decentration (IHD; top) and index of surface variance (ISV; bottom). Graphs include regression, 95% confidence interval (CI), and 95% prediction interval (PI) lines.
Discussion
Clinical in vivo epithelial mapping by AS-OCT is currently in practice, and introduces a simple and effective clinical tool for corneal epithelium mapping. The data are very easily obtained, and epithelial thickness parameters are automatically calculated by the system software report.Citation20,Citation24 The ease of use, as well as the reliable and predictable measurement, as indicated by the low intraindividual repeatability,Citation25 which was only slightly elevated in the keratoconic group (), suggest that epithelial imaging by AS-OCT holds promise for wider clinical application, such as screening of young adults for early KCN, and in a much wider perspective, potential candidates for laser cornea refractive surgery.
One may wonder what the clinical potential of epithelial thickness measurements might be and what this technology could accomplish that other imaging technologies in widespread use might not? One possibility lies in the fact that irregular epithelial thickness distribution can “compensate” for underlying irregular stromal distribution,Citation26,Citation27 and thus may mask topographic and tomographic results, particularly in early stage KCN investigation. We believe therefore that epithelial thickness imaging may be extremely helpful in KCN investigation by revealing the accentuated stromal irregularities that may not be detected by traditional corneal topography.
The comprehensive study presented herein not only confirms our previous findingsCitation10,Citation13 regarding increased overall epithelial thickness and variation in keratoconic eyes, and to a much lesser degree in less affected eyes, but also that the newly clinically available AS-OCT feature of in vivo epithelial imaging may illustrate these differences in a more reliable, repeatable, and quantitative way.
The epithelium in the keratoconic eye group presents with relatively increased overall levels and noticeably increased thickness variations (in simple terms, not only choppy waters, but high tide as well). Specifically, the defining qualitative feature of the epithelium in the keratoconic group was the pattern of thin epithelium over the cone (corresponding to the thinnest cornea, ), typically in the temporal/inferior area, while a thicker epithelium appears in the superior/nasal area, away from the cone. It is noteworthy that in the normal population (group B in this study), and also extensively presented in Kanellopoulos and Asimellis,Citation20 the superior epithelium was thinner superiorly than inferiorly; the opposite held true in the keratoconic group (, ). These thickness irregularities are pronounced with increasing severity of KCN.
Quantitatively, these differences can be expressed by the epithelial minimum being on average −7.77 μm and inferior −3.48 μm thinner in the keratoconic group, while maximum and superior thickness were thicker by +8.21 μm and +4.22 μm in the keratoconic group, in comparison to the controls. This pattern is in agreement with previous results obtained with high-frequency ultrasound biomicroscopyCitation1,Citation10 and OCT.Citation13,Citation15
Overall epithelial thickness variability as well as thickness range appear even more significant. For example, in the keratoconic group, thickness variability (+4.48 μm, or 380% more) and range (−15.94 μm, or 332% more) increased a large margin and were statistically significant compared to the control group (), in agreement with a previous study.Citation2 More importantly, these indices, derived by clinical OCT imaging, were well correlated with established KCN indices, such as the Pentacam-derived topographic AS-irregularity indices of ISV and IHD ( and ). Such a comparison has not been previously reported in the peer-reviewed literature in kind or in scale, and in our opinion presents a novel, specific, and sensitive tool for the clinician.
Although not documented yet, epithelium depiction with AS-OCT probably represents longer-term remodeling associated with KCN, and not a temporary effect due to recent eye rubbing. It could be the irregular corneal shape and thickness (although normalization of the epithelium following corneal cross-linking treatment minimizes the influence of this theory), as has been introduced by our team.Citation7 It could be related to eye rubbing, although regular stability of the epithelial maps through long-term investigation also minimized the potential influence of this theory. Finally, it appears that the specific epithelial pattern that is encountered in keratoconic eyes is directly related to the degree of biomechanical instability, and thus it may be linked to partial deformation of the cornea associated with blinking and eye rubbing, but more importantly we feel that normal oscillation of the cornea due to lateral and vertical oscillation of the eye and its possible inertia effect on the corneal biomechanics, during normal binocular fixation, reaching the astounding speeds of 900 degrees/sec.Citation28,Citation29 Additionally possibly due to the fluid pulse wave reaching the cornea posteriorly through aqueous conduction and deriving from the arterial ventricular human heart pulse wave.Citation10 Partial “normalization” of the epithelial pattern following collagen cross-linking further supports this theory. The comprehensive investigation of epithelial thickness by AS-OCT in this work suggests high predictability of measurement in KCN patients. Our previously reported finding of overall epithelial thickness in keratoconic eyes in comparison to normal when studied with high frequency ultrasound, has been confirmed with this technology as well. Of particular diagnostic interest is the relation of this finding to lower/earlier stages of keratoconus or even preclinical keratoconus manifestation. The increase in topographic thickness variability and range, easily captured by the device studied, has been identified to be in very close correlation with severity of keratoconus. Additionally the OCT-derived epithelial topographic thickness variability and epithelial thickness range correlate remarkably with established Scheimpflug imaging-derived anterior surface-irregularity indices for keratoconus. Again of particular clinical significance, the interest would be this relation in lower/earlier keratoconus stages, or even when evaluating the fellow “healthy” unaffected cornea of a keratconus patient, especially of younger age.
Conclusion
Corneal collagen crosslinking has changed the therapeutic paradigm for keratoconus and ectasia, dictating vigorous work on the side of the clinician on early diagnosis and more sensitive progression detection. As cornea imaging modalities multiply, early detection and sensitive progression monitoring appears to redefine the traditional metrics used up until now. Epithelial imaging has been probably greatly ignored up until recently, due to mainly the technical difficulty of its imaging capture, may become an easy and important clinical tool with the help of OCT.
Author contributions
Design of the study (AJK); data collection (AJK), management (AJK), analysis (AJK, GA), interpretation of the data (AJK, GA); manuscript preparation (AJK, GA), manuscript critical revision (AJK, GA), manuscript approval (AJK).
Disclosure
AJK holds consultant/advisory positions at Alcon/WaveLight, Avedro, i-Optics, Allergan and Keramed. GA reports no conflicts of interest in this work.
References
- ReinsteinDZGobbeMArcherTJSilvermanRHColemanDJEpithelial, stromal, and corneal thickness in keratoconus: three-dimensional display with Artemis very-high frequency digital ultrasoundJ Refract Surg201026425927120415322
- LiYTanOBrassRWeissJLHuangDCorneal epithelial thickness mapping by Fourier-domain optical coherence tomography in normal and keratoconic eyesOphthalmology2012119122425243322917888
- ZhouWStojanovicAComparison of corneal epithelial and stromal thickness distributions between eyes with keratoconus and healthy eyes with corneal astigmatism ≥2.0 DPLoS One201491e8599424489687
- SandaliOEl SanharawiMTemstetCFourier-domain optical coherence tomography imaging in keratoconus: a corneal structural classificationOphthalmology2013120122403241223932599
- PöltnerGMillerKBerkeASickenbergerWMeasuring of corneal thickness of contact lens wearers with keratoconus and keratoplasty by means of optical coherence tomography (OCT)Coll Antropol201337Suppl 116517323837239
- DuttaDRaoHLAddepalliUKVaddavalliPKCorneal thickness in keratoconus: comparing optical, ultrasound, and optical coherence tomography pachymetryOphthalmology2013120345746323177363
- KanellopoulosAJChiridouMAsimellisGOptical coherence tomography-derived corneal thickness asymmetry indices: clinical reference study in 561 normal eyesJ Cataract Refract Surg201440101603160925176051
- KanellopoulosAJAsimellisGRevisiting keratoconus diagnosis and progression classification based on evaluation of corneal asymmetry indices, derived from Scheimpflug imaging in keratoconic and suspect casesClin Ophthalmol201371539154823935360
- PiñeroDPNietoJCLopez-MiguelACharacterization of corneal structure in keratoconusJ Cataract Refract Surg201238122167218323195256
- KanellopoulosAJAslanidesIAsimellisGCorrelation between epithelial thickness in normal corneas, untreated ectatic corneas, and ectatic corneas previously treated with CXL; is overall epithelial thickness a very early ectasia prognostic factor?Clin Ophthalmol2012678980022701079
- AkarAKarayiğitMÖBolatDGültikenMEYarimMCastellaniGEffects of low level electromagnetic field exposure at 2.45 GHz on rat corneaInt J Radiat Biol201389424324923206266
- SunLXWangZYangBLiuJQiuPChenJQProliferation of corneal epithelium and apoptosis of keratocytes in the rabbit cornea after treatment with 20% ethanolZhonghua Yan Ke Za Zhi2005416492497 Chinese16008907
- KanellopoulosAJAsimellisGAnterior segment optical coherence tomography: assisted topographic corneal epithelial thickness distribution imaging of a keratoconus patientCase Rep Ophthalmol201341747823687500
- PotsaidBBaumannBHuangDUltrahigh speed 1,050 nm swept source/Fourier domain OCT retinal and anterior segment imaging at 100,000 to 400,000 axial scans per secondOpt Express20101819200292004820940894
- RochaKMPerez-StraziotaCEStultingRDRandlemanJBSD-OCT analysis of regional epithelial thickness profiles in keratoconus, postoperative corneal ectasia, and normal eyesJ Refract Surg201329317317923446013
- GeLYuanYShenMTaoAWangJLuFThe role of axial resolution of optical coherence tomography on the measurement of corneal and epithelial thicknessesInvest Ophthalmol Vis Sci201354174675523139281
- RabinowitzYSKeratoconusSurv Ophthalmol19984242973199493273
- KanellopoulosAJAsimellisGComparison of Placido disc and Scheimpflug image-derived topography-guided excimer laser surface normalization combined with higher fluence CXL: the Athens Protocol, in progressive keratoconusClin Ophthalmol201371385139623901251
- EngJSample size estimation: how many individuals should be studied?Radiology2003227230931312732691
- KanellopoulosAJAsimellisGIn vivo three-dimensional epithelial imaging of corneal epithelium in normal eyes by anterior segment optical coherence tomography: a clinical reference studyCornea201332111493149824042485
- Faria-CorreiaFRamosICLopesBTTopometric and tomographic indices for the diagnosis of keratoconusInt J Keratoconus Ectatic Corneal Dis201212100106
- KanellopoulosAJMoustouVAsimellisGEvaluation of visual acuity, pachymetry and anterior-surface irregularity in keratoconus and crosslinking intervention follow-up in 737 casesInt J Keratoconus Ectatic Corneal Dis20132395103
- KanellopoulosAJAsimellisGKeratoconus management: long-term stability of topography-guided normalization combined with high-fluence CXL stabilization (the Athens Protocol)J Refract Surg2014302889324763473
- KanellopoulosAJAsimellisGIn vivo 3-dimensional corneal epithelial thickness mapping as an indicator of dry eye: preliminary clinical assessmentAm J Ophthalmol201415716368.e224200234
- PrakashGAgarwalAMazhariAIReliability and reproducibility of assessment of corneal epithelial thickness by Fourier domain optical coherence tomographyInvest Ophthalmol Vis Sci20125362580258522427573
- ReinsteinDZArcherTJGobbeMImproved effectiveness of transepithelial PTK versus topography-guided ablation for stromal irregularities masked by epithelial compensationJ Refract Surg201329852653323909779
- LianYShenMJiangJVertical and horizontal thickness profiles of the corneal epithelium and Bowman’s layer after orthokeratologyInvest Ophthalmol Vis Sci201354169169623221070
- SchallJDProduction, control, and visual guidance of saccadic eye movementsISRN Neurol2013201375238424260720
- QuerciaPOcular movements and reading: a reviewJ Fr Ophtalmol2010336416423 French20570391