
Abstract
Lymph node metastasis (LNM) is common in papillary thyroid cancer (PTC), and is an indicator of recurrence. The detailed molecular mechanism of LNM in PTC has not been well described. This study aimed to investigate the role of fibronectin 1 in PTC LNM and its clinical relevance. The expression of fibronectin 1 was confirmed in PTC tissues and cell lines. A correlation analysis was conducted and a receiver-operating characteristic curve obtained. The effect of fibronectin 1 on the proliferation of PTC cell lines was performed using a colony-formation assay and Cell Counting Kit 8. Cell-cycle analysis was performed with a flow-cytometry assay. Migration and invasion ability were evaluated by transwell and wound-healing assays. Fibronectin 1 was overexpressed in metastasized PTC. Overexpressed fibronectin 1 was positively correlated with PTC LNM. Receiver-operating characteristic analysis showed that the diagnostic accuracy of fibronectin 1 was 81.1%, with sensitivity of 80% and specificity of 82%. Overexpression of fibronectin 1 promoted proliferation, migration, and invasion in PTC. Fibronectin 1 plays a critical role in PTC metastasis by modulating the proliferation, migration, and invasion ability of PTC cells, and it is a valuable diagnostic biomarker for predicting PTC LNM.
Introduction
The incidence of thyroid cancer (TC) has been increasing rapidly in the past decade. Papillary TC (PTC) is the most common type of TC, and has a high probability of spreading to regional lymph nodes.Citation1–Citation4 Lymph node metastasis (LNM) is frequently detected in PTC at a rate of 30%–90%,Citation5 with both clinical and occult neck LN involvement. The presence of LNM does not affect survival, but it is an indicator for PTC recurrence.Citation6,Citation7
The choice of surgical management for PTC largely depends on whether there is cervical LN involvement at presentation, because a secondary operation for recurrent LN disease has a high risk for complications, such as recurrent laryngeal nerve injury and hypoparathyroidism. However, surgical decisions can only be appropriately made based on clinically evident LNM, and the identification of occult LNM remains difficult. Ultrasound detection at present is the best and simplest way to examine the cervical LN status of PTC preoperatively. However, ultrasound sensitivity in diagnosing cervical LNM is extremely low, with a value of 10.5% in the central compartment and 27.2% in the lateral compartment, according to previous reports.Citation8,Citation9 Therefore, the approach for evaluating the cervical LN status needs to be optimized.
Improving our understanding of underlying molecular alterations in TC with LNM would be of great value for identifying cervical LNM in PTC. Fibronectin 1, a fundamental component of the extracellular matrix, is one of the biomarkers of epithelial–mesenchymal transition (EMT), which is an essential step in cancer progression. Serum fibronectin could be a promising biomarker for detecting breast cancer at an early stage.Citation10 Another recent study indicated that fibronectin 1 was upregulated in aggressive TC.Citation11 However, the biological function of fibronectin 1 in PTC has never been reported, and the clinical significance of fibronectin 1 in LNM of papillary TC is still unclear.Citation12,Citation13
In this study, we investigated the expression level of fibronectin 1 in PTC patients with or without LNM. The patients’ clinicopathological characteristics were collected, and a correlation study was performed. The study also analyzed the diagnostic value of fibronectin 1 in identifying PTC LNM. In addition, the role of fibronectin 1 was evaluated by gain- and loss-of-function studies in the appropriate PTC cell lines.
Materials and methods
Sample collection and ethics statement
Tissue samples were collected from 90 PTC patients who had undergone thyroidectomy with lymphadenectomy in our hospital from August 2014 to December 2015. All cases were pathologically diagnosed as PTC with or without metastasis. The tissues were flash-frozen in liquid nitrogen and kept at −80°C. Patient clinicopathological characteristics were collected for the database. Written informed consent was obtained from all patients. The study was approved by the research ethics committee of Ruijin Hospital.
Total RNA extraction and qRT-PCR detection
Total RNA was extracted from the frozen tissues and cell lines using Trizol reagent (Thermo Fisher Scientific, Waltham, MA, USA) according to the manufacturer’s protocol. Fibronectin 1-expression level was evaluated in 90 PTC samples by quantitative reverse-transcription polymerase chain reaction (qRT-PCR): 1 μg of total RNA was reverse-transcribed into first-strand complementary DNA according to the protocol of the RT kit (Takara, Kusatsu, Japan). qRT-PCR was performed using an SYBR Premix Ex Taq II Kit (Takara) according to the VIIA7 system instructions (Thermo Fisher Scientific). All amplifications were normalized by GAPDH. Data were analyzed using the comparison Ct method (2−ΔΔCt) and expressed as fold change compared to the control group. Each sample was analyzed in triplicate. The primer sequences used in this study were as follows: fibronectin 1, 5′-GACGCATCACTTGCACTTCT-3′ (forward) and 5′-GATGCACTGGAGCAGGTTTC-3′ (reverse); GAPDH, 5′-AAGGTGAAGGTCGGAGT CAAC-3′ (forward) and 5′-GGGGTCATTGATGGCAACAA TA-3′ (reverse).
Cell culture
The human PTC cell lines TPC1 and K1 were kind gifts from the Key Laboratory for Endocrine and Metabolic Diseases of the Chinese Health Ministry, Department of Endocrinology and Metabolism, Ruijin Hospital (Shanghai, China). K1 and TPC1 are both well-differentiated PTC cell lines; K1 retains the property of metastasis, while TPC1 does not.Citation14 TPC1 was cultured in Roswell Park Memorial Institute 1640 HEPES medium supplemented with 10% fetal bovine serum (FBS), 100 U/mL penicillin, and 100 μg/mL streptomycin, and K1 was cultured in Dulbecco’s Modified Eagle’s Medium (all Thermo Fisher Scientific), MCDB (Sigma-Aldrich, St Louis, MO, USA), F12 (2:1:1) supplemented with 10% FBS, and 100 U/mL penicillin with 100 μg/mL streptomycin. The two cell lines were incubated at 37°C in a 5% CO2 humidified atmosphere.
Cell-line transfection
For the overexpression experiment, fibronectin 1-overexpression lentiviral was purchased from Hanbio Biotech Co Ltd (Shanghai, China); fibronectin 1 complementary DNA was ligated into pLVX-IRES-Puro (Takara) to construct the fibronectin 1-overexpression plasmid. pLVX-IRES-puro and pRUF-IRES-Puro–fibronectin 1 constructs were transfected into the HEK293T viral packaging cell line with the psPAX2 and pMD2.G (Thermo Fisher Scientific) plasmids. At 48 hours after transfection, the viral supernatant was collected and used for TPC1 infection. For the knockdown experiment, K1 cells were transfected with 100 nM fibronectin 1-specific short hairpin RNA (shRNA) (TL304489; OriGene, Rockville, MD, USA) or ineffective control shRNA (OriGene) using Lipofectamine 2000 (Thermo Fisher Scientific) according to the manufacturer’s instructions. Messenger RNA (mRNA)- and protein-expression levels of fibronectin 1 were detected by qRT-PCR and Western blot analysis, respectively.
Western blot analysis
At 48 hours after transfection, protein lysate was acquired from collected cells with radioimmunoprecipitation assay, and the supernatant was collected after a 30-minute reaction on ice and 15-minute centrifugation at 13,000 rpm. The protein concentration was determined using a BCA protein-assay kit (Thermo Fisher Scientific). An equal amount of 10 μg of protein from each condition was subjected to electrophoresis on 8% sodium dodecyl sulfate polyacrylamide-gel electrophoresis and subsequently transferred to polyvinylidene difluoride membrane, which was then blocked with 5% bovine serum albumin in Tris-buffered saline containing 0.1% Tween 20 at room temperature for 1 hour. Incubation was conducted with primary antibodies at 4°C overnight, which was followed by secondary antibodies at room temperature for 1 hour. Membranes were washed three times with washing buffer (phosphate-buffered saline containing 0.1% Tween) for 10 minutes after each incubation. Images were then captured using an Odyssey infrared fluorescence scanner (LI-Cor, Lincoln, NE, USA). We used primary antibodies recognizing human fibronectin 1 mouse monoclonal antibodies (1:1,000; R&D systems, Minneapolis, MN, USA), GAPDH, and rabbit monoclonal antibodies (1:2,000; Cell Signaling Technology, Danvers, MA, USA).
CCK-8 analysis
At 48 hours after transfection, TPC1 and K1 cells were seeded into 96-well plates at a density of 104 cells/well. Cell viability was evaluated with the Cell Counting Kit (CCK)-8 (Dojindo Molecular Technologies, Mashiki, Japan) at 0, 12, 24, 36, 48, and 72 hours. Absorbance was determined with an Infinite M200 plate reader (Tecan, Männedorf, Switzerland) at 450 nm.
Colony-formation assay
At 48 hours after transfection, TPC1 and K1 cells were seeded in six-well plates at a density of 500 cells/well and cultured at 37°C in a 5% CO2 humidified atmosphere. The culture medium was changed every other day. After 7 days in culture, the medium was removed and cells washed twice with phosphate-buffered saline. Then, the cells were fixed with methanol for 20 minutes and stained with 1% crystal violet for 30 minutes at room temperature, washed again, and photographed.
Flow-cytometry assay
After 48 hours of transfection, TPC1 and K1 cells were collected for cell-cycle analysis. Cells were fixed in 75% ethanol overnight at 4°C and then stained with a cell-cycle analysis kit (Beyotime Biotechnology, Haimen, China) according to the manufacturer’s instructions. The cells were analyzed by Gallios flow cytometry (Beckman Coulter, Brea, CA, USA) to quantify the cell cycle. All experiments were performed independently in triplicate.
Wound-healing assay
Cells were plated in each well of six-well plates and incubated to achieve 100% confluence. Then, a scratch was performed with a pipette tip. Fresh serum-free medium was changed. The wound-closing process was observed for 24 hours, and images were collected using microscopy (Carl Zeiss Meditec AG, Jena, Germany).
Transwell assay
Transwell chambers with 8 μm pores (Costar; Corning, New York, NY, USA) were used to perform the migration and invasion assays. Matrigel (BD Biosciences, Franklin Lakes, NJ, USA) was coated on the top side of the insert membrane in the invasion assay. The upper chamber was treated with 200 μL of serum-free medium and seeded with 104 cells, and the lower chamber was treated with 600 μL of medium with 5% FBS. The chambers were maintained at 37°C, 5% CO2 for 24 hours. Afterward, the unmigrated or uninvaded cells on the top of the insert membrane were removed by cotton swabs. The inserts were then fixed in methanol for 20 minutes and stained with 1% crystal violet for 30 minutes. The migrated or invaded cells on the bottom of the membrane were investigated under a microscope and photographed. All experiments were performed in triplicate.
Statistical analysis
Statistical analysis was performed with SPSS 19.0 software (IBM, Armonk, NY, USA) and GraphPad Prism 5.0 (GraphPad Software, La Jolla, CA, USA). Categorical variables are described as proportions, and descriptive variables presented as means ± standard deviation. Pearson’s χ2 test was applied in the correlation analysis of fibronectin 1 and clinicopathological characteristics. Independent two-sample t-tests were used to compare fibronectin 1-expression levels of the two independent groups. Univariate and multivariate logistic regression analysis was performed to study the risk factors for LNM. The significant variables (P<0.05) in univariate analysis were included in multivariate analysis. The sensitivity, specificity, positive predictive value, negative predictive value, and diagnostic accuracy of fibronectin 1 were assessed with a receiver-operating characteristic (ROC) curve and area under the curve (AUC). P<0.05 was considered indicative of a statistically significant difference.
Results
Patient clinicopathological characteristics
As shown in , a total of 90 patients were included in our study. They were classified into two groups (LNM group, n=40; non-LNM group, n=50) according to whether the patient had LNM. The sex, age and focalization distribution in the two groups were comparable (P>0.05). According to the American Joint Committee on Cancer staging system (seventh edition), the tumors were all pT1, and thus significant observations were limited to T1 tumors. No patients had distant metastasis. In the LNM group, 65% of the patients were N1a and 35% N1b. Patients with LNM were significantly more likely to be at an advanced stage (III/IV, 55%; P<0.05).
Table 1 Patient characteristics
Fibronectin 1 is overexpressed in metastatic PTC
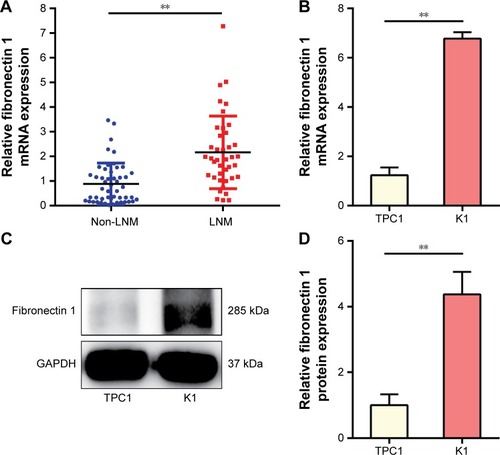
Fibronectin 1 expression was analyzed in tumor tissues for 90 patients, as well as PTC cell lines (TPC1 and K1). qRT-PCR results showed that the mRNA-expression level of fibronectin 1 was significantly higher in PTC patients with LNM, as well as in a K1 cell line that retained the property of metastasis (). Subsequently, the protein expression level of fibronectin 1 was confirmed in cell lines by Western blot analysis (), which was consistent with the mRNA-expression level.
Figure 1 Fibronectin 1 is overexpressed in metastatic PTC.
Abbreviations: PTC, papillary thyroid cancer; qRT-PCR, quantitative reverse-transcription polymerase chain reaction; mRNA, messenger RNA.
Fibronectin 1 overexpression is associated with lymph node metastasis in PTC
Fibronectin 1 was confirmed to be overexpressed in metastatic PTC. We further analyzed the correlation of fibronectin 1 expression and clinicopathological characteristics of all patients. The relative expression of fibronectin 1 was constructed on an ROC curve. The cutoff value (ΔCt =4.161) of fibronectin 1 expression was calculated by ROC-curve analysis with SPSS software. At the cutoff point of 4.161, the AUC met the maximum, indicating the best diagnostic accuracy of fibronectin 1 differentiating PTC LNM. According to the cutoff expression level of fibronectin 1 in all PTC samples, patients were categorized into a low-expression group (n=49, ΔCt >4.161) and a high-expression group (n=41, ΔCt <4.161). Patients with lower fibronectin 1 expression (ΔCt >4.161) were identified as unmetastasized PTC, whereas those with higher fibronectin 1 expression (ΔCt <4.161) were metastasized PTC (). As summarized in , fibronectin 1 overexpression was significantly correlated with tumor size (T1a vs T1b, P=0.044), LNM in PTC (N0 vs N1a and N1b, P=0.000), and pathological TNM (pTNM; tumor, node, metastasis) stage (I–II vs III–IV, P=0.000). There were no significant associations between fibronectin 1 expression and sex (P=0.806), age (P=1.000), or focalization (P=1.000). Moreover, univariate and multivariate logistic regression analyses showed that fibronectin 1 overexpression was a strong independent diagnostic factor for LNM in PTC patients (P=0.000) ().
Table 2 Fibronectin 1 evaluation and pathological results for metastatic cervical lymph nodes
Table 3 Correlations between fibronectin 1 expression and clinicopathological characteristics in PTC
Table 4 Univariate and multivariate regression analysis of parameters associated with LNM
Fibronectin 1 is a potential diagnostic biomarker for differentiating lymph node metastasis in PTC
To evaluate further the possibility of clinical application of fibronectin 1 in PTC patients, the diagnostic potential and discriminatory accuracy of fibronectin 1 was evaluated by ROC-curve analysis and corresponding AUC values. The AUC for fibronectin 1 was 0.814 (95% confidence interval 0.723–0.905, P<0.000, ). The highest diagnostic value was at a cutoff point of 4.161, where the negative predictive value, positive predictive value, sensitivity, and specificity to identify PTC LNM were 83.7%, 78%, 80%, and 82%, respectively, with a diagnostic accuracy of 81.1% ().
Figure 2 Potential diagnostic value of fibronectin 1.
Abbreviations: ROC, receiver-operating characteristic; AUC, area under the curve.
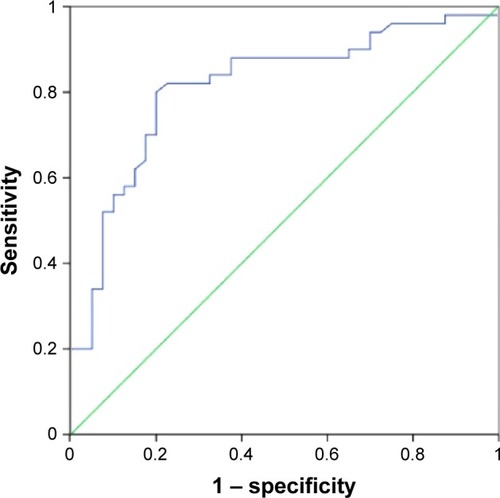
Table 5 Performance of fibronectin 1 in differentiating LNM in PTC
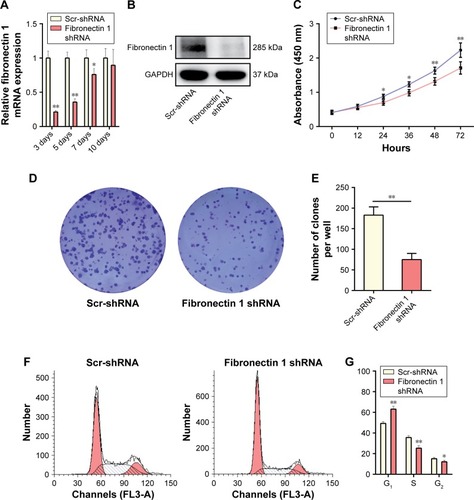
Fibronectin 1 knockdown suppresses K1 proliferation
A loss-of-function experiment was performed on the K1 cell line. Transfection efficiency was estimated by qRT-PCR and Western blot analysis, showing that the fibronectin 1-expression level was knocked down significantly by shRNA (). In CCK-8 assays, the proliferation ability of K1 cells was examined at six time points (0, 12, 24, 36, 48, and 72 hours) after transfection. Cell viability was shown as a proliferation curve based on absorbance at 450 nm. The proliferation ability of cells in the fibronectin 1 shRNA group was inhibited compared to the scrambled (Scr)-shRNA control group (). In addition, the impact of fibronectin 1 on cell proliferation was evaluated by the colony-formation assay. The colony-formation assay showed that there were fewer clones in the fibronectin 1 shRNA group than in the control group (). The cell-cycle analysis showed that the proportion of cells in the G1 phase was significantly higher in the fibronectin 1 shRNA group compared to the Scr-shRNA group, whereas it was lower in the S and G2/M phases in the fibronectin 1 shRNA group (). The results indicated that the proliferation ability of PTC cells was suppressed by fibronectin 1 downregulation.
Figure 3 Fibronectin 1 knockdown suppresses K1 proliferation.
Abbreviations: qRT-PCR, quantitative reverse-transcription polymerase chain reaction; mRNA, messenger RNA; shRNA, short hairpin RNA; Scr-shRNA, scrambled shRNA.
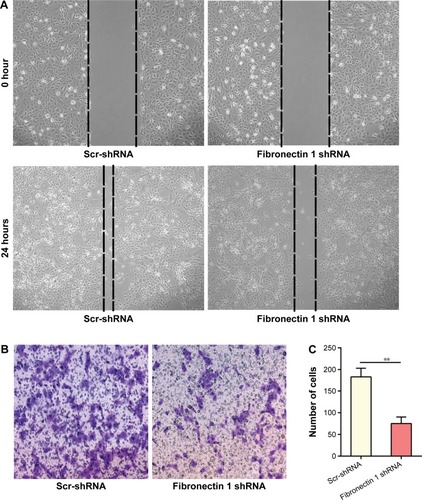
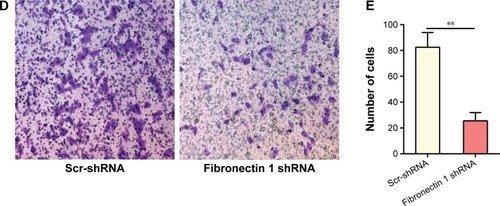
Fibronectin 1 knockdown inhibits migration and invasion of K1
A wound-healing assay showed that the distance of the scratch wound in the fibronectin 1 shRNA group was significantly larger than the Scr-shRNA control group (). In transwell-migration assays, the number of cells migrating through the chamber in the fibronectin 1 shRNA group was significantly lower than that in the Scr-shRNA control group (). A similar result was observed in the invasion assay (). Downregulation of fibronectin 1 inhibited the migration and invasion of PTC cells.
Figure 4 Fibronectin 1 knockdown inhibits the migration and invasion of K1.
Abbreviations: shRNA, short hairpin RNA; Scr-shRNA, scrambled shRNA.
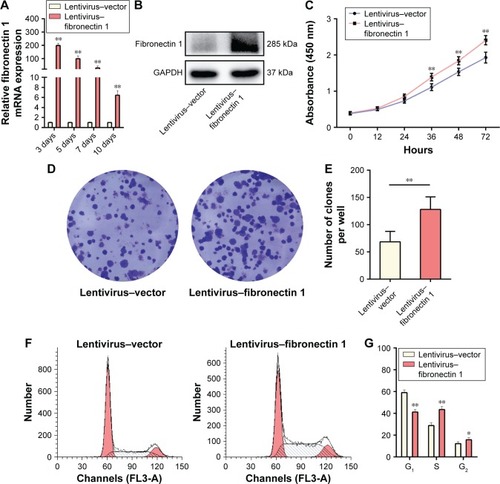
Fibronectin 1 overexpression promotes TPC1 proliferation
A gain-of-function experiment was performed on the TPC1 cell line. Transfection efficiency was estimated by qRT-PCR and Western blot analysis, showing that fibronectin 1- expression level was significantly overexpressed by lentivirus–fibronectin 1 (). CCK-8 assays examined the proliferation ability of TPC1 cells at six time points (0, 12, 24, 36, 48, and 72 hours) after transfection. Cell viability is shown in a proliferation curve based on absorbance at 450 nm. Cell-proliferation ability in the lentivirus–fibronectin 1 group was higher than that in the lentivirus–vector control group (). Similarly, the colony-formation assay showed that the number of clones in the lentivirus–fibronectin 1 group was higher than that in the control group (). Cell-cycle analysis showed that the proportion of cells in the G1 phase was significantly lower in the lentivirus–fibronectin 1 group compared to the lentivirus–vector control group, whereas it was higher in the S and G2/M phases in the lentivirus–fibronectin 1 group (). The proliferation ability of PTC cells was promoted by fibronectin 1.
Figure 5 Fibronectin 1 overexpression promotes TPC1 proliferation.
Abbreviations: qRT-PCR, quantitative reverse-transcription polymerase chain reaction; mRNA, messenger RNA.
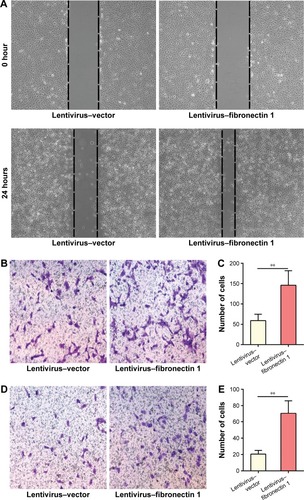
Fibronectin 1 overexpression promotes migration and invasion of TPC1
In the wound-healing assay, the distance of the scratch wound in the lentivirus–fibronectin 1 group was significantly shorter than for the lentivirus–vector control group (). In a transwell-migration assay, the number of cells migrating through the chamber in the lentivirus–fibronectin 1 group was significantly higher than the control group (). A similar result was also observed in the invasion assay (). The result indicated that fibronectin 1 upregulation promoted migration and invasion of PTC cells.
Figure 6 Fibronectin 1 overexpression promotes the migration and invasion of TPC1.
Discussion
LNM occurs frequently in PTC, but there is a lack of an effective method to screen out LNM with atypical ultrasonographic characteristics or micrometastasis. The mechanism for LNM in PTC has not been clearly identified, because it is not a lethal disease. However, it is of great importance to identify the cervical node status for optimal surgical decision making in PTC.Citation15 Reoperation as a result of recurrence is a challenge for surgeons, because of distortion of the normal tissue plane, postsurgical fibrosis, and severe adhesion. Additionally, it increases the incidence of complications, which could impact the patient’s quality of life.Citation16 A better understanding of LNM in PTC is important to improve diagnosis and therapy.
Fibronectin 1 encodes fibronectin, which presents in soluble dimeric form in the plasma and in dimeric or multimeric form at the cell surface and in the extracellular matrix. As an EMT marker, fibronectin is involved in cell adhesion and migration, including embryogenesis,Citation17 wound healing,Citation18 blood coagulation,Citation19 osteogenesis,Citation20 and metastasis.Citation21,Citation22 EMT is a process involved in embryonic development, during which cells lose their epithelial features and adopt characteristics of mesenchymal cells. EMT also plays a role in cancer invasion and metastasis in a sequence of discrete steps.Citation23,Citation24 Decreased expression of the epithelial marker E-cadherin and increased expression of mesenchymal markers, such as N-cadherin and fibronectin, are the most important features of EMT.Citation25 E-cadherin has promise as a marker to identify colorectal cancer patients at risk for metastatic disease independently of LN evaluation and imaging results.Citation26 In addition, EMT biomarkers can also interact with one another in certain tumors. It has been reported that Snail overexpression causes a decrease in the expression of epithelial markers E-cadherin and β-catenin and an increase in mesenchymal (Snail and vimentin) marker expression.Citation27 Gain of fibronectin alters the component of the extracellular matrix, and the tumor then acquires invasive capacity.Citation28 Association between fibronectin expression and invasiveness has been documented in several tumors, such as breast and lung.Citation21,Citation29,Citation30 The role of fibronectin in follicular TC has been studied in in vivo experiments.Citation31 However, little is known about the biological function of fibronectin 1 in PTC. Our understanding of the role of fibronectin 1 in PTC metastasis remains limited.
According to our study, fibronectin 1 expression was significantly increased in PTC patients with LNM compared to patients without LNM. There were no correlations between the expression level of fibronectin 1 and clinicopathological characteristics, except for tumor size, cervical LN involvement, and pTNM stage. Our study indicated that fibronectin 1 overexpression was associated with larger PTC tumor size, PTC LNM and an advanced pTNM stage, which is reported for the first time. This study also primarily analyzed the diagnostic value of fibronectin 1 in differentiating LNM from non-LNM in PTC. In this cohort of patients, we showed that fibronectin 1 sensitivity was 80% in identifying overall cervical LNM in PTC, which was much higher than ultrasonography evaluation in previous studies.Citation32,Citation33 Fibronectin 1 specificity in predicting PTC LNM was similar compared to ultrasound examination.Citation33,Citation34 The study indicated that fibronectin 1 could be a potential diagnostic biomarker for predicting LNM in PTC.
In the past few decades, various mechanisms for cancer metastasis have been investigated.Citation29,Citation35–Citation37 However, the mechanism for LNM in PTC has not been comprehensively reported. EMT is a well-known process involved in cancer metastasis.Citation38,Citation39 There are functional genes modulating EMT, resulting in tumor progression.Citation32 Fibronectin 1 is one of the EMT regulators that was found to be upregulated in aggressive TC.Citation11 In our study, the role of fibronectin 1 was investigated in PTC cell lines. Transwell and would-healing assays showed that the migration and invasive ability of PTC cells were both increased by fibronectin 1 overexpression. Likewise, colony-formation assay and CCK-8 analysis demonstrated that PTC-proliferation ability was promoted by fibronectin 1 overexpression. Fibronectin 1 function was consistent with that reported in other tumors.Citation40–Citation42 In vitro data indicated that overexpression of fibronectin 1 promoted PTC metastasis. However, previous in vivo studies of follicular TC have indicated that attenuated fibronectin expression demonstrates a more aggressive growth pattern and more numerous lung metastases in xenografted mice.Citation31,Citation43 The possible explanation for the opposite observation in vivo and in vitro could be because they are different pathological subtypes of TC. In vivo functional study of fibronectin 1 in PTC merits further investigation.
Conclusion
This study demonstrated that fibronectin 1 plays a critical role in TC metastasis by modulating the proliferation, migration, and invasion ability of PTC cells. Fibronectin 1 is associated with PTC LNM, and is a valuable diagnostic biomarker for predicting LNM in PTC.
Acknowledgments
The work was supported by the National Natural Science Foundation of China (81471668 and 81671688). The funding agency had no role in study design, data collection, analysis, decision to publish, or preparation of the manuscript.
Disclosure
The authors report no conflicts of interest in this work.
References
- HundahlSAFlemingIDFremgenAMMenckHRA National Cancer Data Base report on 53,856 cases of thyroid carcinoma treated in the U.S., 1985–1995Cancer19988312263826489874472
- LundgrenCIHallPDickmanPWZedeniusJClinically significant prognostic factors for differentiated thyroid carcinoma: a population-based, nested case-control studyCancer2006106352453116369995
- ZaydfudimVFeurerIDGriffinMRPhayJEThe impact of lymph node involvement on survival in patients with papillary and follicular thyroid carcinomaSurgery200814461070107819041020
- ShindoMWuJCParkEETanzellaFThe importance of central compartment elective lymph node excision in the staging and treatment of papillary thyroid cancerArch Otolaryngol Head Neck Surg2006132665065416785411
- CaronNRClarkOHPapillary thyroid cancer: surgical management of lymph node metastasesCurr Treat Options Oncol20056431132215967084
- PatronVHitierMBedfertCLe ClechGJégouxFOccult lymph node metastases increase locoregional recurrence in differentiated thyroid carcinomaAnn Otol Rhinol Laryngol2012121528329022724272
- LeboulleuxSRubinoCBaudinEPrognostic factors for persistent or recurrent disease of papillary thyroid carcinoma with neck lymph node metastases and/or tumor extension beyond the thyroid capsule at initial diagnosisJ Clin Endocrinol Metab200590105723572916030160
- ItoYTomodaCUrunoTClinical significance of metastasis to the central compartment from papillary microcarcinoma of the thyroidWorld J Surg2006301919916369721
- ItoYTomodaCUrunoTUltrasonographically and anatomopathologically detectable node metastases in the lateral compartment as indicators of worse relapse-free survival in patients with papillary thyroid carcinomaWorld J Surg200529791792015951927
- MoonPGLeeJEChoYEFibronectin on circulating extracellular vesicles as a liquid biopsy to detect breast cancerOncotarget2016726401894019927250024
- SponzielloMRosignoloFCelanoMFibronectin-1 expression is increased in aggressive thyroid cancer and favors the migration and invasion of cancer cellsMol Cell Endocrinol201643112313227173027
- TakeyamaHKyodaSOkamotoTThe expression of sialic fibronectin correlates with lymph node metastasis of thyroid malignant neoplasmasAnticancer Res20113141395139821508391
- VendittelliFRaffaelliMFaddaGBlood presence of circulating oncofetal fibronectin mRNA, by RT-PCR, does not represent a useful specific marker for the management and follow-up of thyroid cancer patientsClin Chem Lab Med201250471572022505562
- SaiseletMFloorSTarabichiMThyroid cancer cell lines: an overviewFront Endocrinol (Lausanne)2012313323162534
- HaugenBRAlexanderEKBibleKC2015 American Thyroid Association management guidelines for adult patients with thyroid nodules and differentiated thyroid cancerThyroid2016261113326462967
- EsnaolaNFCantorSBShermanSILeeJEEvansDBOptimal treatment strategy in patients with papillary thyroid cancer: a decision analysisSurgery2001130692193011742318
- de AlmeidaPGPinheiroGGNunesAMGonçalvesABThorsteinsdóttirSFibronectin assembly during early embryo development: a versatile communication system between cells and tissuesDev Dyn2016245452053526845241
- MaioneAGSmithAKashpurOAltered ECM deposition by diabetic foot ulcer-derived fibroblasts implicates fibronectin in chronic wound repairWound Repair Regen201624463064327102877
- WangYNiHFibronectin maintains the balance between hemostasis and thrombosisCell Mol Life Sci201673173265327727098513
- NishiokaTArimaNKanoKATX-LPA1 axis contributes to proliferation of chondrocytes by regulating fibronectin assembly leading to proper cartilage formationSci Rep201662343327005960
- JeonMLeeJNamSJShinILeeJEKimSInduction of fibronectin by HER2 overexpression triggers adhesion and invasion of breast cancer cellsExp Cell Res2015333111612625743092
- MoritaYHataKNakanishiMCellular fibronectin 1 promotes VEGF-C expression, lymphangiogenesis and lymph node metastasis associated with human oral squamous cell carcinomaClin Exp Metastasis201532773975326319373
- HanahanDWeinbergRAHallmarks of cancer: the next generationCell2011144564667421376230
- ThieryJPEpithelial-mesenchymal transitions in tumour progressionNat Rev Cancer20022644245412189386
- SunLFangJEpigenetic regulation of epithelial-mesenchymal transitionCell Mol Life Sci201673234493451527392607
- BuschELKekuTORichardsonDBEvaluating markers of epithelial-mesenchymal transition to identify cancer patients at risk for metastatic diseaseClin Exp Metastasis2016331536226507436
- YangYJLiZBZhangGRSnail-induced epithelial-mesenchymal transition in gastric carcinoma cells and generation of cancer stem cell characteristicsGenet Mol Res201615315038510
- KalluriRWeinbergRAThe basics of epithelial-mesenchymal transitionJ Clin Invest200911961420142819487818
- YousifNGFibronectin promotes migration and invasion of ovarian cancer cells through up-regulation of FAK-PI3K/Akt pathwayCell Biol Int2014381859124115647
- PalSGangulyKKChatterjeeAExtracellular matrix protein fibronectin induces matrix metalloproteinases in human prostate adenocarcinoma cells PC-3Cell Commun Adhes201320510511424047237
- LiuWAsaSLEzzatS1α,25-Dihydroxyvitamin D3 targets PTEN-dependent fibronectin expression to restore thyroid cancer cell adhesivenessMol Endocrinol20051992349235715890670
- LeboulleuxSGirardERoseMUltrasound criteria of malignancy for cervical lymph nodes in patients followed up for differentiated thyroid cancerJ Clin Endocrinol Metab20079293590359417609301
- HwangHSOrloffLAEfficacy of preoperative neck ultrasound in the detection of cervical lymph node metastasis from thyroid cancerLaryngoscope2011121348749121344423
- KimEParkJSSonKRKimJHJeonSJNaDGPreoperative diagnosis of cervical metastatic lymph nodes in papillary thyroid carcinoma: comparison of ultrasound, computed tomography, and combined ultrasound with computed tomographyThyroid200818441141818358074
- RankinEBGiacciaAJHypoxic control of metastasisScience2016352628217518027124451
- MassagueJObenaufACMetastatic colonization by circulating tumour cellsNature2016529758629830626791720
- SynNWangLSethiGThieryJPGohBCExosome-mediated metastasis: from epithelial-mesenchymal transition to escape from immunosurveillanceTrends Pharmacol Sci201637760661727157716
- ImaniSHosseinifardHChengJWeiCFuJPrognostic value of EMT-inducing transcription factors (EMT-TFs) in metastatic breast cancer: a systematic review and meta-analysisSci Rep201662858727335258
- WuCZhuangYJiangSInteraction between Wnt/β-catenin pathway and microRNAs regulates epithelial-mesenchymal transition in gastric cancer (review)Int J Oncol20164862236224627082441
- KennyHAChiangCYWhiteEAMesothelial cells promote early ovarian cancer metastasis through fibronectin secretionJ Clin Invest2014124104614462825202979
- LiWLiuZZhaoCZhaiLBinding of MMP-9-degraded fibronectin to β6 integrin promotes invasion via the FAK-Src-related Erk1/2 and PI3K/Akt/Smad-1/5/8 pathways in breast cancerOncol Rep20153431345135226134759
- HanSKhuriFRRomanJFibronectin stimulates non-small cell lung carcinoma cell growth through activation of Akt/mammalian target of rapamycin/S6 kinase and inactivation of LKB1/AMP-activated protein kinase signal pathwaysCancer Res200666131532316397245
- LiuWChengSAsaSLEzzatSThe melanoma-associated antigen A3 mediates fibronectin-controlled cancer progression and metastasisCancer Res200868198104811218829569