
Abstract
Background
Dysregulation of lipid metabolism is common in cancer. However, the molecular mechanism underlying lipid metabolism in esophageal squamous cell carcinoma (ESCC) and its effect on patient prognosis are not well understood. The objective of our study was to construct a lipid metabolism-related prognostic model to improve prognosis prediction in ESCC.
Methods
We downloaded the mRNA expression profiles and corresponding survival data of patients with ESCC from the Gene Expression Omnibus (GEO) and The Cancer Genome Atlas (TCGA) databases. We performed differential expression analysis to identify differentially expressed lipid metabolism-related genes (DELMGs). We used Univariate Cox regression and least absolute shrinkage and selection operator (LASSO) analyses to establish a risk model in the GEO cohort and used data of patients with ESCC from the TCGA cohort for validation. We also explored the relationship between the risk model and the immune microenvironment via infiltrated immune cells and immune checkpoints.
Results
The result showed that 132 unique DELMGs distinguished patients with ESCC from the controls. We identified four genes (ACAA1, ACOT11, B4GALNT1, and DDHD1) as prognostic gene expression signatures to construct a risk model. Patients were classified into high- and low-risk groups as per the signature-based risk score. We used the receiver operating characteristic (ROC) curve and the Kaplan-Meier (KM) survival analysis to validate the predictive performance of the 4-gene signature in both the training and validation sets. Infiltrated immune cells and immune checkpoints indicated a difference in the immune status between the two risk groups.
Conclusion
The results of our study indicated that a prognostic model based on the 4-gene signature related to lipid metabolism was useful for the prediction of prognosis in patients with ESCC.
Introduction
Esophageal cancer (EC) is the eighth most common cancer globally and ranks sixth in cancer-related mortality rates.Citation1,Citation2 EC is typically categorized into two major histological subtypes, esophageal squamous cell carcinoma (ESCC) and esophageal adenocarcinoma (EAC), based on distinct pathological features.Citation3,Citation4 ESCC, the predominant histologic type of esophageal malignancy, exhibits a high incidence, particularly in developing countries,Citation5 with China accounting for more than half of all ESCC cases. ESCC poses a significant public health challenge due to its aggressive nature and limited treatment options, prompting extensive research efforts to better understand its etiology, progression, and therapeutic strategies.
Currently, esophageal cancer (EC) is managed primarily with surgery, radiotherapy, and chemotherapy. Despite extensive clinical efforts, patients with esophageal squamous cell carcinoma (ESCC) face a challenging prognosis.Citation6 Targeted therapies offer promise for improving EC outcomes. Cetuximab and bevacizumab, for example, target the epidermal growth factor receptor (EGFR) and vascular endothelial growth factor (VEGF), respectively. Trastuzumab, an anti-human epidermal growth factor receptor 2 (HER-2) monoclonal antibody, and pembrolizumab, an inhibitor of programmed cell death-Ligand 1 (PD-L1), represent drugs under investigation as novel treatment strategies for EC. These agents target surface antigens, signaling pathways, or immune checkpoints.Citation7 Recent research into checkpoint inhibitors for gastroesophageal cancers demonstrated that adding pembrolizumab to cisplatin-fluoropyrimidine chemotherapy significantly enhanced survival in ESCC patients with a combined positive score of ≥ 10 tumors, though the benefit was less pronounced in unselected ESCC cases.Citation8 Additionally, in the context of emerging targeted therapies, ESCC cell lines and patient-derived xenograft models displaying EGFR copy number gain (CNG) or overexpression show potential candidacy for afatinib. Simultaneous EGFR/SFKs inhibition holds promise for reversing afatinib-acquired resistance attributed to SFKs activation in ESCC.Citation9 With the increasing interest in immunotherapy, there is a growing demand for predictive tools to aid clinical decision-making.
Metabolic dysregulation, particularly lipid metabolism, significantly influences cancer progression. Lipids provide energy, structural components, and signaling molecules essential for cancer cell metastasis. Dysregulated lipid metabolism, marked by changes in lipid metabolism-related genes (LMRGs), has prognostic value in various tumors.Citation10 In ESCC metabolic dysregulation affects prognosis. Studies identified key players, including fatty acid 2-hydroxylase (FA2H) and LPCAT1, impacting ESCC progression. FA2H promotes metastasis through TNFα-FOXC2-FA2H signaling,Citation11 while inhibiting palmitic acid synthesis elevates lncRNA SLC25A21-AS1, enhancing proliferation and migration.Citation12 Cholesterol metabolism disruption also affects ESCC behavior. LPCAT1 negatively correlates with patient prognosis and inhibits cell proliferation, invasion, and migration.Citation13 Plasma exosome analysis reveals a predictive marker set for ESCC recurrence.Citation14 These findings highlight the intricate role of lipid metabolism in ESCC.
Bioinformatics analysis, an interdisciplinary field combining life sciences with computational sciences, is widely employed in screening tumor-specific genes and prognostic biomarkers, thereby aiding cancer therapy.Citation15,Citation16 In this study, we identified four lipid metabolism-related prognostic genes, ACAA1, ACOT11, DDHD1, and B4GALNT1, which play pivotal roles in lipid metabolism, and is crucial for cellular membrane integrity, energy production, and signaling molecule generation. For esophageal squamous cell carcinoma (ESCC). We subsequently constructed a corresponding prognostic model to predict patient survival. Additionally, we explored the relationship between the prognostic model, immune infiltration, and drug sensitivity. Furthermore, we integrated clinical characteristics to develop a nomogram for predicting ESCC patient survival rates, enhancing the clinical utility of the prognostic model. Consequently, our research results offer new directions for ESCC treatment.
Materials and Methods
Data Source
We downloaded transcriptomic data and corresponding clinical information for 60 ESCC and 60 control samples from the GSE53622 cohort in the Gene Expression Omnibus (GEO) database, and a total of 80 ESCC samples from the TCGA-ESCA cohort downloaded from The Cancer Genome Atlas (TCGA) data portal was used to validate the prognostic model. In addition, GSE53624 (119 ESCC and 119 normal samples) was used to validate the expression of prognostic genes. A total of 856 lipid metabolism-related genes from 4 lipid metabolism datasets (REACTOME_METABOLISM_OF_LIPIDS, REACTOME_PHOSPHOLIPID_METABOLISM, HALLMARK_FATTY_ACID_METABOLISM, and KEGG_GLYCEROPHOSPHOLIPID_METABOLISM) were acquired from the Molecular Signature Database (MSigDB).
Identification of Differentially Expressed Lipid Metabolism-Related Genes (DELMGs) on ESCC
We used the “limma” R packageCitation17 to determine whether genes were expressed differently in ESCC cases versus controls. We determined the log2fold-change (FC) in expression and adjusted P-values (adj. P). Possible false-positive findings were adjusted using the adj. P calculated using the Benjamini-Hochberg technique with the default parameters. Genes that met the specific cut-off criteria of adj. P < 0.05 and |log2FC| > 1 were considered differentially expressed genes (DEGs). We analyzed the intersecting genes (differentially expressed lipid metabolism-related genes, or DELMGs) of DEGs and lipid metabolism-related genes using a Venn diagram.
Functional Enrichment of DELMGs
We performed the Gene Ontology (GO) annotation and Kyoto Encyclopedia of Genes and Genomes (KEGG) pathway enrichment analyses using the R package “clusterProfiler”Citation18 to reveal the functions of DELMGs. The GO keywords consisted of the following three divisions: biological process (BP), cellular component (CC), and molecular function (MF). Adj. P < 0.05 was considered statistically significant.
Identification of Survival-Related DELMGs and Establishment of the Prognostic Gene Signature
We used univariate Cox regression analysis to screen for DELMGs in the training set that were significantly associated with the overall survival (OS) of patients. In the univariate Cox regression analysis, we used HR ≠ 0 and P < 0.05 as the criteria to screen candidate genes. Using the LASSO regression analysis, we constructed a prognostic model and used the function “glmnet”Citation19 of the R package to minimize the risk of overfitting. Subsequently, based on gene expression and the corresponding LASSO regression coefficient, we calculated the risk score of patients as follows:
Risk score = expression level of Gene 1 × corresponding coefficient of Gene 1 + expression level of Gene 2 × corresponding coefficient of Gene 2 +…+ expression level of Gene n × corresponding coefficient of Gene n.
Then, based on the median risk score values, we classified patients into high-risk and low-risk groups. We used the “survival” R packageCitation20 for performing the survival analysis between high-risk and low-risk groups. To evaluate the predictive accuracy of the gene signature, we used the “plotROC”Citation21 R package for performing the time-dependent receiver operating characteristic (ROC) curve analysis. With a process similar to that used on the training dataset, we used the testing set to assess the prognostic value.
Comparison of the Immune Microenvironment Analysis in the High- and Low-Risk Groups
Infiltrated immune cells play indispensable roles in tumor immunotherapies. We used the single-sample gene set enrichment analysis (ssGSEA) method to determine the composition of 28 immune cell types in the GEO cohort. We used this to compare infiltrated immune cells in samples with different risk scores. We used the “GSVA” R packageCitation22 for performing the ssGSEA. Additionally, we also compared the levels of expression of 43 immune checkpointsCitation23 between the high- and low-risk groups.
Prediction of Therapeutic Sensitivity in Patients with Different Risk Scores
We investigated 138 drugs used in chemotherapies/targeted therapies for the predictive capacity of the risk score. Using the “pRRophetic”Citation24 package, we inferred the 50% inhibiting concentration (IC50) value of the 138 drugsCitation25 and normally transformed the value.
Construction and Evaluation of the Predictive Nomogram
The nomogram was a useful assessment tool in the quantification of the risk to individuals in a clinical setting with the integration of multiple risk factors. We integrated the independent predictive factors identified using univariate Cox regression (P < 0.05) to construct a predictive nomogram with multivariable Cox regression analysis and constructed the corresponding calibration curves using the “rms” R package.Citation26 The closer the calibration curve was to the 45 line, which represented the best prediction, the better the prognostic prediction performance of the nomogram.
Tissue-Level Quantitative Polymerase Chain Reaction (Q-PCR) Validation in vivo
We analyzed six paired tumor and normal tissues using the quantitative polymerase chain reaction (Q-PCR) method. The Ethics Committee of Inner Mongolia Cancer Hospital (KY202210) approved the study, and participants wrote informed consent for their participation. We used six pairs of tissues collected from the Inner Mongolia Cancer Hospital and Affiliated People’s Hospital of Inner Mongolia Medical University between July 2022 and August 2022.
The tissue of ESCC and normal samples was taken from each sample, and RNA was extracted from tissues with TRIzol (Ambion, Austin, Texas, American). Then, the RNA concentration was detected with NanoPhotometer N50. Total RNA was subjected to reverse transcription using SureScript-First-strand-cDNA-synthesis-kit (Saville, Wuhan, China) from Saville. The quantitative PCR (QPCR) reaction system was made up of 3ul of cDNA, 5ul of 2xUniversal Blue SYBR Green qPCR Master Mix and 1ul of each upstream and downstream primers. Finally, the reactions were performed on a CFX96 real-time quantitative fluorescence PCR instrument. The amplification reactions were programmed with pre-denaturation at 95°C for 1 min, followed by 40 cycles, each cycle consisting of 95°C for 20s, 55°C for 20s, and 72°C for 30s. The relative expression of genes was calculated by the 2−ΔΔCt method using GADPH as the internal reference gene. The P value was calculated by GraphPad Prism 5 and less than 0.05 was considered to be significantly different. The primer sequences were listed in .
Table 1 The Primer Sequences of Prognostic Genes
Results
Identification of DELMGs in ESCC
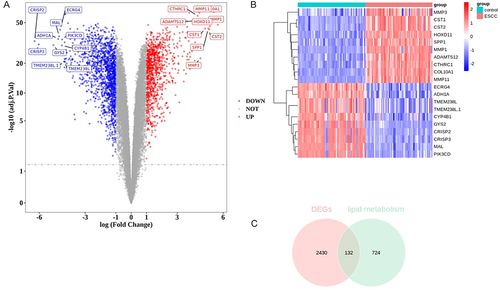
Following GEO dataset analysis, we successfully identified 2562 DEGs (ESCC vs control) with the criteria adj. P < 0.05 and |log2FC| > 1, and this included 1012 upregulated and 1550 downregulated genes (). We used a heatmap to visualize the top 10 upregulated genes and the top 10 downregulated genes ranked in the order of log2FC (). We retained the 132 overlapping genes from DEGs and lipid metabolism-related genes as DELMGs for subsequent analysis ().
Figure 1 Identification of differentially expressed lipid metabolism-related genes (DELMGs) in esophageal squamous cell carcinoma (ESCC). (A) The volcano plot of differentially expressed genes (DEGs) between ESCC and control samples. (B) The heatmap of the top 10 up-regulated and down-regulated DEGs. (C) Venn diagram of DEGs and lipid metabolism-related genes.
Functional Enrichment Analysis of DELMGs
We used the R package “clusterProfiler” to perform the GO annotation and the KEGG pathway enrichment analyses to obtain a deeper insight into the biological roles of these DELMGs. The top five significantly enriched GO-BP terms included “fatty acid metabolic process”, “unsaturated fatty acid metabolic process”, “lipid catabolic process”, “olefinic compound metabolic process”, and “icosanoid metabolic process”.
In the GO-CC analysis, the top five significantly enriched terms were “intrinsic component of endoplasmic reticulum membrane”, “lipid droplet”, “peroxisomal matrix”, “microbody lumen”, and “intrinsic component of organelle membrane”.
GO-MF analysis revealed that these DELMGs were markedly enriched in “iron ion binding”, “monooxygenase activity”, “heme binding”, “oxidoreductase activity, acting on paired donors, with incorporation or reduction of molecular oxygen”, and “tetrapyrrole binding” ( and ).
Figure 2 Functional enrichment analysis of DELMGs. (A and B) The Gene Ontology (GO) terms enriched in DELMGs. (C and D) The Kyoto Encyclopedia of Genes and Genomes (KEGG) pathways enriched in DELMGs.
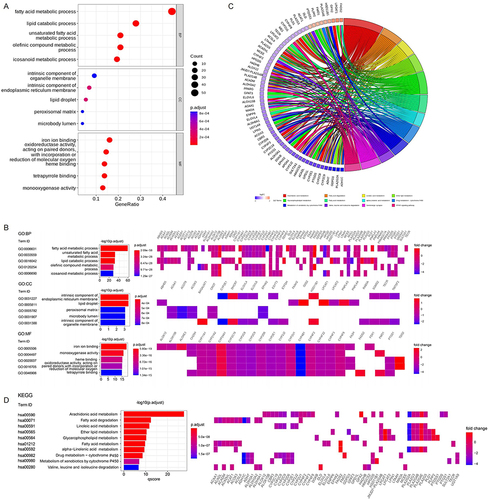
In addition, the markedly enriched KEGG pathways for these DELMGs were “arachidonic acid metabolism”, “fatty acid degradation”, “linoleic acid metabolism”, “ether lipid metabolism”, and “glycerophospholipid metabolism” ( and ).
Prognosis Prediction Model of ESCC Based on the DELMGs
To further determine the DELMGs significantly related to the prognosis, we used univariate Cox analysis for screening the training data set and identified four DELMGs with HR ≠ 0 and P < 0.05 (). By applying the LASSO regression analysis, we established a prognostic model using the expression profiles of the four genes mentioned above ( and ). Finally, we constructed a 4-gene (ACAA1, ACOT11, B4GALNT1, and DDHD1) prognostic model to predict prognosis as follows:
Figure 3 Construction of prognostic model for ESCC based on the DELMGs. (A) The results of univariate Cox analysis in the training dataset. (B and C) The plot of gene coefficients (B) and error plots for 10-fold cross-validation (C) in least absolute shrinkage and selection operator (LASSO) analysis. (D) The distribution plot of risk score. (E) The survival state distribution of samples. (F) The Kaplan-Meier curve for high- and low-risk groups. (G) The receiver operating characteristic (ROC) curve of the prognostic model with 1,2,3 years as survival time points.
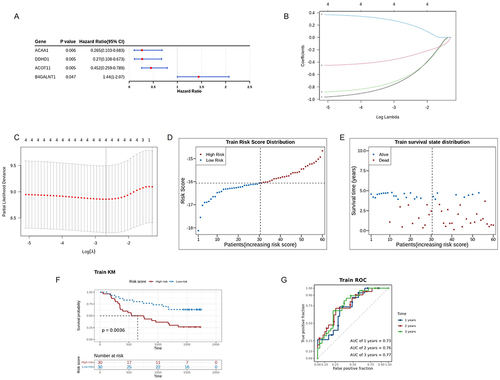
Risk score = (−0.6763079 * ACAA1) + (−0.3210565 * ACOT11) + (0.2318823 * B4GALNT1) + (−0.6477728 * DDHD1).
We divided patients into a high-risk group (n = 30) or a low-risk group (n = 30) according to the median value of the risk score in the GEO cohort (). The patients in the high-risk group had a higher probability of dying earlier than those in the low-risk group (). Analogously, the Kaplan-Meier curve showed that the prognostic signature clearly differentiated patients with high and low survival rates (). The area under the curve (AUC) confirmed that the identified prognostic signature had a moderate efficiency for predicting the OS for patients with ESCC (AUC = 0.73, 0.76, and 0.77 at 1, 2, and 3 years, respectively, ).
Validation of the 4-Gene Signature in the TCGA Dataset
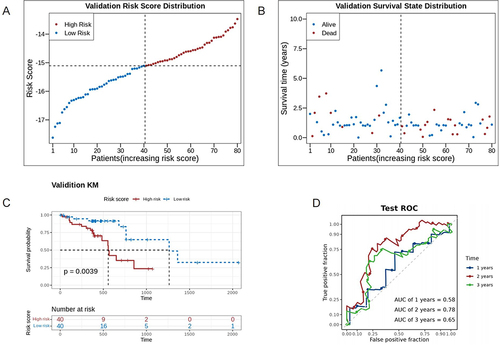
Based on the median value of the risk score, we categorized patients with ESCC from the TCGA cohort into high-risk or low-risk groups (). Patients in the high-risk group had a poorer prognosis compared to those in the low-risk group (). The KM curve showed that the prognostic signature clearly differentiated patients with different survival rates (). The AUC of ROC indicated that the 4-gene signature had moderate predictive ability (AUC = 0.58, 0.78, and 0.65 at 1, 2, and 3 years, ).
Figure 4 Validation of the 4-gene signature in the TCGA dataset. (A) The distribution plot of risk score in the TCGA dataset. (B) The survival state distribution of samples in the TCGAdataset. (C) The Kaplan-Meier curves of high- and low-risk groups. (D) The ROC curves of prognostic model in the TCGA dataset.
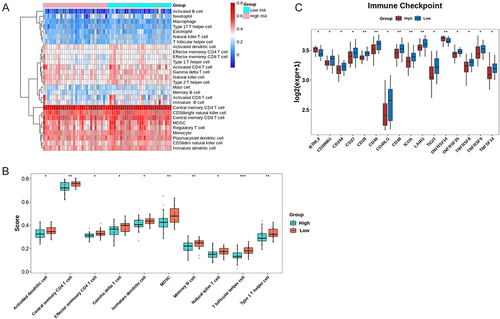
Risk Score Was Associated with the ESCC Immune Microenvironment
We used ssGSEA to estimate the enrichment of immune cells in patients with ESCC and define the immune microenvironment of tumors. The distribution of 28 infiltrating immune cells in the ESCC and normal samples is shown in . Ten cell types, namely, T follicular helper cells, central memory CD4 T cells, memory B cells, type 1 T helper cells, MDSC, effector memory CD4 T cells, immature dendritic cells, activated dendritic cells, gamma delta T cells, and natural killer T cells, were significantly different in patients in the high- and low-risk groups (). When we compared the expressions of immune checkpoints between the high- and low-risk groups, we found that 16 immune checkpoints were significantly different in expression between the two groups ().
Figure 5 Immune infiltration analysis for ESCCsamples. (A) The distribution of 28 infiltrating immune cells in the ESCC and normal samples; (B) 10 cell types are significantly different in high- and low-risk groups. *p<0.05; **p<0.01, ***p<0.001. (C) The expression of 16 immune checkpoints is significantly different between high- and low-risk groups. *p<0.05; **p<0.01.
Prediction of Therapeutic Sensitivity in Patients with Different Risk Scores
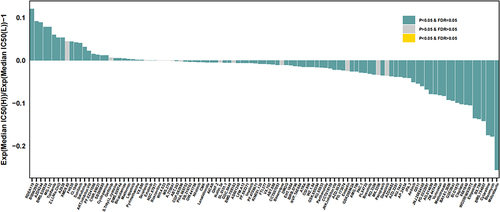
We inferred the IC50 value of the 138 drugs in patients with ESCC to find the potency of the risk score as a biomarker for predicting the response of patients with ESCC to drugs (including chemotherapy, targeted therapy, and immunotherapy). We found that patients in the low-risk group could be more sensitive to RDEA119, BIBW2992, AZD6244, BMS.536924, and MG.132, among other drugs, while patients in the high-risk group could be more sensitive to midostaurin, bleomycin, cytarabine, BMS.754807, and BX.795, among other drugs ().
Figure 6 Prediction of therapeutic sensitivity in patients with different risk scores.
Construction and Evaluation of the Predictive Nomogram
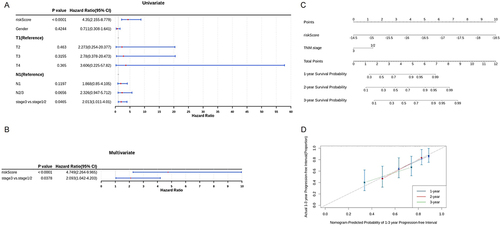
In this study, we selected independent prognostic factors using the univariate Cox regression analysis and calculated the hazard ratios (HRs) and 95% confidence intervals (CIs) for each variable. We found that the risk score and N stage were independent prognostic predictors for OS (). We constructed a prognostic model based on risk score and N stage using multivariable Cox regression analysis (). A nomogram was generated to predict the probability of 1-, 2-, and 3-year OS rates. Different factors were scored based on their proportional contribution to survival risk, as shown in . The calibration curves for the 1-, 2-, and 3-year OS probability results showed that the predicted survival rate was closely related to the actual survival rate (). These results indicated that the 4-gene signature was a reliable prognostic indicator in patients with ESCC.
Figure 7 Independent prognostic analysis and nomogram creation. (A and B) The independent predictors obtained by univariate (A) and multivariate (B) Cox regression analysis. (C) Construction of the nomogram to predict the probability of 1-, 2-, and 3-year overall survival (OS) rates; (D) The calibration curve of the nomogram.
Tissue-Level Q-PCR Validation
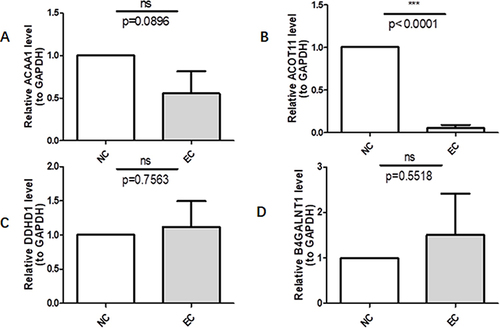
To further validate the results of this research, we compared the expression of prognostic genes in GSE53624 dataset and clinical samples by Q-PCR. Supplementary Figure 1 revealed the expression of B4GALNT1 and DDHD1 was significantly higher in ESCC samples than in the control samples, whereas the expression of ACAA1 and ACOT11 showed the opposite trend. After that, we analyzed six paired tumor and normal tissues using Q-PCR. As can be seen from , the expression trends of ACOT11 was significantly lower in EC tissues, and the expression of ACAA1 was slightly lower but not statistically significant. Although not significant, the expression of DDHD1 and B4GALNT1 was higher in EC tissues.
Figure 8 Validation of the prognostic genes’ expression by Q-PCR. ***p<0.001. (A) It represents the relative expression of ACAA1 in esophageal squamous cell carcinoma and normal tissue verified by PCR; (B) It represents the relative expression of ACOT11 in esophageal squamous cell carcinoma and normal tissue verified by PCR; (C) for B4GALNT1, and (D) for DDHD1.
Discussion
Esophageal squamous cell carcinoma (ESCC) has a high incidence and mortality rate,Citation27 and targeted therapies have been shown to play an important role in the treatment to improve the prognosis.Citation28 Lipid metabolism, which is associated with the tumor microenvironment,Citation13 may affect the responsiveness of the cancer cells to immunotherapy. In this study, we explored the mechanisms involved in the regulation of lipid metabolism in ESCC, identified differentially expressed genes and developed a prognosis predictive model for aiding clinical decision-making.
We comprehensively analyzed the GEO dataset and effectively identified 2562 DEGs (ESCC vs control) and 132 DELMGs were retained by overlapping DEGs and lipid metabolism-related genes for subsequent analysis. Based on the GO and KEGG enrichment analyses, these DELMGs were associated with “fatty acid metabolic process”, “unsaturated fatty acid metabolic process”, “lipid catabolic process”, “olefinic compound metabolic process”, and “icosanoid metabolic process”, “arachidonic acid metabolism”, “fatty acid degradation”, “linoleic acid metabolism”, “ether lipid metabolism”, and “glycerophospholipid metabolism”.
The enrichment of pathways related to fatty acid metabolism, unsaturated fatty acid metabolism, lipid catabolism, olefinic compound metabolism, and icosanoid metabolism underscores the significance of lipid metabolism alterations in esophageal squamous cell carcinoma. These pathways indicate an increased demand for energy, membrane synthesis, and signaling molecules in ESCC cells, promoting their proliferation and survival. Specifically, the enrichment of pathways like arachidonic acid metabolism, fatty acid degradation, linoleic acid metabolism, ether lipid metabolism, and glycerophospholipid metabolism highlights potential therapeutic targets in ESCC. Targeting these pathways may hold promise for developing novel treatments to combat ESCC progression. Further research is essential to elucidate the precise mechanisms involved.
Arachidonic acid is among the most abundant polyunsaturated fatty acids in human tissues, playing pivotal roles in both cellular membrane fluidity and serving as a substrate for various enzymes, ultimately leading to the generation of biologically active lipid mediators.Citation29 The intricate relationship between AA metabolism and esophageal squamous cell carcinoma (ESCC) has been a subject of interest. Wu et al, in their study,Citation30 constructed a protein-protein interaction (PPI) network based on key AA metabolism enzymes and conducted expression analysis. Their findings suggested that proteins interacting with essential enzymes in AA metabolism may influence the enzymatic activities, thereby contributing to the occurrence of ESCC. This intriguing observation highlights the potential interplay between lipid metabolism-related proteins and ESCC development. Furthermore, Zhi et alCitation31 uncovered changes in the expression of nine genes related to arachidonic acid (AA) metabolism when comparing tumor tissues to normal esophageal squamous epithelium. These findings emphasize the potential significance of AA metabolism in the context of ESCC and its potential role in disease progression. In the context of ESCC, these lipid metabolism-related genes are likely influencing several critical pathways. Among these, lipid metabolism has been linked to the regulation of various pathways, including inflammation, angiogenesis, and cell proliferation—processes essential for carcinogenesis. The interactions between AA metabolism-related genes and these pathways could potentially influence the tumor microenvironment and promote ESCC development. This suggests that modulating AA metabolism-related genes may offer innovative therapeutic directions for ESCC treatment. In summary, the differentially expressed lipid metabolism-related genes (DELMGs) identified in our study may be participating in ESCC initiation and progression through the aforementioned pathways. This opens up exciting avenues for potential therapeutic interventions and underscores the importance of lipid metabolism in ESCC development and progression. Further research in this area may lead to novel strategies for the treatment of ESCC.
Our study successfully identified and integrated four signature genes (ACAA1, ACOT11, B4GALNT1, and DDHD1) to establish a robust risk model based on differentially expressed lipid metabolism-related genes (DELMGs). This model effectively stratified patients in the GSE53622 cohort into high- and low-risk groups, demonstrating a significant association between the risk score and patient prognosis. The Kaplan-Meier (KM) survival analysis further illustrated the model’s ability to distinguish patients with distinct survival outcomes. Importantly, the risk model’s validity was tentatively confirmed through replication in the TCGA cohort, highlighting its potential for broader clinical application. We focusing on the four signature genes. ACAA1plays a crucial role in fatty acid metabolism. It is involved in the breakdown of long-chain fatty acids and is essential for energy production and lipid synthesis. While previous studies have highlighted ACAA1’s significance in various cancers, its specific role in ESCC warrants further investigation. ACOT11 is an enzyme involved in the hydrolysis of acyl-CoA compounds, influencing fatty acid metabolism. Its connection to ESCC and lipid metabolism in this context is an area ripe for exploration. B4GALNT1has been associated with altered glycosylation patterns in cancer. While its role in lipid metabolism may be indirect, it is important to examine its potential contributions to ESCC. DDHD1 has been implicated in various cellular processes, but its precise function in lipid metabolism remains unclear. Investigating its role in ESCC and lipid-related pathways could provide valuable insights into disease mechanisms. To date, their involvement in lipid metabolism pathways suggests a potential influence on tumor progression. These four genes, may participate in the development and progression of ESCC through various mechanisms. Firstly, their involvement in lipid metabolism could influence cellular membrane structure and function, as well as signaling pathways, thereby promoting cancer cell proliferation and invasion. Secondly, they may contribute to the synthesis of bioactive lipid mediators, such as inflammatory mediators, affecting the tumor microenvironment and immune evasion. Additionally, aberrant expression of these genes could lead to lipid metabolism dysregulation, further disrupting intracellular energy balance and impacting cancer cell survival and metabolic pathways. While further experimental validation and in-depth research are needed, these genes likely play significant roles in the occurrence and development of ESCC.
Moreover, we analyzed the immune status of different risk groups in an effort to clarify potential mechanisms regulated by characteristic genes. We found significant differences between high- and low-risk groups in T follicular helper cells, central memory CD4 T cells, memory B cells, type 1 T helper cells, MDSC, effector memory CD4 T cells, immature dendritic cells, activated dendritic cells, gamma delta T cells, and natural killer T cells. Besides immunocytes in the microenvironment, the expressions of immune checkpoints were significantly different, suggesting that different immune checkpoint inhibitors may have to be used for different groups.
In recent research on TME, it was found that the “ESCC ecosystem”, based on the large-scale single-cell RNA-seq results, contains large amounts of TEX, Treg, myeloid, TFH1, and GC B cell infiltration,Citation32 and the transmission of intermediate phenotypes fibroblasts induce T cell anergy and produce Treg cells,Citation33 leading to tumor immune escape,Citation34 which could be a possible mechanism explaining the impact of lipid metabolism dysregulation on prognosis. In this study, we inferred from the IC50 values of the 138 drugs that patients in the low-risk group might be more sensitive to RDEA119, BIBW2992 (afatinib), AZD6244, BMS.536924, and MG.132, while patients in the high-risk group might be more sensitive to midostaurin, bleomycin, cytarabine, BMS.754807, and BX.795. This indicates that different treatment strategies are required for high- and low-risk groups.
In conclusion, our study has identified four prognostic genes that hold promise for advancing the treatment strategies in esophageal squamous cell carcinoma (ESCC). These genes, ACAA1, ACOT11, B4GALNT1, and DDHD1, offer new directions for therapeutic interventions in ESCC. However, it is essential to acknowledge the limitations of our study: Firstly, our research was retrospective and based on a limited number of samples from publicly available databases. Expanding the sample size is imperative to enhance the robustness of our findings and ensure their broader applicability to diverse patient populations. Secondly, although we validated gene expression levels through Q-PCR, we recognize the need for further validation through additional animal experiments. The inclusion of functional studies will provide crucial insights into the roles of these genes in ESCC development and progression. Furthermore, the potential influence of various factors such as sample heterogeneity, experimental conditions, and data processing on the observed differences in gene expression should be meticulously addressed in future research. Moreover, exploring the genetic and molecular heterogeneity within ESCC patients could yield valuable insights into the variable responses to treatment and prognosis. Additionally, while our study focused on the prognostic implications of these genes, their precise mechanisms of action in ESCC remain to be elucidated. In-depth mechanistic studies will be essential to uncover the functional roles of ACAA1, ACOT11, B4GALNT1, and DDHD1 in ESCC pathogenesis.
In light of these challenges, our next steps will involve comprehensive investigations into the prognostic value and underlying mechanisms of these genes in ESCC. Addressing these limitations will guide our ongoing research efforts, ultimately bridging the gap between basic research and clinical application and improving outcomes for ESCC patients.
Conclusion
In conclusion, in this study, we preliminarily explored the mechanisms involved in the regulation of lipid metabolism in ESCC, identified four differently expressed signature genes related to lipid metabolism, and developed a risk model that can accurately predict the prognosis of ESCC. Our results demonstrated the practicability of a lipid metabolism-based risk model in clinical strategies for chemotherapy, targeted therapy, and immunotherapy to improve the prognosis of patients with ESCC.
Data Sharing Statement
All data generated or analysed during this study are included in this article. Further enquiries can be directed to the corresponding author.
Ethics Approval and Consent to Participate
This study was conducted with approval from the Ethics Committee of Inner Mongolia Cancer Hospital (KY202210). This study was conducted in accordance with the declaration of Helsinki. Informed consent was obtained from the study participants for the use of the tissue samples in your in viva validation prior to study commencement.
Disclosure
The authors declare that they have no competing interests in this work.
Acknowledgments
We would like to acknowledge the hard and dedicated work of all the staff that implemented the intervention and evaluation components of the study.
Additional information
Funding
References
- Zhang Z, Hu X, Qiu D, Sun Y, Lei L. Development and validation of a necroptosis-related prognostic model in head and neck squamous cell carcinoma. J Oncol. 2022;2022:8402568.
- Wu Z, Huang X, Cai M, et al. Novel necroptosis-related gene signature for predicting the prognosis of pancreatic adenocarcinoma. Aging. 2022;14(2):869–891. doi:10.18632/aging.203846
- Chen J, Wang H, Zhou L, et al. A necroptosis-related gene signature for predicting prognosis, immune landscape, and drug sensitivity in hepatocellular carcinoma. Cancer Med. 2022;11(24):5079–5096. doi:10.1002/cam4.4812
- Wu J, Li L, Zhang H, et al. A risk model developed based on tumor microenvironment predicts overall survival and associates with tumor immunity of patients with lung adenocarcinoma. Oncogene. 2021;40(26):4413–4424. doi:10.1038/s41388-021-01853-y
- Yang S, Cheng Y, Wang X, et al. Identification of the immune cell infiltration landscape in hepatocellular carcinoma to predict prognosis and guide immunotherapy. Front Genet. 2021;12:777931. doi:10.3389/fgene.2021.777931
- Thrift AP. Global burden and epidemiology of Barrett oesophagus and oesophageal cancer. Nat Rev Gastroenterol Hepatol. 2021;18(6):432–443. doi:10.1038/s41575-021-00419-3
- Yang Y-M, Hong P, Xu WW, et al. Advances in targeted therapy for esophageal cancer. Signal Transduct Target Ther. 2020;5(1):229. doi:10.1038/s41392-020-00323-3
- Smyth EC, Gambardella V, Cervantes A, et al. Checkpoint inhibitors for gastroesophageal cancers: dissecting heterogeneity to better understand their role in first-line and adjuvant therapy. Ann Oncol. 2021;32(5):590–599. doi:10.1016/j.annonc.2021.02.004
- Liu Z, Chen Z, Wang J, et al. Mouse avatar models of esophageal squamous cell carcinoma proved the potential for EGFR-TKI Afatinib and uncovered Src family kinases involved in acquired resistance. J Hematol Oncol. 2018;11(1):109. doi:10.1186/s13045-018-0651-z
- Bian X, Liu R, Meng Y, et al. Lipid metabolism and cancer. J Exp Med. 2021;218(1). doi:10.1084/jem.20201606
- Zhou X, Huang F, Ma G, et al. Dysregulated ceramides metabolism by fatty acid 2-hydroxylase exposes a metabolic vulnerability to target cancer metastasis. Signal Transduct Target Ther. 2022;7(1):370. doi:10.1038/s41392-022-01199-1
- Liu Y, Li C, Fang L, et al. Lipid metabolism–related lncRNA SLC25A21-AS1 promotes the progression of oesophageal squamous cell carcinoma by regulating the NPM1/c-Myc axis and SLC25A21 expression. Clin Transl Med. 2022;12(6):e944. doi:10.1002/ctm2.944
- Tao M, Luo J, Gu T, et al. LPCAT1 reprogramming cholesterol metabolism promotes the progression of esophageal squamous cell carcinoma. Cell Death Dis. 2021;12(9):845. doi:10.1038/s41419-021-04132-6
- Zhu Q, Huang L, Yang Q, et al. Metabolomic analysis of exosomal-markers in esophageal squamous cell carcinoma. Nanoscale. 2021;13(39):16457–16464. doi:10.1039/D1NR04015D
- Yin X, Wu Q, Hao Z, Chen L. Identification of novel prognostic targets in glioblastoma using bioinformatics analysis. Biomed Eng Online. 2022;21(1):26. doi:10.1186/s12938-022-00995-8
- Huang X, Liu S, Wu L, Jiang M, Hou Y. High throughput single cell RNA sequencing, bioinformatics analysis and applications. Adv Exp Med Biol. 2018;1068:33–43. doi:10.1007/978-981-13-0502-3_4
- Ritchie ME, Phipson B, Wu D, et al. limma powers differential expression analyses for RNA-sequencing and microarray studies. Nucleic Acids Res. 2015;43(7):e47. doi:10.1093/nar/gkv007
- Yu G, Wang LG, Han Y, He QY. clusterProfiler: an R package for comparing biological themes among gene clusters. OMICS. 2012;16(5):284–287. doi:10.1089/omi.2011.0118
- Engebretsen S, Bohlin J. Statistical predictions with glmnet. Clin Epigenetics. 2019;11(1):123. doi:10.1186/s13148-019-0730-1
- Liu TT, Li R, Huo C, et al. Identification of CDK2-related immune forecast model and ceRNA in lung adenocarcinoma, a pan-cancer analysis. Front Cell Dev Biol. 2021;9:682002. doi:10.3389/fcell.2021.682002
- Sachs MC. plotROC: a tool for plotting ROC curves. J Stat Softw. 2017;79(Code Snippet 2):2. doi:10.18637/jss.v0
- Hänzelmann S, Castelo R, Guinney J. GSVA: gene set variation analysis for microarray and RNA-seq data. BMC Bioinform. 2013;14(1):7. doi:10.1186/1471-2105-14-7
- Zhou Y, Che Y, Fu Z, Zhang H, Wu H. Triple-negative breast cancer analysis based on metabolic gene classification and immunotherapy. Front Public Health. 2022;10:902378. doi:10.3389/fpubh.2022.902378
- Geeleher P, Cox N, Huang RS, Barbour JD. pRRophetic: an R package for prediction of clinical chemotherapeutic response from tumor gene expression levels. PLoS One. 2014;9(9):e107468. doi:10.1371/journal.pone.0107468
- Li Q, Li M, Zheng K, Tang S, Ma S. Expression pattern analysis and drug differential sensitivity of cancer-associated fibroblasts in triple-negative breast cancer. Transl Oncol. 2021;14(1):100891. doi:10.1016/j.tranon.2020.100891
- Pan X, Jin X, Wang J, Hu Q, Dai B. Placenta inflammation is closely associated with gestational diabetes mellitus. Am J Transl Res. 2021;13(5):4068–4079.
- Codipilly DC, Wang KK. Squamous Cell Carcinoma of the Esophagus. Gastroenterol Clin North Am. 2022;51(3):457–484. PMID: 36153105. doi:10.1016/j.gtc.2022.06.005
- Testa U, Castelli G, Pelosi E. The molecular characterization of genetic abnormalities in esophageal squamous cell carcinoma may foster the development of targeted therapies. Curr Oncol. 2023;30(1):610–640. PMID: 36661697; PMCID: PMC9858483. doi:10.3390/curroncol30010048
- Martin SA, Brash AR, Murphy RC. The discovery and early structural studies of arachidonic acid. J Lipid Res. 2016;57(7):1126–1132. doi:10.1194/jlr.R068072
- Wu B, Bai C, Du Z, et al. The arachidonic acid metabolism protein-protein interaction network and its expression pattern in esophageal diseases. Am J Transl Res. 2018;10(3):907–924.
- Zhi H, Zhang J, Hu G, et al. The deregulation of arachidonic acid metabolism-related genes in human esophageal squamous cell carcinoma. Int J Cancer. 2003;106(3):327–333. doi:10.1002/ijc.11225
- Zhang X, Peng L, Luo Y, et al. Dissecting esophageal squamous-cell carcinoma ecosystem by single-cell transcriptomic analysis. Nat Commun. 2021;12(1):5291. doi:10.1038/s41467-021-25539-x
- Zheng Y, Chen Z, Han Y, et al. Immune suppressive landscape in the human esophageal squamous cell carcinoma microenvironment. Nat Commun. 2020;11(1):6268. doi:10.1038/s41467-020-20019-0
- Chen Z, Zhao M, Liang J, et al. Dissecting the single-cell transcriptome network underlying esophagus non-malignant tissues and esophageal squamous cell carcinoma. EBioMedicine. 2021;69:103459. doi:10.1016/j.ebiom.2021.103459