
Abstract
Purpose
The extracellular matrix in the tumor microenvironment are closely related to the development of tumors. This study’s primary aim is to study the association between prolyl 3-hydroxylase 1 (P3H1) which mainly expresses collagen in extracellular matrix and the progression and prognosis of bladder cancer (BC).
Methods
The clinical and transcriptome data were acquired from the cancer genome atlas database. BLCAsubtyping is used to evaluate tissue subtypes of BC. The COX proportional hazards can be used to evaluate the survival process’s influencing factors. Immunohistochemistry was used to identify differences in the expression of P3H1 in cancer and paired adjacent tissues. GSEA was used to investigate the underlying biological processes. Finally, ssGSEA, TIMER and pRRophetic were used to study the relationship between P3H1 and immune cell infiltration and drug sensitivity.
Results
The expression of P3H1 was substantially higher in highly invasive BC samples than in low invasive BC. P3H1 was an independent predictor of overall survival (HR = 1.12, p = 0.03). P3H1 expression was significantly higher in tumor tissues than adjacent normal tissues in clinical tissue samples, and was significantly higher in highly stage cancer than low stage cancer samples. Samples with high P3H1 expression had a higher level of immune cell infiltration and immune function, as well as a significant correlation with macrophage and dendritic cell infiltration and TGF-beta, Th1 cells, and macrophage regulation (cor >0.3, p <0.05). P3H1 high expression samples were substantially more sensitive to docetaxel, cisplatin, vinblastine, camptothecin, paclitaxel, and other medicines than P3H1 low expression samples.
Discussion
P3H1 is a possible oncogene and an independent predictor of poor prognosis in BC; it also has enhanced sensitivity to docetaxel, cisplatin, vinblastine, camptothecin, paclitaxel, and other medications.
Introduction
Bladder cancer (BC) is one of the most prevalent malignant tumors of the urinary system, and its prevalence is among the top 10 for all tumor types in humans. Only in 2018, the number of new cases and deaths reached 549,000 and 200,000, respectively.Citation1 Although the 5-year survival rate of these patients can reach 95.8% with early treatment, the recurrence rate of patients with high-grade T1 is greater than 45% and the rate of tumor progression is between 14–40%.Citation2,Citation3 Based on the current research of genome structure, it has been shown that the alteration of genetic material is still the primary cause of the beginning and progression of BC; therefore, it is particularly necessary to investigate the alteration of the bladder’s critical genes.Citation4,Citation5
Currently, it is known that the tumor microenvironment which mainly composed of stromal cells and immune cells is closely related to the occurrence, growth, and metastasis of tumors. Depending on the context and tumor type, immune cells can be either pro-tumor or anti-tumor. For example, regulatory T cells promote tumor development and progression by inhibiting anti-tumor immune response, cytotoxic T cells (CD8+) detect abnormal tumor antigens expressed on cancer cells and target them for destruction, while cytotoxic T cells can also inhibit angiogenesis by secreting interferon-γ in addition to killing tumor cells.Citation6 Stromal cells are another major component, with tumor-associated fibroblasts being the major component of the extracellular matrix with the three-dimensional macromolecular network composed of various macromolecular substances, such as collagen, proteoglycans, amino glycans, and other glycoproteins.Citation7,Citation8 Collagen is a significant component of the extracellular matrix, which can be secreted by fibroblasts, chondrocytes, myocytes, and other stromal cells.Citation9 It is capable of transmitting signals to cells that impact cell motility, adhesion, angiogenesis, and other functions, and subsequently reshaping the extracellular matrix to promote cancer.Citation10,Citation11 For instance, macrophages associated with tumors deposit, cross-link, and linearize type I collagen in fibrous collagen and type XIV collagen in microfibrous collagen, hence increasing tumor formation. The absence of type VI collagen in basement membrane collagen will alter the structure and biomechanical properties of the extracellular matrix, resulting in an increase in apoptosis and oxidative stress, a decrease in autophagy, and delayed cell regeneration.Citation12 Consequently, changes in the components of the extracellular matrix may play a role in the growth of tumors.
The collagen prolyl hydroxylase family (P3H1, P3H2, and P3H3) is necessary for collagen production, folding, and assembly. They are found in the endoplasmic reticulum and are iron-dependent 2-ketoglutarate dioxygenases.Citation13 The ectopic production of P3H2 and P3H3 will limit colony development in breast cancer cell lines with endogenous gene silencing.Citation14 Recent studies have found that the expression of P3H1 is significantly associated with poor prognosis of hepatocellular carcinoma, and it can shape the tumor microenvironment of clear cell renal cell carcinoma and correlate with drug treatment response, but the detailed mechanism is still unclear.Citation15,Citation16 P3H1 is currently regarded as a critical protein in high-grade intraepithelial neoplasia and adenocarcinoma; its expression level is positively correlated with mesenchymal molecular subtypes, and its high expression is associated with a poor prognosis for survival.Citation17 Moreover, hydroxylation of type I collagen by P3H1 is associated with bone metastasis and is implicated in osteosarcoma cell proliferation, migration, and invasion.Citation18 However, its biological function in BC is unknown.
In this study, TCGA database and clinical tumor tissue samples were used to evaluate the relationship between P3H1 expression and the clinical characteristics and tumor prognosis of BC, and to analyze the biological functions of P3H1. Finally, the relationship between P3H1 expression and immune infiltration and drug sensitivity was evaluated. The aim is to explore potential personalized therapeutic targets based on P3H1 expression levels.
Materials and Methods
Data and Patient Sources
Download the data format for BC FPKM transcriptome sequencing data from the cancer genome atlas database (TCGA) database (https://portal.gdc.cancer.gov/), which contains 413 cases of BC tissues and 19 cases of normal tissue. Using the human genome annotation files (ftp:/ftp.ncbi.nih.gov/genomes/) on the expression of matrix annotate, filter to obtain mRNA expression matrix. Several bioscores were obtained from Thorsson’s analysis for BC samples in the TCGA database.Citation19
After the approval of the Ethics Committee of the Second Hospital of Lanzhou University (number: 2023A-487), 19 tumor samples and paired paracancerous samples from patients who underwent radical cystectomy were collected from the Second Hospital of Lanzhou University. This study involving human participants was in accordance with the ethical standards of the institutional and national research committee and with the 1964 Helsinki Declaration and its later amendments or comparable ethical standards. Consent to participate informed consent was obtained from all individual participants included in the study. The clinical characteristics of the enrolled patients are shown in .
Table 1 The Clinical Characteristics of the Patients in the Study Sample Were Included
Survival Analysis
Limma is software for analyzing microarray or RNA-seq gene expression data.Citation20 The limma package was utilized to normalize the expression matrix and remove genes with an average expression of 0. Based on the median expression value of P3H1, samples were divided into high expression and low expression groups, and the “survival” and “survminer” package was used to analyze the Kaplan-Meier overall survival time (https://cran.r-project.org/package=survival, https://cran.r-project.org/package=survminer). Simultaneously, the expression differences of P3H1 in samples with various clinical features were compared. p <0.05 was regarded as the significance threshold for expression differences between groups.
Evaluation of Tissue Subtypes
The BLCAsubtyping softwareCitation21 could classify samples to be evaluated based on RNA transcription profile data and classification data for six tissue subtypes, including Baylor, UNC, MDA, Lund, CIT-Curie, and TCGA. In this study, a software package was utilized to classify BLCA samples in the TCGA database and to assess the expression differences of P3H1 in different tissue classification samples.
Analysis of Univariate and Multivariate COX Proportional Hazards Model
The COX proportional hazards model can be used to evaluate the survival process’s influencing elements. To further analyze the impact of P3H1 on the overall survival of patients, the clinical features of the analyzed samples, such as age, gender, clinical stage, tumor grade, and lymph node grade, were incorporated. Survival and the SurvMiner package were utilized for both univariate and multivariate analyses of overall survival. p <0.05 was regarded as the clinically predictive threshold.
Immunohistochemistry (IHC)
According to the relevant experimental procedures,Citation22 tissue-containing slides were dewaxed in xylene for 20 minutes after being roasted at 65 °C for 30 minutes. The slides were then put in citrate buffer and moistened with ethanol solution and clean water before being autoclaved for two minutes. Endogenous peroxidase was removed from the slides using 90% methanol and 3% hydrogen peroxide solution. The slides were then incubated with anti-human P3H1 (1:200; ab244326, Abcam) for 12 h at 4 °C and secondary antibody for 30 min at room temperature. The slides were then counterstained with hematoxylin, developed using a diaminobenzidine kit (Solarbio, Beijing, China), and examined under a microscope. For each slice, Average optical density (AOD, AOD=integrated optical density (IOD)/area) the values in five fields were evaluated and averaged using Image J (National Institutes of Health, USA) software for subsequent analysis.
Gene Set Enrichment Analysis
The Gene Set Enrichment Analysis (GSEA) approach was developed at the Broad Institute. GSEA ranks genes according to their degree of differential expression in the two types of samples and then tests whether a prespecified set of genes is enriched at the top or bottom of the ranking table.Citation23 The biological differences between samples with high and low expression were analyzed using entries from the Gene Ontology (GO) and Kyoto Encyclopedia of Genes and Genomes (KEGG) databases (|NES|>1, p<0.05).
Evaluation of Tumor Microenvironment Cell Infiltration
The ESTIMATE software suite was used to evaluate the stroma score, immune score, and estimate score of the TCGA database samples.Citation24 Single-sample gene enrichment analysis (ssGSEA) can evaluate the enrichment score in a single sample by sorting and normalizing the gene expression values of a given sample and employing the empirical cumulative distribution function of the genes in the feature and the remaining genes to generate enrichment scores.Citation25 The amount of immune cell infiltration and immune function pathway were analyzed by ssGSEA, and the link between P3H1 expression and immunity was assessed. Using the TIMER (https://cistrome.shinyapps.io/timer), we assessed the relationship between P3H1 expression level and tumor purity, B cells, CD8+T cells, CD4+T cells, macrophages, neutrophils, and dendritic cells infiltration.Citation26
Drug Sensitivity Assessment
The pRRophetic package uses the Cancer Genome Project gene expression matrix and drug processing information to predict clinical chemotherapeutic drug response based on the gene expression level of tumor patient samples.Citation27 The software package was used to evaluate the correlation between P3H1 gene expression and sensitivity to major bladder chemotherapy drugs. Simultaneously, immunotherapy information for advanced metastatic urothelial cancer was collected from the IMvigor210 package.Citation28
Statistical Methodology
This study’s statistics were produced using R4.1.1 software. Independent sample t-test was utilized to analyze the difference between two samples for quantitative data with normal distribution, non-parametric test was used for quantitative data with non-normal distribution, non-parametric test was used for different quantitative data, and the Log rank test was utilized for Kaplan-Meier analysis. For the correlation study, Pearson analysis was utilized. p <0.05 and cor > 0.30 were judged statistically significant.
Results
P3H1 Expression Was Significantly Upregulated in Tumor Tissues
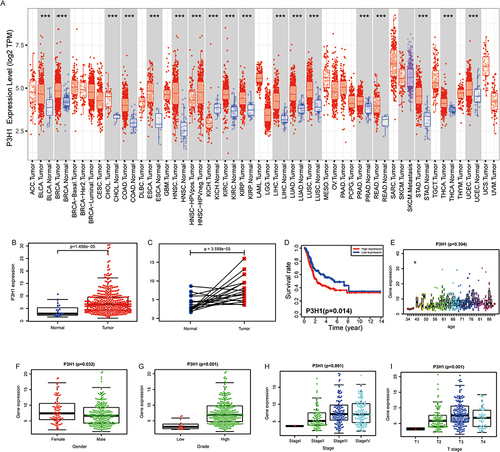
To determine if the expression of P3H1 was specific to tumor type and location, a pan-cancer investigation of common human cancers was performed. Except for renal chromophobe cell carcinoma, the expression of P3H1 was considerably greater in 16 common human tumor tissues (including the urogenital, digestive tract, respiratory tract, endocrine, and other tissues and organs) than in normal tissues ().
Figure 1 The association between the degree of P3H1 expression in tumors and the clinical characteristics of bladder cancer. (A) P3H1 expression in several types of cancers. (B) Differential expression of P3H1 in paired and unpaired bladder cancer tissues. (C) The expression of P3H1 in tumor tissues and matching paracancer tissues has been analyzed using TCGA data. (D) Kaplan-Meier survival analysis of patients with high or low P3H1 expression. (E-I) The distribution of P3H1 expression in various bladder cancer clinical features. “***” indicates p<0.001.
The Expression of P3H1 Was Associated with BC Clinical Progression Features
P3H1 expression was substantially greater in BC than in paired or unpaired normal tissues (p <0.05), according to our further analysis of the relationship between P3H1 expression and clinical features of BC ( and ). Patients with high P3H1 expression had a substantially poorer overall survival rate than those with low P3H1 expression (p =0.014) (). The expression of BC was substantially greater in male patients with high grade, high clinical stage, and high T grade than in female patients with low grade, low clinical stage, and low T grade (p <0.05) (). However, the expression distribution of P3H1 did not change significantly amongst individuals of different ages (p =0.304) ().
The Expression of P3H1 in Several Subtypes of BC Tissue Differed
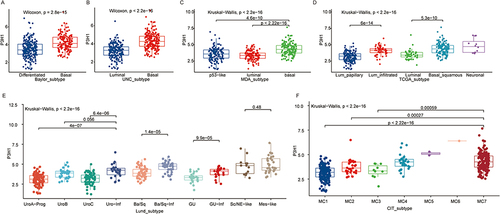
The tissue samples in the TCGA database have already been classified using six distinct classification algorithms. According to Baylor, UNC, MDA, and other categorization criteria, the expression of P3H1 in basal type samples was considerably greater than in the differentiated type, luminal type, p53 type, and other types of samples (p <0.05) (). According to TCGA and Lund classification standards, the expression of P3H1 in invasive BC was significantly higher than in papillary carcinoma, and the expression of P3H1 in squamous cells and other rare specific differentiation types was significantly higher than in luminal type (p <0.05) ( and ). According to the CIT classification concept, P3H1 expression was also substantially greater in MC7-type samples than in Mc1-3-type samples (p <0.05) ().
Figure 2 Distribution of P3H1 expression in different bladder cancer tissue subtypes. (A-F) Distribution of P3H1 in different subtypes of bladder cancer according to six different subtypes of tissue classification methods.
P3H1 Wan Independent Survival Predictor in Patients with BC
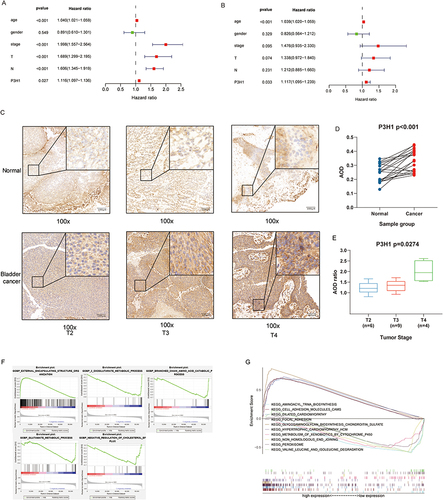
Using univariate proportional hazard model, the patient’s age, gender, clinical stage, pathological T grade, N grade, and P3H1 expression level were evaluated. The results showed that the patients’ age (HR 1.04, 95% CI 1.02–1.06, p<0.001), clinical stage (HR 2.00, 95% CI 1.56–2.56, p<0.001) and pathological T grade (HR 1.69, 95% CI 1.30–2.20, p<0.001), N grade (HR 1.61, 95% CI 1.35–1.92, p<0.001), and P3H1 expression level (HR 1.12, 95% CI 1.10–1.14, p=0.027) were significant overall survival risk variables (). Age (HR 1.04, 95% CI 1.02–1.06, p <0.001) and P3H1 (HR 1.11, 95% CI 1.10–1.24, p=0.033) were determined to be independent risk variables for overall survival by multivariate proportional hazard model (). The results of immunohistochemistry showed that the expression of P3H1 in tumor tissues was significantly higher than that in adjacent normal tissues, and the AOD ratio of tumor tissues to paired normal tissues increased significantly with T grade (p<0.05) ().
Figure 3 COX proportional hazards model, immunohistochemistry and gene set enrichment analysis. (A) Univariate COX proportional hazards model. (B) Multivariate COX proportional hazards model. (C) Expression of P3H1 in tissue samples with different T grades. (D) AOD difference analysis of immunohistochemistry staining between cancer tissues and paired adjacent tissues. (E) Distribution of AOD ratio between cancer tissue and paired adjacent tissue in patients with different T grades. (F) Gene enrichment analysis entries were performed for biological functions in the gene ontology database. (G) Gene enrichment analysis entries of key pathways in Kyoto encyclopedia of genes and genomes database were performed. AOD, average optical density.
Gene Enrichment Analysis
GSEA was used to enhance and examine the entries of biological functions in the GO database. The results indicate that P3H1 is primarily engaged in EXTERNAL ENCAPSULATING STRUCTURE ORGANIZATION (p <0.001, NES=2.56) and also downregulates OXOGLUTARATE METABOLIC PROCESS (p <0.001, NES=−2.03) and BRANCHED CHAIN AMINO ACID CATABOLIC PROCESS (p =0.0 04, NES=−2.01 (). Enrichment study of KEGG database entries revealed that cell adhesives were predominantly engaged in adhesives (p <0.001, NES=2.47) and FOCAL ADHESION (p <0.001, NES=2.60), GLYCOSAMINOGLYCAN BIOSYNTHASE CHONDROITIN SULFATE (p <0.001, NES=2.49) and other pathways ().
Immune Cell Infiltration Differed Between Samples with High and Low P3H1 Expression
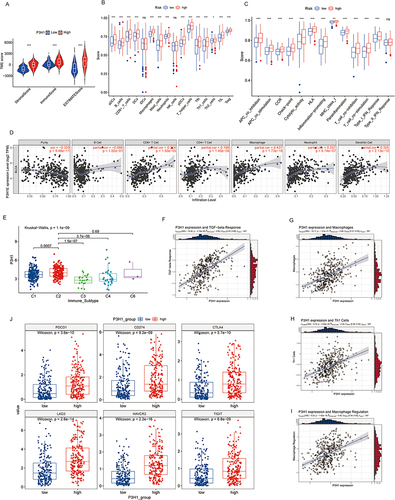
Based on the median P3H1 expression value, the samples in the TCGA database were classified as high or low risk. The immune score, stromal score, and estimate score of samples from the high-risk group were significantly higher than those from the low-risk group, according to the data (). In addition, we evaluated the difference in immune cell infiltration between the high and low risk groups and found that, with the exception of immature dendritic cells and NK cells, the infiltration levels of other immune cells in the high risk group samples were significantly greater than those in the low risk group samples (). Analysis of 13 immune-related pathways revealed that, with the exception of type II interferon response, samples from the two groups differed in other immune-related pathways (). The expression of P3H1 was shown to be correlated with macrophage infiltration (cor =0.44, p = 1.73E−18) and dendritic cells (cor =0.34, p = 2.13E−10) using the TIMER online tool ().
Figure 4 Analysis of the association between P3H1 high and low expression samples and immune cell infiltration. (A) Evaluation of stromal cells and immune cells in the microenvironment of tumor samples by estimation algorithm; (B and C) Differences in immune cell infiltration and functional activity in P3H1 high and low expression samples. (D) The correlation between P3H1 expression and immune cell infiltration was analyzed based on TIMER database. (E) Distribution of P3H1 on samples of different immune subtypes. (F-I) Correlation analysis between P3H1 and immune function based on Thomas’ study. (J) Distribution of immunotherapy target genes in high and low P3H1 expression samples. “*”, “**”, “****” indicates p<0.05,0.01,0.001, respectively.
P3H1 Was Expressed Differently by Several Immunological Subgroups
We categorized the TCGA database population into five immunological subtypes using information from the Thorsson research. C2(IFN-gamma dominant) P3H1 was substantially more highly expressed than C1(wound healing), C3(inflammatory), and C4(lymphocyte deficient) (p <0.05) (). The expression of P3H1 was connected with TGF-beta response, macrophage infiltration, Th1 cell infiltration, macrophage regulation, and other biological processes (cor >0.3, p <0.05) according to a correlation study (). The expression of six immunotherapy-related genes, including PDCD1, CD274, CTLA4, LAG3, HAVCR2, and TIGIT, was significantly higher in the high risk group than in the low risk group (p <0.05), according to a further analysis of the expression differences of immunotherapy-related genes in samples from individuals with high and low risk ().
Drug Sensitivity Estimation for Samples from High-Low Risk Groups
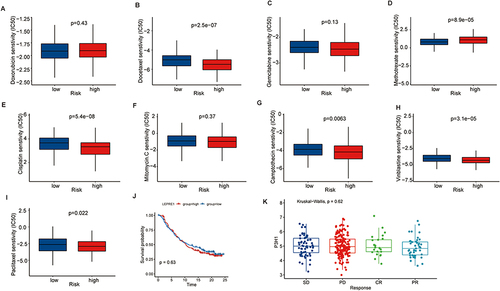
The drug sensitivity prediction of popular chemical medicines in BC revealed that the P3H1 high expression samples were more sensitive to docetaxel, cisplatin, vinblastine, camptothecin, paclitaxel, and other treatments, but they were less sensitive to methotrexate (p <0.05). There was no significant difference in drug sensitivity between the two groups for doxorubicin, gemcitabine, mitomycin, and other routinely used medicines in clinical practice (p >0.05) (). Simultaneously, the relationship between P3H1 and immunotherapy (atezolizumab) was evaluated, and it was discovered that after immunotherapy, the overall survival time of patients in the high and low risk groups was not significantly improved, and there was no difference in gene expression levels between the treatment effective and treatment ineffective groups (p >0.05) ( and ).
Figure 5 Prediction of drug sensitivity based on P3H1 expression. (A-I) To predict the sensitivity of chemical drugs commonly used in bladder cancer. (J) Kaplan-Meier analysis of overall survival after treatment with atezolizumab in patients with high and low P3H1 expression. (K) Distribution of P3H1 expression in samples with different immunotherapy outcomes.
Discussion
The survival prognosis for BC patients has greatly improved in recent years due to the development of innovative surgical procedures, chemical medications, immunological drugs, and other therapy methods; nonetheless, there remain many restrictions.Citation29 In addition, the crucial treatment BC is to design a systematic treatment strategy for diverse tumor progression and recurrence mechanisms. In order to enhance the prognosis of BC patients, it is crucial to investigate the many progression mechanisms of the disease.
P3H1 is frequently upregulated in human tumor tissues compared to normal tissues, and it may be a potential oncogene; its expression level has been shown to be elevated in solid tumors including osteosarcoma, pancreatic cancer, colorectal cancer, breast cancer, and lung cancer.Citation18,Citation30–32 In a particular investigation of BC, it was discovered that individuals with high expression of this gene had a poorer clinical stage, pathological grade, and overall survival prognosis. We discovered that the expression levels of tissue subtypes also differed considerably based on their distinct biological roles. For instance, basal-type samples mostly include factor and cytokine receptor families, Toll-like receptor (TLR) and chemokine (CXCL) families, suggesting the presence of inflammation and immune infiltration in the microenvironment.Citation33 In differentiated samples, however, they are predominantly implicated in fatty acid metabolism, drug metabolism, and the peroxisome proliferator-activated receptor pathway.Citation34 These distinct subtype classifications will assist in the development of more precise therapies and suggest a possible association between P3H1 and these functions.
Gene enrichment analysis revealed that P3H1 was primarily involved in extracellular matrix composition and the down-regulation of oxidized glutarate and branched chain amino acid catabolism. Collagen makes up the majority of the extracellular matrix, and different quantities of collagen (mostly types I, III, IV, VI, and XII) make up the majority of the lamina propria and muscularis of the bladder and contribute to bladder function.Citation35 In the process of cancer initiation and progression, the dysregulation of oxidized glutarate metabolism has been demonstrated to disrupt cellular REDOX homeostasis, interfere with substrate flow, and result in the buildup of tumor metabolites.Citation36 Enrichment study of the KEGG pathway revealed that critical pathways such as cell adhesion and mucopolysaccharide production chondroitin were significantly enriched.Citation37 Cell adhesion is a major modulator of cancer development and a hallmark of cancer promotion via immune evasion and metastasis. Current studies have also demonstrated the strong relationship between the P3H1 mutation and osteogenesis imperfecta.Citation38 These biological activities and critical pathways represent a putative method by which P3H1 affects the growth of tumors.
Tumor-related immune cell infiltration can significantly promote the formation and metastasis of lymphatic vessels in bladder cancer.Citation39 The correlation study revealed a favorable correlation between P3H1 and macrophage and dendritic cell invasion. Under the influence of various circumstances, macrophages can be polarized into two phenotypes of cells, M1 macrophages having pro-inflammatory and anti-tumor effects and M2 macrophages supporting angiogenesis, blocking pro-tumor immune response.Citation40 Currently, it has been shown that tumor-associated macrophages govern the continuing growth of BC by secreting type I collagen, which can activate the PI3K/AKT signaling pathway.Citation41 Dendritic cells are the most potent antigen-presenting cells in the immune system and play a crucial role in the initiation and regulation of the immune response.Citation42 The primary mechanism is the absorption of tumor antigens, the high membrane expression of MHCI and MHCII molecules, and the activation of tumor-specific T-lymphocytes.Citation43,Citation44 The relationship between immunotherapy-related target genes (PDCD1, CD274, CTLA4, LAG3, HAVCR2, and TIGIT) and P3H1 was further studied based on the influence of dendritic cells on immunotherapy. Compared to low expression samples, the high expression of P3H1 may facilitate immune evasion, and the expression of P3H1 is closely associated with TGF-beta, Th1 cell infiltration, and macrophage regulation, of which TGF-beta and M2 macrophages are known to be associated with immune suppression.Citation45 Immunotherapy did not increase overall survival and immunological response in patients with high P3H1 expression, according to IMvigor210 immunotherapy data. Therefore, the high expression of P3H1 may have a regulatory influence on immunity via the collagen of the extracellular matrix, which may be the mechanism of tumor growth, but it is incompatible with immunotherapy. The particular mechanism requires additional investigation.
Finally, the sensitivity of prevalently used clinical chemical drugs was predicted, and it was discovered that docetaxel, cisplatin, vinblastine, camptothecin, paclitaxel, and other drugs may exhibit greater sensitivity in individuals with high P3H1 expression. This information can be used to guide the medication of patients in clinical practice and improve the prognosis of patients. In conclusion, this study identified an oncogene significantly associated with the clinical progression and prognosis of BC, analyzed its potential biological function, and predicted its relationship with drug sensitivity in order to provide a foundation for the clinical treatment of patients.
Conclusions
P3H1 is a possible oncogene and an independent predictor of poor prognosis in BC; it also has enhanced sensitivity to docetaxel, cisplatin, vinblastine, camptothecin, paclitaxel.
Data Accessibility
Publicly available datasets were analyzed in this study, these can be found in IMvigor210 cohort (http://research-pub.gene.com/IMvigor210CoreBiologies/packageVersions/), The Cancer GenomeAtlas (https://portal.gdc.cancer.gov).
Author Contributions
All of the authors contributed significantly to the work that was published, whether it was through conception, study design, execution, data acquisition, analysis, and interpretation, or in all of these areas; they all contributed to draft, revise, or critically review the article; they approved the final version that was published; they all agreed on the journal to which the article was submitted; and they all agreed to take responsibility for the work in its entirety.
Disclosure
The authors declare that the research was conducted in the absence of any commercial or financial relationships that could be construed as a potential conflict of interest.
Acknowledgments
This work was supported by the National Natural Science Foundation of China (grant No.82372685); Medical Science and Technology Research Fund Project of Guangdong Province of China (grant No. B2023489).
References
- Bray F, Ferlay J, Soerjomataram I, et al. Global cancer statistics 2018: GLOBOCAN estimates of incidence and mortality worldwide for 36 cancers in 185 countries. CA Cancer J Clin. 2018;68(6):394–424. doi:10.3322/caac.21492
- Slovacek H, Zhuo J, Taylor JM. Approaches to Non-Muscle-Invasive Bladder Cancer. Curr Oncol Rep. 2021;23(9):105. doi:10.1007/s11912-021-01091-1
- Chen X, Zhang J, Ruan W, et al. Urine DNA methylation assay enables early detection and recurrence monitoring for bladder cancer. J Clin Invest. 2020;130(12):6278–6289. doi:10.1172/JCI139597
- Nakauma-González JA, Rijnders M, Van Riet J, et al. Comprehensive Molecular Characterization Reveals Genomic and Transcriptomic Subtypes of Metastatic Urothelial Carcinoma. Eur Urol. 2022;81(4):331–336. doi:10.1016/j.eururo.2022.01.026
- Xie R, Cheng L, Huang M, et al. NAT10 Drives Cisplatin Chemoresistance by Enhancing ac4C-Associated DNA Repair in Bladder Cancer. Cancer Res. 2023;83(10):1666–1683. doi:10.1158/0008-5472.CAN-22-2233
- Anderson NM, Simon MC. The tumor microenvironment. Current Biol. 2020;30(16):R921–R925. doi:10.1016/j.cub.2020.06.081
- Theocharis AD, Skandalis SS, Gialeli C, et al. Extracellular matrix structure. Adv Drug Deliv Rev. 2016;97:4–27. doi:10.1016/j.addr.2015.11.001
- Naba A, Pearce OMT, Del Rosario A, et al. Characterization of the Extracellular Matrix of Normal and Diseased Tissues Using Proteomics. J Proteome Res. 2017;16(8):3083–3091. doi:10.1021/acs.jproteome.7b00191
- Kadler KE, Baldock C, Bella J, et al. Collagens at a glance. Journal of Cell Science. 2007;120(12):1955–1958. doi:10.1242/jcs.03453
- Lou J, Stowers R, Nam S, et al. Stress relaxing hyaluronic acid-collagen hydrogels promote cell spreading, fiber remodeling, and focal adhesion formation in 3D cell culture. Biomaterials. 2018;154:213–222. doi:10.1016/j.biomaterials.2017.11.004
- Appert-Collin A, Bennasroune A, Jeannesson P, et al. Role of LRP-1 in cancer cell migration in 3-dimensional collagen matrix. Cell Adh Migr. 2017;11(4):316–326. doi:10.1080/19336918.2016.1215788
- Lamandé SR, Bateman JF. Collagen VI disorders: insights on form and function in the extracellular matrix and beyond. Matrix Biol. 2018;71-72:348–367. doi:10.1016/j.matbio.2017.12.008
- Vranka JA, Sakai LY, Bächinger HP. Prolyl 3-hydroxylase 1, enzyme characterization and identification of a novel family of enzymes. J Biol Chem. 2004;279(22):23615–23621. doi:10.1074/jbc.M312807200
- Shah R, Smith P, Purdie C, et al. The prolyl 3-hydroxylases P3H2 and P3H3 are novel targets for epigenetic silencing in breast cancer. Br J Cancer. 2009;100(10):1687–1696. doi:10.1038/sj.bjc.6605042
- Ding R, Zhao C, Jing Y, et al. Basement membrane-related regulators for prediction of prognoses and responses to diverse therapies in hepatocellular carcinoma. BMC Med Genomics. 2023;16(1):81. doi:10.1186/s12920-023-01504-z
- Zhou P, Liu Z, Hu H, et al. Comprehensive Analysis of Senescence Characteristics Defines a Novel Prognostic Signature to Guide Personalized Treatment for Clear Cell Renal Cell Carcinoma. Front Immunol. 2022;13:901671. doi:10.3389/fimmu.2022.901671
- Zhang Y, C-Y L, Pan M, et al. Exploration of the Key Proteins of High-Grade Intraepithelial Neoplasia to Adenocarcinoma Sequence Using In-Depth Quantitative Proteomics Analysis. J Oncol. 2021;2021:5538756. doi:10.1155/2021/5538756
- Huang Z, Wang Q, Wang Y, et al. Upregulated LEPRE1 correlates with poor outcome and its knockdown attenuates cells proliferation, migration and invasion in osteosarcoma. Anticancer Drugs. 2020;31(4):326–332. doi:10.1097/CAD.0000000000000851
- Thorsson V, Gibbs DL, Brown SD, et al. The Immune Landscape of Cancer. Immunity. 2018;48(4):812–830.e14. doi:10.1016/j.immuni.2018.03.023
- Ritchie ME, Phipson B, Wu D, et al. limma powers differential expression analyses for RNA-sequencing and microarray studies. Nucleic Acids Res. 2015;43(7):e47. doi:10.1093/nar/gkv007
- Kamoun A, De Reyniès A, Allory Y, et al. A Consensus Molecular Classification of Muscle-invasive Bladder Cancer. Eur Urol. 2020;77(4):420–433. doi:10.1016/j.eururo.2019.09.006
- Sternberger LA, Hardy PH, Cuculis JJ, et al. The unlabeled antibody enzyme method of immunohistochemistry: preparation and properties of soluble antigen-antibody complex (horseradish peroxidase-anti horseradish peroxidase) and its use in identification of spirochetes. J Histochem Cytochem. 1970;18(5):315–333. doi:10.1177/18.5.315
- Subramanian A, Tamayo P, Mootha VK, et al. Gene set enrichment analysis: a knowledge-based approach for interpreting genome-wide expression profiles. Proc Natl Acad Sci U S A. 2005;102(43):15545–15550. doi:10.1073/pnas.0506580102
- Yoshihara K, Shahmoradgoli M, Martínez E, et al. Inferring tumour purity and stromal and immune cell admixture from expression data. #N/A. 2013;4:2612.
- Hänzelmann S, Castelo R, Guinney J. GSVA: gene set variation analysis for microarray and RNA-seq data. BMC Bioinf. 2013;14:7. doi:10.1186/1471-2105-14-7
- Li T, Fan J, Wang B, et al. TIMER: a Web Server for Comprehensive Analysis of Tumor-Infiltrating Immune Cells. Cancer Res. 2017;77(21):e108–e110. doi:10.1158/0008-5472.CAN-17-0307
- Geeleher P, Cox N, Huang RS. pRRophetic: an R package for prediction of clinical chemotherapeutic response from tumor gene expression levels. PLoS One. 2014;9(9):e107468. doi:10.1371/journal.pone.0107468
- Mariathasan S, Turley SJ, Nickles D, et al. TGFβ attenuates tumour response to PD-L1 blockade by contributing to exclusion of T cells. Nature. 2018;554(7693):544–548. doi:10.1038/nature25501
- Saginala K, Barsouk A, Aluru JS, et al. Epidemiology of Bladder Cancer. Med sci. 2020;8(1). doi:10.3390/medsci8010015
- Kehlet SN, Sanz-Pamplona R, Brix S, et al. Excessive collagen turnover products are released during colorectal cancer progression and elevated in serum from metastatic colorectal cancer patients. Sci Rep. 2016;6:30599. doi:10.1038/srep30599
- Willumsen N, Bager CL, Leeming DJ, et al. Serum biomarkers reflecting specific tumor tissue remodeling processes are valuable diagnostic tools for lung cancer. Cancer Medicine. 2014;3(5):1136–1145. doi:10.1002/cam4.303
- Bager CL, Willumsen N, Leeming DJ, et al. Collagen degradation products measured in serum can separate ovarian and breast cancer patients from healthy controls: a preliminary study. Cancer Biomark. 2015;15(6):783–788. doi:10.3233/CBM-150520
- Rakoff-Nahoum S, Medzhitov R. Toll-like receptors and cancer. Nat Rev Cancer. 2009;9(1):57–63. doi:10.1038/nrc2541
- Mo Q, Nikolos F, Chen F, et al. Prognostic Power of a Tumor Differentiation Gene Signature for Bladder Urothelial Carcinomas. J National Cancer Institute. 2018;110(5):448–459. doi:10.1093/jnci/djx243
- Hoogenkamp HR, Pot MW, Hafmans TG, et al. Scaffolds for whole organ tissue engineering: construction and in vitro evaluation of a seamless, spherical and hollow collagen bladder construct with appendices. Acta Biomater. 2016;43:112–121. doi:10.1016/j.actbio.2016.07.022
- Chang L-C, Chiang S-K, Chen S-E, et al. Targeting 2-oxoglutarate dehydrogenase for cancer treatment. Am J Cancer Res. 2022;12(4):1436–1455.
- Läubli H, Borsig L. Altered Cell Adhesion and Glycosylation Promote Cancer Immune Suppression and Metastasis. Front Immunol. 2019;10:2120. doi:10.3389/fimmu.2019.02120
- Bala MM, Bala KA. Severe cases of osteogenesis imperfecta type VIII due to a homozygous mutation in P3H1 (LEPRE1) and review of the literature. Adv Clin Exp Med. 2021;30(12):1233–1238. doi:10.17219/acem/141367
- Zhang Q, Liu S, Wang H, et al. ETV4 Mediated Tumor-Associated Neutrophil Infiltration Facilitates Lymphangiogenesis and Lymphatic Metastasis of Bladder Cancer. Adv. Sci. 2023;10(11):e2205613. doi:10.1002/advs.202205613
- Chen Y, Song Y, Du W, et al. Tumor-associated macrophages: an accomplice in solid tumor progression. J Biomed Sci. 2019;26(1):78. doi:10.1186/s12929-019-0568-z
- Qiu S, Deng L, Liao X, et al. Tumor-associated macrophages promote bladder tumor growth through PI3K/AKT signal induced by collagen. Cancer Sci. 2019;110(7):2110–2118. doi:10.1111/cas.14078
- Honda K, Yanai H, Negishi H, et al. IRF-7 is the master regulator of type-I interferon-dependent immune responses. Nature. 2005;434(7034):772–777. doi:10.1038/nature03464
- Shortman K, Naik SH. Steady-state and inflammatory dendritic-cell development. Nat Rev Immunol. 2007;7(1):19–30. doi:10.1038/nri1996
- Huang M, Dong W, Xie R, et al. HSF1 facilitates the multistep process of lymphatic metastasis in bladder cancer via a novel PRMT5-WDR5-dependent transcriptional program. Cancer Communications. 2022;42(5):447–470. doi:10.1002/cac2.12284
- Souza-Fonseca GF, Rossi GR, Dagley LF, et al. TGF-β and CIS inhibition overcomes NK cell suppression to restore anti-tumor immunity. Cancer Immunol Res. 2022;10(9):1047–1054. doi:10.1158/2326-6066.CIR-21-1052