 ?Mathematical formulae have been encoded as MathML and are displayed in this HTML version using MathJax in order to improve their display. Uncheck the box to turn MathJax off. This feature requires Javascript. Click on a formula to zoom.
Abstract
The clinical importance of microparticles resulting from vesiculation of platelets and other blood cells is increasingly recognized, although no standardized method exists for their measurement. Only a few studies have examined the analytical and preanalytical steps and variables affecting microparticle detection. We focused our analysis on microparticle detection by flow cytometry. The goal of our study was to analyze the effects of different centrifugation protocols looking at different durations of high and low centrifugation speeds. We also analyzed the effect of filtration of buffer and long-term freezing on microparticle quantification, as well as the role of Annexin V in the detection of microparticles. Absolute and platelet-derived microparticles were 10- to 15-fold higher using initial lower centrifugation speeds at 1500 × g compared with protocols using centrifugation speeds at 5000 × g (P < 0.01). A clear separation between true events and background noise was only achieved using higher centrifugation speeds. Filtration of buffer with a 0.2 μm filter reduced a significant amount of background noise. Storing samples for microparticle detection at −80°C decreased microparticle levels at days 28, 42, and 56 (P < 0.05 for all comparisons with fresh samples). We believe that staining with Annexin V is necessary to distinguish true events from cell debris or precipitates. Buffers should be filtered and fresh samples should be analyzed, or storage periods will have to be standardized. Higher centrifugation speeds should be used to minimize contamination by smaller size platelets.
Introduction
Microparticles have been shown to be universal markers of activation, cell injury, or apoptosis in eukaryotic cells.Citation1 In addition, microparticles have diagnostic and functional roles, especially as mediators of cellular interactions, such as inflammation or coagulation.Citation1–Citation3 The clinical importance of microparticles is being increasingly recognized, although no standardized method exists for their measurement.
These vesicles are the product of exocytic budding and consist of cytoplasmic components and phospholipids. During microparticle release, the normal asymmetric distribution of phospholipids between the two leaflets of the plasma membrane is lost, resulting in phospholipid exposure.Citation1 Typically, microparticles are smaller than 1.0 μm, expose the anionic phospholipid phosphatidylserine on the outer leaflet of their membrane, and carry surface membrane antigens reflecting their cell of origin, including those induced by cellular activation, cell injury, or apoptosis.Citation4 These properties permit detection of specific subpopulations, such as endothelial or platelet-derived microparticles.Citation5 Different subpopulations of microparticles have already been found to be of clinical significance in various vascular disorders.Citation6 Because there is no uniform consensus regarding the definition and detection of microparticles, the levels of microparticles depend on the detection technique, which makes it difficult to compare results across different studies. Therefore, optimization and standardization of detection methods are important to define microparticles correctly and to avoid falsely high or low quantification.
Only a few studies have examined how levels of microparticles are affected by analytical and also preanalytical steps and variables. Some studies have looked at preanalytical variables, including blood sampling, anticoagulation in collection tubes,Citation7 needle size,Citation7 and thawing temperature.Citation8 Other investigators have studied the effect of centrifugation protocols on microparticle detection,Citation7 use of isotype controls for flow cytometry,Citation9 and use of calibrated beads for microparticle detection.Citation10
The goal of our study was to optimize further the method of flow cytometry for detection of microparticles and facilitate standardization of protocols. We analyzed the effects of different centrifugation protocols, filtration of buffer, and long-term freezing on microparticle quantification in healthy controls. In addition, we analyzed the role of Annexin V in the detection of microparticles. Ideally, the true level of microparticles should be detected and microparticles should be distinguishable from cell debris or other precipitates.
Materials and methods
Blood samples
The optimization of microparticle detection was performed using healthy controls. Written informed consent was obtained from 10 healthy donors (six female and four male donors) under a study protocol approved by the local Institutional Review Board. Citrated blood (18 mL) was collected in an atraumatic fashion using a 21-gauge needle. The first 3 mL were discarded. The samples were processed within two hours.
Preparation of platelet-poor plasma
Platelet-poor plasma was obtained using three different centrifugation protocols (). Each centrifugation protocol included two steps. The initial step for protocol 1 consisted of two centrifugations at 5000 × g for five minutes at room temperature. After the first centrifugation at 5000 × g for five minutes, the supernatant was transferred into a new tube, leaving 200 μL above the cell pellet, and was centrifuged again for five minutes at 5000 × g. In protocol 2, platelet-poor plasma was obtained by an initial single centrifugation at 5000 × g for 15 minutes, and in protocol 3 by centrifugation at 1500 × g for 15 minutes. After centrifugation, the supernatant was transferred into a new tube, while discarding the last 500 μL at the base of the centrifuged tube. Aliquots of 500 μL were stored at −80°C. After thawing quickly at 37°C, a microparticle pellet was obtained from the platelet-poor plasma by a second centrifugation step at 17,000 × g for either 20 or two minutes. Subsequently, the supernatant was discarded and the microparticle pellet was reconstituted in Annexin V buffer (Becton Dickinson, Franklin Lakes, NJ) at 4°C. All buffers were sterile-filtered with a 0.2 μm filter (Whatman, Piscataway, NJ).
Table 1 Three different centrifugation protocols used to detect microparticles
Labeling with antibodies and Annexin V
The purpose of this study was not to analyze different panels of surface markers to define the cellular origin of microparticles. Therefore, we focused on two different surface markers or combinations to define endothelial-/leukocyte-derived microparticles (CD31+/CD42–) and platelet-derived microparticles (CD31+/CD42a+), especially as platelet-derived microparticles are the most common microparticles found in the circulating blood.
After obtaining a microparticle pellet from platelet-poor plasma, this isolated microparticle pellet was resuspended in 440 μL Annexin V binding buffer (diluted 1:10 in distilled water). All buffers were sterile-filtered with 0.2 μm filter (Whatman). 60 μL Annexin V-fluorescein isothiocyanate (diluted 1:10 in Annexin V binding buffer) was added. A volume of 40 μL microparticle-Annexin suspension was labeled with 10 μL of fluorescent antibodies phycoerythrin (PE)-conjugated CD31 (Becton Dickinson) and peridinin-chlorophyll-protein (PerCP) complex-conjugated CD42a (Becton Dickinson diluted in phosphate-buffered saline without CaCl2 and MgCl2 [14190–094; Gibco, Billings, MT] 1:3). TruCount tubes (Becton Dickinson) with a known number of fluorescent beads were utilized for quantification containing 40 μL of Annexin-fluorescein isothiocyanate (FITC)-labeled microparticle suspension.
The samples were incubated for 15 minutes in the dark at room temperature, then diluted in 200 μL of Annexin V binding buffer and immediately analyzed on a Becton Dickinson FACSCanto with the appropriate software (FACSDiva).
Microparticle enumeration by flow cytometry
For the detection of microparticles by flow cytometry, an initial microparticle-size gate was set with the help of calibrating fluorescent 0.8 μm and 3.0 μm latex beads (Sigma, St. Louis, MO). This microparticle gate excludes the electronic background noise through the threshold. In parallel, we used Megamix (American Diagnostic, Hauppauge, NY), a mixture of microbeads of three different sizes (0.5 μm, 0.9 μm, and 3.0 μm) which was developed to confirm the size of the microparticles.
Forward scatter and side scatter had a logarithmic gain. The absolute count of microparticles was measured setting the stop condition for TruCount beads at 10,000 events. In order to separate true events from background noise and unspecific binding of antibodies to debris, we defined microparticles as particles that were less than 1.0 μm in diameter, had positive staining for Annexin V, and expressed surface antigens (CD31 or CD42, or both). Because isotype controls may generate falsely negative or positive microparticles,Citation9 we evaluated the background by using a control in which all stains were used, except for the two colors of interest. This is a modified version of the technique named “fluorescence minus one”.Citation11,Citation12
Filtration
Samples from the 10 healthy donors were analyzed with sterile-filtered and nonsterile-filtered Annexin V buffer. Microparticle detection was compared using these two different filter settings. Briefly, Annexin V buffer was diluted in distilled water 1:10. After dilution, the whole suspension was sterile-filtered with a 0.2 μm filter (Whatman) or remained unfiltered. Afterwards, the centrifugation protocols 1, 2, and 3 were applied to measure the effect of filtration on microparticle detection.
Storage
In order to analyze the effect of freezing, microparticle pellets were obtained and analyzed from fresh and frozen samples of six healthy donors. To study the effect of different storage durations at −80°C, the samples were analyzed immediately and after 24 hours, and then after two, four, six, and eight weeks of freezing in separate individual aliquots. Again, after thawing quickly at 37°C, a microparticle pellet was obtained by a second centrifugation step of 17,000 × g for 20 minutes. Subsequently the supernatant was discarded and the microparticle pellet was reconstituted in Annexin V buffer (Becton Dickinson) at 4°C.
Statistics
Statistical analysis was carried out using MedCalc software (MedCalc, Mariakerke, Belgium) by applying the Kolmogorov–Smirnov procedure for testing a normal distribution and the paired t-test for testing significant differences between levels of microparticles. Results are expressed as mean ± standard deviation.
Results
Detection of circulating microparticles
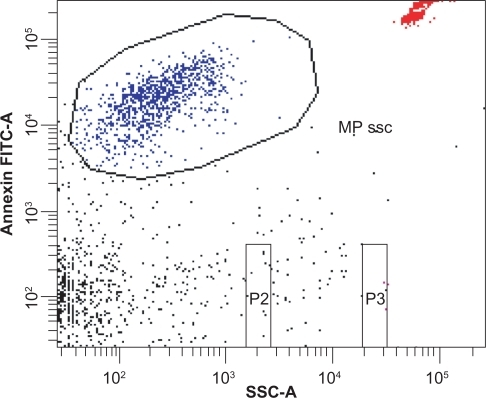
demonstrates the detection of circulating microparticles. The microparticle size gate was set with the help of fluorescent 0.8 μm and 3.0 μm latex beads. Microparticles were identified by size and Annexin V-fluorescein isothiocyanate labeling. TruCount beads were used for quantification. Microparticles were defined as particles that were less than 1.0 μm in diameter, had positive staining for Annexin V, and expressed surface antigens (CD31 or CD42, or both).
Figure 1 Detection of circulating microparticles. The microparticle gate was set according to Annexin V binding and size. Particle size was determined by 0.8 μm and 3.0 μm latex beads (beads not shown). TruCount beads were used for quantification (see upper right corner).
Centrifugation
The effect of centrifugation on detection and quantification of microparticles was analyzed comparing three different centrifugation protocols (). In all protocols, the majority of detected microparticles were of platelet origin (CD31+/CD42a+). Endothelial-/leukocyte-derived microparticles (CD31+/CD42a–) were found 50 to 100 times less often. All microparticle values are shown in . The absolute amount of microparticles was not significantly different comparing centrifugation protocol 1 (mean 608 ± 244 microparticles/μL) and 2 (mean 870 ± 390 microparticles/μL, P = 0.1318) using the second centrifugation step for 20 minutes. In contrast, protocol 3 showed significantly higher absolute microparticle counts when compared with either protocol 1 or 2 (mean 7928 ± 3894 microparticles/μL, P < 0.0006, see and ). With an initial centrifugation at 1500 × g (protocol 3) we also detected a 10- to 15-fold higher amount of platelet-derived microparticles compared with the protocols with an initial centrifugation at 5000 × g (). There was no significant increase in endothelial-/leukocyte-derived microparticles using protocol 3 (P > 0.05).
Figure 2 Flow cytometric analysis of three centrifugation protocols. Each centrifugation protocol consisted of two steps as described in . A) An initial centrifugation step at 1500 × g (P3) showed significantly higher microparticle numbers than P1 and P2 at 5000 × g. No significant difference was detected between P1 and P2. There was no significant difference regarding the duration of the second centrifugation step at 17,000 × g (two or 20 minutes, P > 0.05). B) Dot plots, showing that clear separation between debris and Annexin V-positive microparticles was only achieved with P1 and P2, whereas P3 led to an indistinct cutoff (*P < 0.005 comparing protocol P3 with P1 and P2).
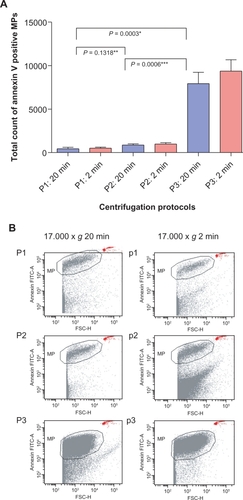
Table 2 MP distribution in centrifugation protocol 1 to 3
Using different durations of centrifugation for the second step (two versus 20 minutes) did not have an effect on the levels of microparticles. No significant differences in absolute numbers of microparticles were found in protocol 1 (mean 502 ± 384 microparticles/μL, P = 0.1563), protocol 2 (mean 985 ± 467 microparticles/μL, P = 0.0767) and protocol 3 (mean 9379 ± 3909 microparticles/μL, P = 0.0899) comparing the duration of 2 versus 20 minutes. Similarly, there were no significant differences comparing platelet-derived microparticles (P > 0.05 for comparisons between the three groups) or endothelial-/leukocyte-derived microparticles (P > 0.05 for comparisons between the three groups).
The dot plots for the different centrifugation protocols are shown in . These dot plots showed a very clear separation between true events and background noise in protocols 1 and 2, whereas protocol 3 led to a less clear separation and increased background signals.
Filtration
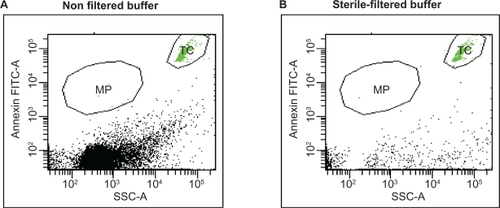
Current detection techniques for microparticles, such as standard flow cytometry, have a detection threshold of 0.4–0.5 μm. The analysis of these small particles remains challenging regarding a clear distinction between microparticles and unspecific precipitates. Therefore, we investigated whether filtration of the buffers and solutions used for microparticle detection had any influence on background and total numbers. demonstrates that filtration of buffer with a 0.2 μm filter reduced a significant amount of background noise, cell debris, and precipitates, which have the same size range as microparticles and could influence or disturb the analysis. Therefore, the results of the storage and centrifugation experiments presented are those in which filtered buffer is used.
Figure 3 Filtration of buffer. The effect of filtered buffer solutions on quantification of microparticles is demonstrated by measuring an equal volume of nonfiltered versus 0.2 μm sterile-filtered buffer. High amount of debris are found in nonfiltered buffer A) compared with that of B) the filtered buffer. TruCount beads (TC) were applied to assay the same volume of buffer exactly.
Storage
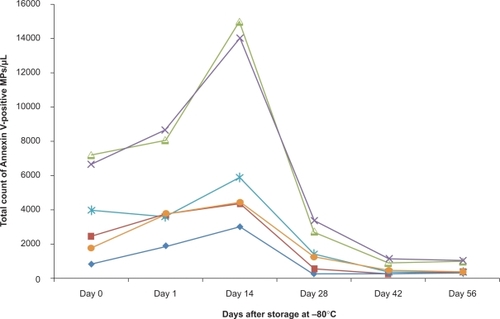
The effect of storage was analyzed by obtaining microparticles pellets from fresh and frozen samples (). Compared with freshly analyzed samples at day 0 (mean 3798 ± 2400 microparticles/μL), the total amount of Annexin V-positive microparticles increased after storage at −80°C for 24 hours (mean 4926 ± 2520 microparticles/μL, P = 0.0278) and 14 days (mean 7760 ± 4850 microparticles/μL, P = 0.048). After 28 days of storage at −80°C, the number of microparticles decreased again (mean 1594 ± 1118 microparticles/μL, P = 0.0152) and, after 42 (mean 552 ± 334 microparticles/μL, P = 0.0332) and 56 days (mean 562 ± 310 microparticles/μL, P = 0.0392), the value decreased even below the ones measured at day 0 in the fresh sample (fresh sample mean 3798 ± 2400 microparticles/μL, P = 0.0186 compared with sample after 56 days).
Figure 4 Storage of microparticles. Microparticle number was assayed immediately after preparation (0) and after freezing at −80°c for different periods of time (n = 6).
Discussion
A wide variety of different methods are used to measure, quantify, and phenotype microparticles from blood samples, other body fluids, or cell culture supernatants.Citation13,Citation1 The small size of microparticles may hamper accurate measurement using currently available detection techniques. Flow cytometry is widely used to detect microparticles, but there is no consensus on the protocol of sample processing. Because the clinical importance of microparticles is increasingly being recognized, it is crucial to standardize methods to allow comparison of data across different studies. Microparticles appear close to the electronic noise and may interfere with cellular debris and precipitates. Emerging evidence suggests that some microparticles are even less than 0.4 μm in size, and current detection techniques, such as standard flow cytometry, have a detection threshold in the range 0.4–0.5 μm.Citation14 Levels of microparticles can also be affected by many sample processing steps, ranging from collection of blood, centrifugation of samples, storing of microparticle pellets, to staining of phospholipids and surface membrane antigens for determining the cell of origin of the microparticle.Citation7,Citation13
The impact of preanalytical steps, like the collection of blood samples, has already been analyzed and discussed by other investigators.Citation7,Citation8 It is recommended to collect samples in an atraumatic fashion with larger needles to avoid sheer stress and endothelial activation. Also, citrate tubes should be preferred over ethylenediamine tetraacetic acid, because the latter is known to interfere with microparticle measurements.Citation7
One focus of our study was to analyze the effect of different centrifugation protocols on microparticle measurements. Most investigators use two steps for centrifugation.Citation15 The first centrifugation step(s) leads to platelet-poor plasma, removing cells, especially platelets and erythrocytes from the blood samples. Some investigators use a second centrifugation step to isolate a microparticle pellet,Citation15 and others detect microparticles directly from the platelet-poor plasma to prevent loss of microparticles.Citation15,Citation16 The latter authors feel that microparticles might be lost because the final supernatant is discarded and microparticles are measured in the resuspended pellet.Citation17 It remains controversial as to which technique should be applied. We compared three different centrifugation protocols that have been in line with published protocols ().Citation15 All three centrifugation protocols applied in our study have primarily yielded platelet-derived microparticles, which is consistent with several previous studies.Citation18–Citation20 In particular, the lower centrifugation speed of 1500 × g used in our study yielded a 10- to 15-fold increase in the absolute numbers of platelet-derived microparticles. One group demonstrated cellular contamination by platelets and red blood cells to be responsible for a higher amount of microparticles when comparing different centrifugation protocols.Citation7 It is also highly possible that a significant amount of those platelet-derived microparticles derived during the analytical process, eg, activation of platelets, can still occur ex vivo with release of microparticles. Dot plots of the three different centrifugation protocols in our study () demonstrated that a clear separation between true events and background noise is only possible with a higher initial centrifugation speed (5000 × g, protocols 1 and 2). These findings suggest that more cell debris, precipitates, and irrelevant cellular elements at lower centrifugation speed may disturb the analysis. Although antibodies like CD31 seem to bind to these elements, unspecific binding of the antibodies cannot be ruled out without using a membrane marker to determine the cellular origin. Higher numbers of platelet-derived microparticles could also mask other subgroup of microparticles which are small in numbers, such as endothelial-/leukocyte-derived microparticles. This is supported by our study because the small fraction of microparticles of endothelial/leukocyte origin (CD31+/CD41–) did not increase significantly using the lower centrifugation speed in contrast with platelet-derived microparticles. However, others found higher numbers of endothelial-derived microparticles with different centrifugation protocols, either by using a four-step centrifugation protocol with low centrifugation speedsCitation7 or by decreasing the time of the second centrifugation step.Citation7 Analysis of these subgroups of microparticles needs to be performed in more detail in future studies.
Table 3 Different published centrifugation protocols for detection of MP
We also looked at the time of centrifugation. We compared two minutes versus 20 minutes at 17,000 × g for the second centrifugation step. The results were not significantly different. Some authors have found that shorter centrifugation facilitates detection of endothelial-derived microparticles.Citation7 We could not confirm this finding. The absolute numbers of endothelial-/leukocyte-derived microparticles did not differ significantly in our three protocols. The same is true for platelet-derived microparticles. We conclude that shorter durations of the second centrifugation step are practicable because it shortens the analysis and simplifies the protocol for clinical use.
It is common practice to freeze platelet-poor plasma or supernatant after the initial centrifugation step, and then store the samples and continue with the analysis at a later time point. Trummer et al looked at three different thawing procedures and their effect on microparticle levels.Citation8 They concluded that thawing of snap-frozen, platelet-free plasma samples should be carried out at room temperature or at 37°C in a water bath, but not on ice. Shah et alCitation7 analyzed the effect of storage on microparticle detection in a systematic fashion. A significant decrease of microparticle levels after four weeks was found. They failed to prove that protease inhibitors could prevent this decline. Others have only mentioned that they did not find an effect of freezing.Citation21,Citation22 Some investigators even picked samples from their studies randomly and tested microparticle counts before and after freezing, and did not find any differences.Citation23 We could demonstrate that, after an initial rise in microparticle levels, the decline of microparticles continues over eight weeks. The microparticles are even lower in numbers after eight weeks compared to the initial counts. Xiao et al showed that freezing itself generates microparticles initially, although they did not perform a long-term follow-up study.Citation24 We also compared different freezing techniques by mixing plasma with either dimethyl sulfoxide (7.5%) or HEPES buffer before freezing, and performed either snap freezing in liquid nitrogen or freezing samples at −80°C (data not shown). These measurements did not prevent the decline in microparticle numbers over time.
Despite the fact that protease inhibitors did not prevent decline of microparticles after freezing, it is still possible for proteases to be activated and disrupt the microparticle vesicles after freezing is initiated. This may initially generate higher numbers of microparticles. It is possible that once the proteases have digested the microparticles into smaller pieces, it becomes impossible to measure them accurately because they may no longer be Annexin-positive. Ideally, microparticles should be analyzed from fresh samples or shortly after onset of storage, eg, 14–28 days. If frozen samples are used, the storage time should be the same, eg, all samples are analyzed 14 days after onset of storage. The same was true for serial samples in one patient. Nevertheless, using only fresh samples is highly labor-intensive, can complicate interinstitutional collaboration, and decreases laboratory performance.
It is also controversial whether staining for phospholipids with Annexin V should be performed. Some groups define microparticles only by size and surface antigen staining without testing for Annexin V positivity.Citation18,Citation22,Citation25,Citation26 In addition, the existence of “Annexin-negative microparticles” has been suggested earlier. Endothelial- and monocyte-derived microparticles, and not platelet-derived microparticles, that are either detected or not by Annexin V, have been described in patients with sickle cell disease.Citation22 It has been reported that the concentration of microparticles (without the use of Annexin staining) is 30 times higher than the concentration of microparticles that are detected by Annexin V.Citation27 We could demonstrate that simply analyzing unfiltered buffer resulted in a significant amount of background noise, cell debris, and precipitates, which have the same size range as microparticles. This could influence and disturb the analysis and quantify false-positive microparticles. In our opinion, positive staining for Annexin V has to be applied as one criterion to define microparticles in order to be able to distinguish true events from cell debris or precipitates.
On a different note, other staining for phospholipids, such as bio-maleimide, has been analyzed and found to be comparable with Annexin V regarding platelet-derived microparticles.Citation16 However, we could not confirm this finding (data not shown). Its potential role as another marker for microparticles remains to be analyzed further. Ulex europaeus is another marker which could be used to detect endothelial microparticles, nevertheless it may bind to other plasma constituents, thereby making it less specific.Citation27
It is also crucial to use the appropriate negative controls. One group looked at the diversity in staining intensity of isotype controls as a potential source of error in the characterization and quantification of microparticles by flow cytometry. They suggest the use of antigen-negative microparticles to adjust instrument settings.Citation9 In our opinion, controls and flow cytometry data, eg, dot plots, should be provided to compare results between different groups and serve as quality standards. Another important aspect is that flow cytometry should be performed by highly skilled experts in specialized laboratories, which could limit widespread use of this laboratory technique.Citation28
The purpose of this study was not to analyze different panels of surface markers to define the cellular origin of microparticles. Other groups have already shown that standardization is needed to quantify different types of microparticles. Van Ierssel et al demonstrated that the amount of endothelial microparticles counted was different for each phenotypic subset examined.Citation29 Other techniques, such as plotting fluorescence intensities for measuring platelet-derived microparticles against a calibration curve or using a blend of size-calibrated fluorescent beads in a fixed numeric ratio, are used to standardize measurements of microparticles.Citation30 Future studies are needed to optimize the measurement of microparticles of different origin and size. Another area is to find a potential alternative to Annexin V as a membrane marker.
In summary, we feel strongly that staining with Annexin V is necessary at this point in time to distinguish true events from cell debris or precipitates, bearing in mind that a significant amount of microparticles might not be detected. Buffers should be filtered and the samples should be analyzed either freshly or should be stored for the same duration. The centrifugation protocol should consist of two steps. The first step to obtain platelet-poor plasma should consist of high-speed centrifugation, eg, 2 × 5 minutes or 1 × 15 minutes high-speed centrifugation at 5000 × g. Lower centrifugation speeds, eg, 1500 × g, should not be used because contamination by smaller-sized platelets cannot be ruled out. After the first centrifugation step, the samples can either be analyzed or stored. A second centrifugation step would follow for a short period, eg, centrifugation at 13,000–18,0000 × g for two minutes to obtain a microparticle pellet. Applying these centrifugation protocols would maintain specificity, while sacrificing sensitivity to a certain degree.
Acknowledgements
The authors are grateful to Kirstin Wyss and Michaela Beese for their excellent technical assistance. This work was supported by a grant from the German Federal Ministry of Education and Research (Reference 01EO0802).
Disclosure
The authors do not have any conflicts of interest to report in this work.
References
- PiccinAMurphyWGSmithOPCirculating microparticles: Pathophysiology and clinical implicationsBlood Rev200721315717117118501
- DistlerJHHuberLCGaySDistlerOPisetskyDSMicroparticles as mediators of cellular cross-talk in inflammatory diseaseAutoimmunity200639868369017178565
- ArdoinSPShanahanJCPisetskyDSThe role of microparticles in inflammation and thrombosisScand J Immunol2007662–315916517635793
- DiamantMTushuizenMESturkANieuwlandRCellular microparticles: New players in the field of vascular disease?Eur J Clin Invest200434639240115200490
- BurnierLFontanaPKwakBRAngelillo-ScherrerACell-derived microparticles in haemostasis and vascular medicineThromb Haemost2009101343945119277403
- GeorgeFDMicroparticles in vascular diseasesThromb Res2008122Suppl 1S55S5918691501
- ShahMDBergeronALDongJFLopezJAFlow cytometric measurement of microparticles: Pitfalls and protocol modificationsPlatelets200819536537218791943
- TrummerAde RopCTiedeAGanserAEisertRRecovery and composition of microparticles after snap-freezing depends on thawing temperatureBlood Coagul Fibrinolysis200920525620523165
- TrummerAde RopCTiedeAGanserAEisertRIsotype controls in phenotyping and quantification of microparticles: A major source of error and how to evade itThromb Res2008122569170018304614
- RobertSPonceletPLacroixRStandardization of platelet-derived microparticle counting using calibrated beads and a Cytomics FC500 routine flow cytometer: A first step towards multicenter studies?J Thromb Haemost2008719019718983485
- BaumgarthNRoedererMA practical approach to multicolor flow cytometry for immunophenotypingJ Immunol Methods20002431–2779710986408
- RoedererMSpectral compensation for flow cytometry: Visualization artifacts, limitations, and caveatsCytometry200145319420511746088
- ShetASCharacterizing blood microparticles: Technical aspects and challengesVasc Health Risk Manag20084476977419065994
- LawrieASAlbanyanACardiganRAMackieIJHarrisonPMicroparticles sizing by dynamic light scattering in fresh-frozen plasmaVox Sang200996320621219175566
- JyWHorstmanLLJimenezJJMeasuring circulating cell-derived microparticlesJ Thromb Haemost20042101842185115456497
- EnjetiAKLisaLSeldonMBio-Maleimide as a generic stain for detection and quantitation of microparticlesInt J Lab Hematol200730319619918479297
- Dignat-GeorgeFFreysinnetJ-MKeyNSCentrifugation is a crucial step impacting microparticle measurementPlatelets20092032226
- DanielLFakhouriFJolyDIncrease of circulating neutrophil and platelet microparticles during acute vasculitis and hemodialysisKidney Int20066981416142316531979
- LynchSFLudlamCAPlasma microparticles and vascular disordersBr J Haematol20071371364817359370
- ErdbrueggerUGrossheimMHertelBDiagnostic role of endothelial microparticles in vasculitisRheumatology (Oxford)200847121820182518927191
- AmabileNGuerinAPLeroyerACirculating endothelial microparticles are associated with vascular dysfunction in patients with end-stage renal failureJ Am Soc Nephrol200516113381338816192427
- ShetASArasOGuptaKSickle blood contains tissue factor-positive microparticles derived from endothelial cells and monocytesBlood200310272678268312805058
- BrodskySVFacciutoMEHeydtDDynamics of circulating microparticles in liver transplant patientsJ Gastrointestin Liver Dis200817326126818836617
- XiaoHJepkorirCJHarveyKRemickDGThrombin-induced platelet microparticles improved the aggregability of cryopreserved plateletsCryobiology200244217918812151273
- GarciaSChirinosJJimenezJPhenotypic assessment of endothelial microparticles in patients with heart failure and after heart transplantation: Switch from cell activation to apoptosisJ Heart Lung Transplant200524122184218916364869
- BoulangerCMAmabileNTedguiACirculating microparticles: A potential prognostic marker for atherosclerotic vascular diseaseHypertension200648218018616801490
- HorstmanLLJyWJimenezJJBidotCAhnYSNew horizons in the analysis of circulating cell-derived microparticlesKeio J Med200453421023015647627
- TsiaraSElisafMJagroopIAMikhailidisDPPlatelets as predictors of vascular risk: Is there a practical index of platelet activity?Clin Appl Thromb Hemost20039317719014507105
- van IersselSHvan CraenenbroeckEMConraadsVMFlow cytometric detection of endothelial microparticles (EMP): Effects of centrifugation and storage alter with the phenotype studiedThromb Res2010125433233920117824
- RobertSPonceletPLacroixRStandardization of platelet-derived microparticle counting using calibrated beads and a Cytomics FC500 routine flow cytometer: A first step towards multicenter studies?J Thromb Haemost20097119019718983485
- BroganPAShahVBrachetCEndothelial and platelet microparticles in vasculitis of the youngArthritis Rheum200450392793615022336
- ShahMDBergeronALDongJFLópexJAFlow cytometric measurement of microparticles: pitfalls and protocol modificationsPlatelets200819536537218791943
- EnjetiAKLinczLFSeldonMDetection and measurement of microparticles: an evolving research tool for vascular biologySemin Thromb Hemost200733877177918175282
- JyWHorstmanLLJimenezJJMeasuring circulating cell-derived microparticlesJ Thromb Haemost20042101842185115456497