Abstract
The topic of motor vehicle crashes among the elderly is dynamic and multi-faceted requiring a comprehensive and synergistic approach to intervention planning. This approach must be based on the values of a given population as well as health statistics and asserted through community, organizational and policy strategies. An integrated summary of the predictors (quantitative research), and views (qualitative research) of the older drivers and their stakeholders, does not currently exist. This study provided an explicit socio-ecological view explaining the interrelation of possible causative factors, an integrated summary of these causative factors, and empirical guidelines for developing public health interventions to promote older driver safety. Using a mixed methods approach, we were able to compare and integrate main findings from a national crash dataset with perspectives of stakeholders. We identified: 11 multi-causal factors for safe elderly driving; the importance of the environmental factors - previously underrated in the literature- interacting with behavioral and health factors; and the interrelatedness among many socio-ecological factors. For the first time, to our knowledge, we conceptualized the fundamental elements of a multi-causal health promotion plan, with measurable intermediate and long-term outcomes. After completing the detailed plan we will test the effectiveness of this intervention on multiple levels.
Background
Older driver safety
As our population ages, older driver safety increasingly evokes public health concern. Statistics show that in 2001, the 27.5 million licensed drivers age 65 and older in the US experienced, based on miles driven, higher rates of fatal crashes than most other groups (CitationNHTSA 2001) with nearly 7,500 older adults dying in motor vehicle crashes. The next year, an estimated 220,000 suffered nonfatal injuries, with rates being twice as high for men as for women (CitationCDC 2004a, Citation2004b). By 2020, it is estimated that more than 40 million older adults will be licensed drivers (CitationDellinger et al 2002). By 2030, people age 65 and older are expected to represent 25 percent of the driving population and 25 percent of fatal crash involvement (CitationIIHS 2003). The 76+ age group is especially at an increased risk for motor vehicle crashes due to underlying frailty and fragility, medical conditions, medications, and functional impairments (CitationMcGwin et al 2000; CitationLangford et al 2006).
Factors contributing to unsafe driving (CitationWilliams and Ferguson 2002; CitationCharlton et al 2006; CitationClassen, Shectman et al 2006; CitationLangford and Koppel 2006) include those at different socio-ecological levels. These include vehicle factors (eg, poor driver vehicle fit) (CitationAOTA 2004), environmental factors (eg, absence of protected left turn lanes) (CitationBenekohal et al 1992; CitationNHTSA 2001; CitationStaplin et al 2001) and social system factors (eg, limited access to driver rehabilitation programs resulting in premature driving cessation) (CitationAOTA 2003; CitationOregon State University 2003; CitationICADTS 2006).
Driving cessation should not be considered the immediate and appropriate solution to curtail the inherent risk associated with driving and normal aging, especially given our car-dependent society and the dearth of community-based mobility alternatives (CitationKerschner and Aizenburg 1999). Furthermore, driving cessation is strongly associated with being homebound and isolated (CitationMarottoli et al 2000), developing depression (CitationMarottoli et al 1997), and admission to long-term care facilities (CitationFreeman et al 2006). As such, more appropriate solutions for enhancement of safety and independence include those that will keep older drivers on the road longer and safer, or provide appropriate transportation solutions to those no longer able to drive safely (CitationStephens et al 2005). Such initiatives necessitate a population-based health promotion focus.
Population health promotion
The complex challenges associated with older driver safety call for a multi-system assessment and intervention approach to decrease mortality and morbidity, to facilitate older adults driving longer and safer, and to find acceptable solutions for those who can no longer drive. For example, such an approach might include: offering health behavioral strategies; providing adaptations and enhancements; and developing regulatory policy.
Population health promotion is defined by CitationFrankish et al (1999, p 71) as “the epidemiological and social condition of a community that minimizes morbidity and mortality, ensures equitable opportunities, promotes and protects health, and achieves optimal quality of life”. This approach places emphasis on increasing community capacity, building supportive environments, and promoting public health policy as a means for social change that will improve health. Consequently, efforts to improve health are based on clear statements of values and principles of a given community, in conjunction with an analysis of determinants that occur on the societal, community and individual levels (CitationGreen and Ottoson 1999, p 4). Such efforts must acknowledge and respond to the political dimensions of health, and activate community members, local organizations, and politicians to mobilize for health promoting changes. The use of a model, principally one designed to capture the ideologies of the population health promotion approach, is fundamental to our understanding and efforts aimed toward solving the challenges related to older driver safety.
Precede-proceed model of health promotion
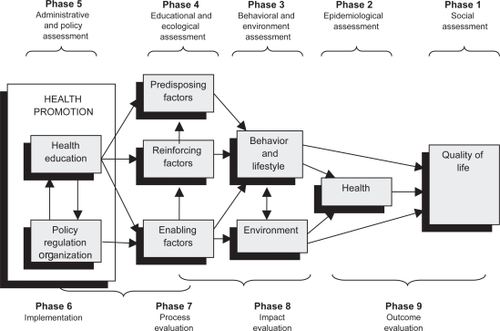
Predictors of safe driving have been identified in the literature, yet they are not integrated into a meaningful causative model. The Precede-Proceed Model of Health Promotion (PPMHP) provides a means to organize factors at multiple social-ecological levels into a theoretical framework so that targeted interventions can be developed (CitationGreen and Kreuter 1999). The model has two main phases, the PRECEDE and the PROCEED (). The PRECEDE or evaluative phase, provides a framework for systematically assessing the social, epidemiological, educational and ecological, and administrative and policy aspects of a topic under study. An underlying premise is that education is dependent on voluntary cooperation and participation of the client, and that the degree of change in knowledge is directly related to the degree of active participation. The PROCEED or intervention phase, recognizes the need to move beyond traditional educational approaches to those that facilitate policy regulation along with improved environmental and organizational resources and services. The components of PROCEED position the practitioner to choose, implement and evaluate the types of interventions necessary to develop social environments conducive to healthy lifestyles.
Figure 1 Conceptualization of the precede-proceed model of health promotion (CitationGreen and Kreuter 1999) indicating the five assessments of the PRECEDE phase (eg, social, epidemiological, etc.) and the four phases of the PROCEED phase (eg, implementation, process evaluation, etc), as well as the main domains (eg, health, behavior and lifestyle, environment, etc.). Re-printed with permission obtained from McGraw-Hill Companies; permission granted on August 03, 2007.
Mixed methods research
Mixed methods research provides a viable means for examining the values and principles of a population, in conjunction with an analysis of determinants that occurs on the societal or community level. This methodology involves integrating quantitative and qualitative data collection and analysis within a single study or program of inquiry (CitationCreswell et al 2003). The underlying logic of mixing quantitative and qualitative data is that, on their own, neither method is sufficient to capture the details and trends of the topic under study. When used in combination, quantitative and qualitative data complement one another and yield a more complete analysis (CitationCreswell et al 2004). Mixed methods research was introduced 16 years ago (CitationBlake 1989), and within one decade it was supported by the CitationNational Institutes of Health (1999). It has the ability to preserve the inherit complexity of the research domain while also maintaining social context and providing individuals and communities with the means to voice their perspectives (CitationCrabtree 2005).
The research problem
The topic of motor vehicle crashes among the elderly is dynamic and multi-faceted and thus, requires a comprehensive and synergistic approach to intervention planning. This approach must be based on the values of a given population as well as health statistics, and asserted through community, organizational and policy strategies. Existing research has separately examined specific individual-level issues that limit driving ability (impairments, medical conditions, medications and behaviors), has identified environmental barriers and facilitators, and has proposed guidelines and options for alternative methods of transportation. An integrated summary of the predictors (quantitative research), and views (qualitative research) of the older drivers and their stakeholders, does not currently exist. We are therefore lacking (1) an explicit socio-ecological view that explains the interrelation of possible causative factors, (2) an integrated summary of these causative factors obtained through quantitative and qualitative methods, and (3) empirical guidelines for developing public health interventions to promote older driver safety.
Significance
We anticipate that a variety of audiences involved in older driver safety issues will benefit from the integrated findings of this study. As healthcare providers, consumers, researchers, and policy makers are inundated with unmanageable amounts of information, our integrated quantitative results illustrating the socio-ecological factors and their interrelatedness may provide a basis for rational decision making for future interventions. Further, the perspectives of older drivers and other stakeholders will provide insight as to the knowledge, values and beliefs of this cohort. Finally the qualitative findings compared and integrated against the existing quantitative data, will provide structure for development of a multi-system intervention plan.
Research questions
Applying a socio-ecological perspective to examine older driver safety in the US, we asked the following four questions:
From a national crash dataset (Fatality Analysis Rating System -FARS 2003), among drivers aged 65 and older, what are the main risk and protective factors, and the age interaction among these factors, for the driving injury (yes/no) outcome?
From a qualitative meta-synthesis, how do the stakeholder perspectives, needs, and goals for safe and unsafe driving outcomes support or inform the salient factors found in the FARS dataset?
Given the answers to questions 1 and 2, what are the modifiable determinants (most important and changeable risk and protective factors) of unsafe (injurious) driving?
What are the main components, and intermediate and long-term objectives of an intervention to curtail unsafe (injurious) driving and promote safe driving on a population-based level?
Purpose
Organizing the socio-ecological determinants into a structural model (depicting the main risk and protective factors and their association to safe and unsafe driving by each domain of the PRECEDE phase of the PPMHP) (CitationClassen, Garvan et al 2006) positioned us to quantify the crash predictors, and their interactions with age, to unsafe driving (injury vs no injury). Using a mixed methods approach (Creswell 2005), we were able to compare or integrate the quantitative data with the stakeholder perspectives, needs and goals found from the qualitative data; thus extending the socio-ecological model as a framework for intervention planning.
Methods
Procedure
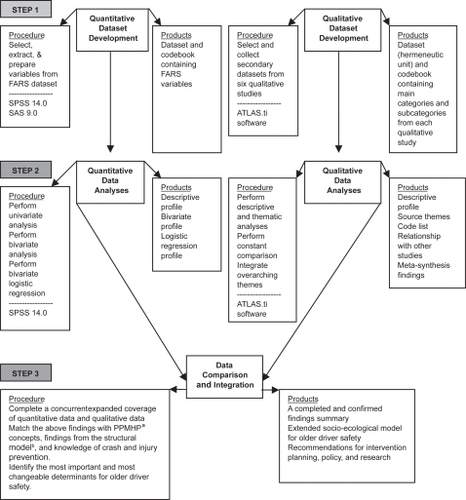
From a systematic literature review conducted on older driver safety, we used the structural model developed by CitationClassen and colleagues (Classen, Garvan et al 2006; CitationClassen and Lopez 2006), to guide our study. We used a three-step approach to examine the main epidemiological factors within the social context of older drivers in the US. First, using a cross-sectional design, we analyzed a national crash dataset, the 2003 Fatality Analysis Rating System (FARS) (NHTSA 2005). Concurrently, we completed a meta-synthesis, or a narrative summary based on inductive and deductive analyses, of six qualitative studies (CitationSterns et al 1997; CitationBurkhardt et al 1998; CitationJohnson 1998, Citation2002; CitationKostyniuk and Shope 1998; CitationKerschner and Aizenburg 1999). We then compared or integrated the qualitative meta-synthesis with the quantitative findings (). All study protocol and materials were approved by the Institutional Review Board of the University of Florida.
Figure 2 Algorithm for the mixed methods expanded coverage design used in “Public Health Model to Promote Safe Elderly Driving” study. We used the PRECEDE phase of the Precede-Proceed Model of Health Promotiona and a systematic literature review on older driver safety (CitationClassen et al 2006) to develop the structural modelb (CitationClassen and Lopez 2006).
Quantitative dataset development
We used the FARS dataset, a world-renowned recording system for fatal crashes that: (1) occur in all US states (as well as the District of Columbia and Puerto Rico); (2) happen on public roadways; and (3) result in a death within 30 days of the crash (CitationUS DOT 2003). It also contains details pertaining to health (eg, physical or mental conditions); physical environmental factors (eg, vehicles or highway design); social environmental factors (eg, passengers); and behavioral factors (eg, alcohol use or safety belt use).
For this cross-sectional analysis, we designated Younger Drivers (aged 35–54 years) as our controls, and Older Drivers (aged 65 and older) as our cases. With 6,445 Older Drivers and 20,077 Younger Drivers, there was sufficient statistical power to detect differences between these groups. Because significant variation exists within age categories (CitationFoley et al 2002; CitationLangford et al 2006), we tested age as a confounding and moderating variable.
In addition to age, inclusion in the study depended on drivers being involved in motor vehicle crashes during 2003. We excluded drivers with missing data for age or injury severity (dependent variable); drivers that do not normally travel on public roads (snowmobiles or farm equipment); and drivers of heavy trucks (school buses or motor homes); and vehicles with unknown body types. The final sample size was 19,782 with 14,083 Younger Drivers and 5,774 Older Drivers.
From the 178 FARS variables, we excluded 146 variables that (1) did not contribute significant information (eg, unique identifiers); (2) did not meet the scope of our research questions (eg, vehicle identification number); (3) that had large counts of missing data (eg, drug test results); or (4) were prone to multicolinearity. As a result, the remaining 32 variables were conceptually congruent with the domains of the PPMHP and consistent with our previous work on older driver safety (CitationAwadzi et al 2006; CitationClassen, Garvan et al 2006). Given their categorical and ordinal nature, we were able to collapse variables with several value categories. For example the variable most harmful event originally had 57 values from which we created four categories. Our dependent variable injury severity was collapsed (from its original eight categories) into a dichotomous Yes/No outcome.
Quantitative data analysis
Using SPSS 14.0 [SPSS, 2005] we performed a descriptive analysis, bivariate analysis, and binary logistic regression. After inspecting the data for distribution and completeness we excluded variables with more than 8% missing data from subsequent analyses. We used bivariate analyses to (1) examine the relationships of the 32 explanatory variables to the outcome variable, and to (2) observe the relationship between age-related licensure renewal policies and injury outcome. The variable license state was collapsed by factors (age-renewal policies, reduced renewal cycle, in-person renewal, and vision/medical testing) to ascertain differences in injury rates among states with and without these policies. We conducted a binary logistic regression analysis using age as an interaction variable. Using the SPSS enter option, we keyed our 32 retained FARS variables into the analysis. We inspected the model fit by considering the Hosmer and Lemeshow goodness-of-fit test statistic (good fit indicated by statistic not being significant at p < 0.05), and by considering the explained variance through the Nagelkerke R-Square.
Qualitative dataset development
For our meta-synthesis, we included studies that: (1) were conducted in the US; (2) drew perceptions from older driver stakeholders; and (3) provided rich narrative results pertaining to needs, factors influencing safety, and safety priorities of older driver stakeholders. The six studies to meet our criteria illustrated stakeholder perspectives on safety factors, including decision making (CitationSterns et al 1997; CitationJohnson 1998, Citation2002), automobile use and alternative transportation (CitationKerschner and Aizenburg 1999), driving reduction and cessation (CitationKostyniuk and Shope 1998), and the consequences of mobility and driving (CitationBurkhardt et al 1998). These studies represented the perspectives of 690 participants (older adults who were still driving, former drivers, families, friends and professionals) across a wide geographic area of more than 10 states. The research reports and journal articles were prepared, imported into the ATLAS.ti (CitationMuhr 2004) software program, and analyzed to identify themes and concepts.
Qualitative data analysis
We analyzed the studies descriptively and profiled each study by funding source, research questions, study method, and respondents (age, socio-economic status and geography of residence). Our content analysis used the structural model for older driver safety (CitationClassen, Garvan et al 2006), to guide (but not limit) our coding of themes, categories and concepts. Using ATLAS.ti we analyzed the data using both deductive coding (use of a coding rubric based on the structural model) and inductive coding (open coding to capture new themes in the primary studies). We employed an iterative process to analyze the studies. First we read and coded the primary studies attending to the research context, questions asked, design and theoretical influences (single case analysis). Then, we used the constant comparison method (CitationStrauss and Corbin 1998) among all six studies to identify and illustrate common themes as well as contrasting results. Next, we identified over-arching themes by exploring relationships among the studies. Finally, we developed a meta-synthesis model to illustrate the joint findings and new concepts.
Data integration
To interpret the main findings (risk and protective factors) pertaining to older driver safety, within a relevant context, we used a mixed methods approach (Creswell 2005). Within the PPMHP framework, we compared and integrated the findings from the qualitative meta-synthesis with the quantitative results (findings from the binary logistic regression model). The interpretation of this expanded coverage process (CitationDenzin 1989) allowed us to identify the most important risk and protective factors for older driver safety, resulting in a framework to plan a targeted intervention.
Expanded coverage design
The expanded coverage design (CitationDenzin 1989) entailed simultaneously collecting quantitative and qualitative data, then analyzing the data separately, before integrating and comparing the data (CitationTashakkori and Teddlie 1998). We used a multi-method meta-matrix (CitationTashakkori and Teddlie 1998) to demonstrate confirmability and/or completeness of the data, and as a means of ensuring acceptability across the two research paradigms. presents a multi-method meta-matrix template used to indicate the PPMHP domain, and report comparison and integration of a significant finding from the logistic regression model with the comparable qualitative finding(s) from the meta-synthesis. The information yields an integrated whole and discusses implications for intervention planning.
Table 1 Multi-method meta-matrix template used to compare and integrate significant findings from the logistic regression model with the comparable qualitative finding(s)
Results: Quantitative and qualitative
Quantitative
Univariate analysis
The sample included 29% (5,744) older drivers. Gender comprised 66.6% (3,827) males and 33.4% (1,917) females. About 85% experienced an injury from the crash. Most crashes (94.9%) were non-alcohol related. In most cases, older drivers wore a restraint (72.5%), were registered vehicle owners (85.5%), and had a valid drivers’ license for the vehicle they operated during the crash (97.5%). Crashes generally occurred on straight roads (84.4%), in dry road conditions (84.4%), and during daylight hours (79.5%).
Bivariate analysis
Although almost all the variables were significant at p ≤ 0.05 performing the bivariate analysis enabled us to further collapse multicolinear variables. For age-related licensing policies (enabling domain), we found: (1) Older drivers with licenses from states with age-renewal policies had significantly lower injury percentages compared to older drivers from states with no age-renewal policies (p ≤ 0.01); (2) There was no significant difference in injury rates between states with reduced renewal cycles and those with no reduced renewal cycles (p = 0.59). (3) Drivers with licenses from states with in-person renewal policies had significantly lower injury rates compared to older drivers from states with no in-person renewal policies (p ≤ 0.01) and; (4) There was no significant difference (p ≤ 0.46) in injury rates between states with and without test requirements (vision, medical, and road) for older drivers.
Binary logistic regression
From the 32 variables identified as conceptually congruent with the PPMHP model, we had representation in five domains: health (2 variables), behavior (3 variables), environment (21 variables), reinforcing (5 variables), and predisposing (1 variable). The Hosmer and Lemoshow test (p = 0.68), indicated that the model fits the data well; and the Nagelkerke R-Square indicated that 57.2% of the variance in the outcome variable was explained by the data. displays the binary logistic regression model showing the significant age interactions and explanatory variables from the five domains of the PPMHP, with the dependent variable (injury yes/no). We observed 20 statistically significant associations: four with age-interaction effects and 16 main effects (no statistically significant differences between younger and older drivers). The interaction effects related to the environmental domain (registered vehicle owner, principal point of impact, and number of occupants) and the reinforcing domain (number of other previous motor vehicle convictions). For the registered vehicle owner variable, older drivers who were not the registered owner of the vehicle were 53% (p = 0.05) less likely to be injured in the crash compared to drivers who were registered vehicle owners. For the principal point of impact variable, (angle at which the vehicle was struck using the clock method), two levels of risk emerged: the 1–3 0’clock angle (OR = 1.61) and 7–9 0’clock angle (OR = 4.75). For the variable number of vehicle occupants a protective marginally significant association emerged for older drivers with two or more occupants present (OR = 0.60).
Table 2 Binary logistic regression model showing the significant age interactions and explanatory variables, from the five domains of the PPMHP, with the dependent variable (injury: yes/no)
After controlling for age, 6 main effects were evident: health (1 variable), behavioral (3 variables), environmental (11 variables) and predisposing (1 variable) domains. Compared to males (health domain), females had an increased risk (OR = 1.51) of injury in motor vehicle crashes. Risk factors from the behavioral domain were: (1) not having a valid drivers’ license (OR = 1.39); alcohol (OR = 2.00); and restraint system use (OR = 6.20). Factors from the environmental domain included roadway surface conditions, vehicle body type, and most harmful event. Compared to dry roadway surfaces, crashes in adverse roadways (eg, snow and rain) were 1.5 times more likely to result in injury. For vehicle body type, in relation to SUVs, automobile and automobile derivatives were risks for injury (OR = 2.00), while vans, trucks, and light pickup were protective (OR = 0.77). Most harmful event pertained to major events for vehicles involved in crashes. In contrast with collision with an object that was not fixed, drivers who collided with a fixed object had 249 times the likelihood of being injured, while drivers in motor vehicles in transport had 31 times the odds of being injured. Most harmful events with non-collision crashes had 266 times the odds of resulting in injury. Protective environment factors included absence of traffic control devices (OR = 0.79), traveling in urban areas (compared to rural) (OR = 0.61) and airbag not deployed (OR = 0.25). From the predisposing domain, vehicle maneuver (actions before initiation of the crash) indicated that compared to going straight, lane-related crashes (OR = 0.64), maneuvers (OR = 0.59), and making a left turn (OR = 0.66) had protective effects.
Qualitative
We synopsized the results of the qualitative data analysis in two ways, according to the structural model (coding rubric) and a meta-synthesis of the qualitative findings. Thematic analysis using the coding rubric connected the data to the domains of the PPMHP and expanded the structural model. The qualitative data illustrated the reciprocal relationships between factors in the health domain, driving and quality of life. The behavior and lifestyle domain factors included respondent’s criteria for judging a behavior as safe or unsafe as well as data showing the influence of lifestyle and roles on driving choices. Participants commented on the physical, social, and economic and service related aspects of the environmental domain. Predisposing factors included views about driving as a right versus a privilege, attitudes about dependence, and knowledge of older driver safety resources. Reinforcing factors included family and friends’ involvement, professionals’ knowledge, and communication strategies that facilitated driving interventions. Enabling factors discussed age based licensing and state policies that require reporting unsafe drivers. Health education factors included the acceptability of assessment, preferences for assessment provider, location and information and counseling needs and preferences. Although available, a detailed discussion of the meta-synthesis results is beyond the scope of this paper.
Expanded coverage of results with comparison or integration, discussion, and implications
For ease of reading we summarized each of the 11 findings according to their multi-method meta-matrices. First, we discussed the four interaction effects, then the seven main effects, and next the additional significant quantitative and qualitative findings that could not be compared or integrated but contributed meaningful information to extend the PPMHP.
Finding 1: Other previous motor vehicle convictions (reinforcing domain)
Quantitative: For each previous motor vehicle conviction, older drivers are 35% less likely to be injured in a crash.
Qualitative: Families intervened with protective measures based on crashes or incidents involving the police. For example, after the parent was in an accident, the son-in-law would no longer allow this parent to drive. In another case, after a call from the police, a daughter took the keys away from her parent (CitationSterns et al 1997, p 57).
Comparison or integration: Findings from both datasets support that protective steps have been taken by the driver themselves (quantitative), or by the families (qualitative) after convictions, crashes, violations, or incidents with police involvement. These protective steps were associated with impacting (reinforcing) safer driving or leading to driving cessation.
Discussion: Consistent with the literature (CitationCoughlin et al 2004; CitationNHTSA 2006a) a history of an adverse event was somehow associated with a safer outcome: decreased risk of injuries, or driving cessation.
Implications: To further understand the history of violations, convictions, or crashes and their impact (reinforcing) on safe driving, further research (case-control or historical cohort) is necessary. However these findings suggest that formal (police) or informal (families) agents of the older drivers’ social network have a role in crash or injury prevention. Thus continued police or family involvement are necessary to (1) monitor, (2) influence decision making, (3) establish rules, (4) and enforce driving restrictions for risk reductions in unsafe driving outcomes.
Finding 2: Passengers: (social environmental domain)
Quantitative: Compared to older drivers without any passengers in the vehicle, those with two or more passengers were 40% less likely to sustain injuries following a motor vehicle crash.
Qualitative: Some older drivers drove alone to prevent distraction, while others choose to drive with a companion for longer trips, or reported that passengers were observing and giving feedback on their driving errors.
Comparison or integration: Compared to older drivers without any passengers in the vehicle, older drivers with two or more passengers were 40% less likely to sustain injuries following a motor vehicle crash. Individual responses are congruent to the quantitative finding when driving with one or more companions. Conversely, limited qualitative data show that driving alone can be of benefit for the older driver in avoiding distractions (CitationHing et al 2003).
Discussion: Within the PPMHP, the social environment encompasses the presence of passengers. Consistent with the literature (CitationBurkhardt et al 1998; CitationHing et al 2003; CitationBédard and Meyers 2004) and the qualitative findings, at least some older adults are aware of the protectiveness of driving (way finding or alerting drivers to avoid adverse events) with passengers. Conversely, if older drivers perceive passengers to be a distraction (CitationBurkhardt et al 1998; CitationHing et al 2003; CitationBédard and Meyers 2004), that may pose a safety risk.
Implications: These findings have implications for intervention planning by which the presence of passengers may be protective or distractive to safer driving outcomes. We think that the older drivers’ response to passenger cues is a function of their cognitive status and conditions under which driving occur, and must be examined as such.
Finding 3: Registered vehicle owner (social environment domain)
Quantitative: Compared to older drivers who are registered vehicle owners, those who are not registered owners of vehicles are 31% less likely to be injured in crashes.
Qualitative: None.
Comparison or integration: The protective nature of driving a vehicle other than one’s own may partly be explained by considering a subgroup of older drivers that would most likely drive (a) a rented vehicle; (b) the vehicle of another member; or (c) a company vehicle (CitationJanicak 2003). This group may represent the younger old groups, be in better physical or mental (cognitive) health, have better visual perceptual abilities, or have an increased sense of responsibility.
Discussion: A sub-analysis confirmed our thinking that drivers who drove other vehicles were of the younger age group (p=0.01, mean age 74.15, SD=6.55) compared to those who drove vehicles registered in their names (p=0.01, mean age 76.29, SD=7.20).
Implications: No implications for the intervention plan.
Finding 4: Principal impact (physical environment domain)
Quantitative: Compared to the 12 o’clock angle, older drivers who were impacted at the 1–3 o’clock angle were 2 times more likely to be injured in crashes, but those who were impacted at the 7–9 o’clock angle were 5 times more likely to be injured in crashes.
Qualitative: None.
Comparison or integration: This finding shows the significance of two angles of impact associated with the highest risks of injury for older drivers. Principal impact is related to dynamic interactions of many components such as kinetic forces, speed, distance, velocity, vehicle crashworthiness, objects impacted (fixed vs moving), and maneuvers executed. To understand the details of the principal impact, sub-analysis including other interaction variables such as (1) speed, (2) most harmful event (collision with fixed objects or moving objects) and (3) vehicle maneuver is needed.
Discussion: Although no qualitative findings exist to clarify the older drivers’ experience on principal impact, we realized, from the quantitative data, that relationships exist among the two angles of impact and risk of injuries. Conducting an interaction analysis, such as a log linear analysis, may help us understand the underlying mechanisms of injury post-crash.
Implication: Although this finding has no implications for the intervention plan, it has research implications. Interaction effects of the environment (vehicle and objects), with behavior (speed) and predisposing factors (vehicle maneuver) need to be examined.
Finding 5: Hour of the day (physical environment domain)
Quantitative: Compared to all drivers who were in crashes between 9 PM and 7 AM, those who drove in the daylight hours were 28% (8 AM–1 PM) and 37% (2 PM–8 PM) less likely to be injured in crashes.
Qualitative: Several individual quotes support application of self-restriction for nighttime driving (CitationBurkhardt et al 1998, p 132; CitationKostyniuk and Shope 1998, p 10; CitationKerschner et al 1999, p 58) or that drivers feel more comfortable to drive during the day time hours (CitationBurkhardt et al 1998, p 73).
Comparison or integration: The quantitative data show protective effects for daytime driving for all drivers, and the qualitative findings show that older drivers prefer daytime trips and self-restrict for nighttime driving.
Discussion: Our findings are congruent with the existing literature (CitationFinison and Dubrow 2002; CitationBaker et al 2003; CitationNHTSA 2006b), in support of self-regulation strategies as they pertain to daytime driving for older adults.
Implication: These include continued education about the protective nature of daytime driving, and further research to examine the components (health, vehicle, environment) underlying the preference for not driving during these darker hours. If older adults are to drive safer and longer, societal implications include making services and activities available to accommodate them during daytime hours when it is safer to drive. For example, businesses could extend daytime service hours with more “matinee” shows and “early bird” opportunities across a variety of settings. Also, society must ensure provision of acceptable alternative transportation options if older adults should choose to participate in night time activities.
Finding 6: Relation to junction: (physical environment domain)
Quantitative: Compared to drivers traveling on non-junctions (eg, rail road crossing or bridges), those who had intersection related crashes were 41% less likely to be injured in a crash.
Qualitative: An older driver stated that he pulled out from a side street and was broad-sided (CitationKostyniuk and Shope 1998, p 31); a family member of another reported that “one side of her car is all banged up from taking turns too tight” (CitationSterns et al 1997, p 43). In another case a driver stated that he needed the presence of a stoplight before crossing highways (CitationBurkhart et al 1998, p 72).
Comparison or integration: The protective nature of intersection-related crashes to injury may partially be explained by (1) complex environments being more structured and requiring increased vigilance from drivers, or (2) intersections acting as speed reducing mechanisms. A combination of the increased vigilance and slower speeds among drivers may explain the protective nature of intersections. From the qualitative data an older driver called for a more structured environment (a stoplight before crossing a highway) to feel safer, but families and friends observed that intersection negotiation is somehow associated with minor traffic collisions, near misses, or dents in the body of vehicles.
Discussion: Two recently published studies on highway design and safe driving performance (CitationClassen et al 2006; CitationShechtman et al 2006) showed that roads with enhanced intersections (using the Federal Highway Administration’s guidelines recommendations proposed by CitationStaplin et al 2001) generally benefit the safe driving performance of younger and older drivers alike. The findings from analyzing the crash dataset illustrated the protective nature between the physical environment and safer driving outcomes at intersections. However, the qualitative data show that (1) minor crashes occur at intersections, and (2) failure to negotiate intersections safely helped families identify unsafe driving behavior.
Implications: These findings bring a new awareness of the protective nature of intersections to injury (structuring the environment and decreasing speed) for all drivers, but also a realization that more complex driving environments (intersections) are related to minor collisions for older drivers.
Finding 7: Traffic control device (physical environmental domain)
Quantitative: Compared to crashes occurring at functioning traffic control devices, those drivers who crashed in the absence of these devices were 40% less likely to be injured.
Qualitative: Families and friends commented that older drivers had problems with interpretation of traffic lights, eg, some slowed down or stopped for a green light while others failed to stop or ignored red lights (CitationSterns et al 1997, p 22); that failure to stop at stop signs was indicative of unsafe driving behavior for older drivers (CitationKershner and Aizenberg 1999, p 88); and that others reported on having inadequate traffic signs and signals (CitationKershner and Aizenberg 1999, p 52).
Comparison or integration: The finding that the absence of the traffic control device is protective for all drivers represents co-existence of other factors such as complexity of the environment, higher populated areas, and increases in traffic flow. These factors must be taken into consideration in interpreting this finding. The qualitative findings indicate that older drivers may have difficulty interpreting traffic control devices, which may potentially be indicative of a decline in cognition, thus indicating partial congruence with the quantitative finding. However, in some circumstances, such as crossing a highway, older drivers feel safer with the presence of a traffic control device.
Discussion: The significance of the physical environment is evident as it pertains to traffic control devices. The quantitative data clearly show the protective effect of the absence of traffic control devices and the qualitative data (family and friends) help to explain the confusion that occurs among some older drivers in the presence of traffic control devices; yet limited data suggest that some older drivers rely on traffic control devices. The interactions underlying the person factors (eg, cognition) in combination with environmental factors (eg, highway design) may be better explained in an experimental study.
Implications: Continued education on demands of complex environments may increase the risk for some, but be protective for others.
Finding 8: Vehicle maneuver (physical environmental domain)
Quantitative: Compared to going straight, drivers who performed a variety of maneuvers had a lesser chance of being injured in a traffic crash (lane related 36%; other maneuvers: leaving a parked position, making a right turn, and avoiding objects 41%; making a left turn 34%).
Qualitative: Various lane related errors were noted, eg, older drivers weave in and out of lanes and straddle the line frequently (CitationSterns et al 1997, p 22): “I had the neighbors calling to say grandpa drives right down the middle of the street” (CitationSterns et al 1997, p 44); or changing lanes too fast (CitationKershner and Aizenberg 1999, p 56).
Comparison or integration: We ascertained that, compared to going straight, drivers who performed a variety of maneuvers had a lesser chance of being injured in a traffic crash (lane related 36%; other maneuvers 41%; making a left turn 34%). Conversely, in some cases, we have reports from families and friends that older drivers commit lane-related errors that may endanger them.
Discussion: We deduced that the physical environment may enhance (quantitative findings) or endanger (qualitative findings) safe driving. Thus, the physical environment is linked to driving behavior, specifically driver skill and competence (predisposing).
Implications: Drivers may need to undergo assessment for determining driver competence. A variety of self-assessments (Driving Decisions Workbook (CitationEby et al 2000); or Roadwise Review (AAA 2005)) and professional assessments (American Medical Association (CitationWang et al 2003)) are available.
Societal implications: These findings extend to society as they call for environmental modifications such as highway design (CitationStaplin et al 2001) or improved crashworthiness of vehicles (CitationNHTSA 2006c).
Finding 9: Gender (health domain)
Quantitative: Compared to male drivers, female drivers were 1.5 times more likely to be injured in a crash.
Qualitative: Older women, whose spouses have died, voiced feelings of insecurity due to a lack of driving experience, and about their driving skills and competencies (CitationSterns et al 1997, p 41).
Comparison or integration: Compared to male drivers, female drivers had an increased risk of crashes, injuries, and fatalities; and these findings are supported by older driver literature (CitationFinison and Dubrow 2002; CitationBaker et al 2003; CitationBauer et al 2003; NHTSA 2004). The qualitative data (CitationSterns et al 1997) are in concert with these findings and bring the understanding that safety risks may be remedied by enhancing the driving skills of female drivers.
Discussion: These findings target females as a high risk group.
Implication: Targeted interventions may be directed towards females to enhance their driving skills and competencies. Strategies may include driver education, driving refresher courses, proper ergonomics (car fit) or proper vehicle selection, and self or professional assessment methods.
Finding 10: Road surface condition (physical environmental domain)
Quantitative: Compared to dry road conditions drivers were 1.5 times more likely to be injured in crashes with adverse road conditions.
Qualitative: Family members related that their at-risk older driver had limited him or herself to driving during the day, in certain kinds of traffic, and in good weather (CitationSterns et al 1997, p 49); avoided driving in ice and snow (CitationKostyniuk and Shope 1998, p 9); reduced or eliminated night driving in the rain (CitationKostyniuk and Shope 1998, p 9); or pulled over in the rain (CitationBurkhardt et al 1998, p 72).
Comparison or integration: Compared to dry road conditions, drivers were 1.5 times more likely to be injured in crashes with adverse road conditions. From the qualitative findings, we have testimonies from older drivers and their families that they mostly employ self-restriction strategies to avoid driving in adverse conditions, when the roads are more likely to be wet or slippery.
Discussion: Road surface conditions, a component of the physical environment, yielded an increased likelihood of injuries for all drivers if the roads were not dry. This finding is supported by the qualitative data, but contradicts previous findings (CitationFinison and Dubrow 2002; CitationBaker et al 2003; CitationAwadzi et al 2006) suggesting that crashes are more likely to occur under optimal conditions. However, we clearly see a relationship among the physical environment, predisposing domain (eg, making safer choices) and driving behaviors (manifestation of self-regulatory strategies).
Implication: These findings have educational implications, especially as it pertains to those groups not using self-regulatory strategies.
Finding 11: State policies (enabling domain)
Quantitative: An interesting finding emerged as we examined how state policies influenced safety outcomes in driving for older drivers. Drivers with licenses from states with age renewal policies (p < 0.01), and those from states with in-person renewal (p ≤ 0.01) had lower percentages of injury compared to those from states with no age-related renewal policies or no in-person renewal policies. No significant differences existed in injury rates between states with and without reduced renewal cycles (p = 0.59), and states with and without test requirements (p ≤ 0.46) (vision, medical and road).
Qualitative: While seniors were concerned about lack of age limits on license renewal by mail, they also expressed that licensing procedures based on age could be discriminatory (CitationKerschner and Aizenberg, 1999). Seniors tended to have strong opinions either for or against additional testing based on age (CitationKerschner and Aizenberg, 1999). A second focus group study with a greater percentage of former drivers had respondents that were more in favor of age-based licensing procedures. “It would be okay, I would like it [to have driving tests every two to four years]” (CitationBurkhardt 1998, p 179).
Comparison or integration: The quantitative data show an overall relationship between age-related licensing policies and decreased injury among older drivers. However, upon further analyses, only one out of three age-related policies showed a significant decrease in injury. The qualitative data show that seniors recognize the impact of licensing procedures on safety. However, they felt that changes in licensing targeting older adults infused discrimination, and if applied, changes should pertain to all drivers. The quantitative and qualitative data support age-related licensing policies as a potential avenue for influencing older driver safety.
Discussion: From the perspective of the PPMHP, licensing procedures are enabling factors that have the potential to influence safety. In-person renewal has been associated with reduced fatality rates among drivers over 85 years, with other age-renewal policies such as vision and road tests insignificantly associated with injury, and confirmed through previous research (CitationGrabowski et al 2004). However, CitationLevy et al (1995) found that state mandated vision tests were associated with reduced fatal crash risk for drivers 70 years and older. Further research is needed to clarify specific licensing procedures associated with reduced injury and fatality risk.
Other significant quantitative findings
In the absence of available qualitative data, some significant quantitative findings (protective and risk factors) could not be compared or integrated. Protective factors (reduction in risk of injury) pertaining to the physical environment included vehicle body type (light pickups and vans), not traveling on the national highway system, traveling in urban areas, and not having the airbags deployed. Inherent to some of these factors were the use of passive protective strategies, for example, vehicle body type and travel in urban areas (more structured environment), which has implications for education in an intervention plan. However we also recognize that these variables may be proxies for other underlying factors. For example driving at low speed may partly explain the protective nature of not traveling on the national highway system, or not having the airbags deployed; which of course underscores the continued need for proper speed enforcement. Risk factors pertained to the physical environment and unsafe behavior and included not having a compliant drivers’ license, using alcohol, not using restraints, traveling on all days of the week except Sundays, and experiencing harmful events (collision with a fixed object, collision while the motor vehicle was in transport, and rollover crashes). Although most of these risk factors were not surprising we were amazed by the magnitude of the most harmful events where drivers had up to a 266 increased likelihood of sustaining injuries in crashes. Many educational and law enforcement strategies already exist to manage most of these risk factors and we support the continuation of those.
Implication: The effects of the most harmful event are perhaps best prevented by a combination of strategies pertaining to environmental redesign (eg, replacing concrete divides with cable barriers), legislation mandating crashworthiness (eg, electronic stability control or anti-rollover technology in all motor vehicles by 2009) (CitationNHTSA 2006c), and continued use of protective devices (safety belts) and observance of traffic laws.
Other significant qualitative findings
Economic environment
Four of the six studies revealed perspectives to help elucidate the relationship of the economic environment to safe and unsafe driving as it pertained to the costs of maintaining a personal vehicle (including insurance), the responsibility and power afforded to family members who take over the costs for insurance and vehicle maintenance, the high and low costs of alternative transportation, and the perceived financial-related pros and cons of using alternative transportation as opposed to maintaining a personal vehicle. The economic factors influenced the decisions of the older drivers (following rules set by adult children or to seek driving assessments), thus establishing a link with behavioral domain.
Implication: To better understand the impact of the environment (both social and economic) on behavior, we have identified the need for prospective, multi-disciplinary research that tracks the processes (personal readiness to change, normative beliefs of influential others, economic incentives and deterrents, service availability and accessibility, and professional support) involved with the decision to continue or cease driving.
Service environment
Four of the six research studies revealed perceptions and preferences about assessment, education or counseling services. A lack of knowledge exists among older drivers about the available resources and psychological deterrents are evident that may prevent them from seeking help (CitationKerschner and Aizenburg 1999). We surmised that a disconnect exists between available resources and services used by older drivers, their families, and friends.
Implication: Imparting this knowledge will be an important consideration for intervention planning.
Activities/participation
For drivers who employed driving restrictions, these actions resulted in severe activity limitations and reduced societal participation (CitationBurkhardt et al 1998; CitationKostyniuk and Shope 1998; CitationKerschner and Aizenburg 1999). Self-restriction (day time driving only, going to essential versus “fun” places, decreased driving frequency) is a positive decision as it pertains to older adults being safe on the road, but a decision that has negative consequences on their activities (giving up visiting friends), societal participation and psychological well-being. Epidemiological studies showing a cause-effect relationship between stopping driving and increased social isolation, onset of depression, and decreased quality of life (CitationMarottoli et al 1997, Citation2000) support these findings. A new finding emerges: the importance of “destinations” where needs for societal participation are met. From the PPMHP, the health domain (body structure and function, activities, participation) greatly contributes to quality of life. Participation, a “higher level” of health and a catalyst for well-being (CitationWHO 2001), is negatively impacted by self- restriction and cessation.
Implications: Society (policy makers, researchers, city planners, transportation providers and other agents of the aging network) must therefore consider adopting the moral responsibility to offer policies, structure, support and resources, to optimize mobility options for enhancing older adults’ societal participation.
Health promotion plan for safe elderly driving
In considering each of the 11 findings we ascertained that the multiple risk factors can perhaps be best reduced, and protective factors be best enhanced, through a multi-level (individual-, community- or population-level), multi-causal (health, environmental, behavioral) health promotion program. presents a health education program for safer driving which includes increasing knowledge on health–related factors (eg, on the impact of aging or gender) to unsafe driving outcomes; raising awareness on the benefits of using self-regulating strategies to negotiate the physical environment (hour of day or road conditions); increasing insight on the advantages of restructuring the social environment (presence of passengers in car); furthering realization about the economic costs involved with maintaining a vehicle and considering alternatives to driving; increasing understanding on the availability of community based resources and services (eg, self-assessment programs, web-sites containing helpful hints, or providers of transportation in their areas); and the role of state policies and licensing laws.
Figure 3 Health promotion intervention on empirically determined modifiable determinants of motor vehicle crashes with anticipated intermediate and long-term outcomes for older drivers.
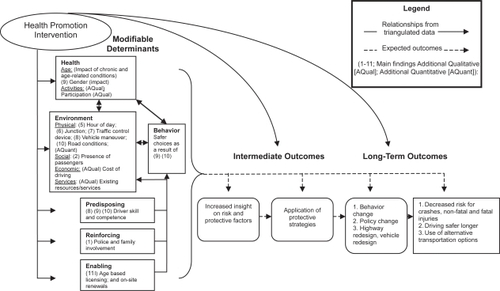
These 11 findings illustrate, unlike the current mainstream literature, the critical importance of the environment on driving outcomes. From the systematic literature review (SLR) on older driver safety CitationClassen, Garvan et al (2006) ascertained that the environmental domain is understudied. Where only 20% of studies included in that SLR focused on the role of the environment, this current study found environmental variables from the physical, social, economic and service categories to be important determinants of safe driving outcomes.
In the compared or integrated findings suggest interrelationships among the PPMHP domains and safer driving outcomes. For example females (health domain) have a higher propensity for injurious crashes, and voiced feelings of insecurity about driving skills and competence (predisposing domain) as they lacked adequate driving experience. We anticipate that a health education program, directed towards females, will not only increase their driving skill and competence (intermediate objectives), thereby influencing safe driving behaviors (behavioral domain), but also contribute to decreased risk for crashes (long-term objective).
The outcomes of the health promotion program may be measured on two levels: intermediate (3 months–1 year) and long-term outcomes (1–5 years). We anticipate immediate changes to occur on the level of knowledge, awareness, and insight. These changes will elicit behavioral changes indicative of safer choices and actions. Ultimately, following the postulates of the PPMHP model, we should be able to measure safer driving outcomes as indicated by decreased morbidity and mortality, as well as appropriate use of alternative transportation. Additionally community organizing efforts may further influence safe mobility initiatives, including third party payer reimbursement for driving evaluations, or safer vehicle and driving environment designs.
The limitations of this study pertain to the heterogeneity of datasets. Unlike the FARS dataset, which were based on crashes in which a fatality occurred, the qualitative data focused on driving and alternative forms of transportation among older adults and their stakeholders. Although we have taken measures to reduce the distilled effect of the qualitative information, we recognize that researcher bias could have influenced the analysis and interpretation of the final findings. Nevertheless, this model driven mixed method research has enabled us to understand our data within the context of the participants’ experiences, both from a multitude of compared or integrated determinants, and from a public health perspective. As such we identified the critical determinants for older driver safety and constructed a multi-level, multi-causal health promotion plan, with measurable outcomes. Although much needs to be done to discern the exact details of the intervention, this research positions us to finalize the empirically driven health promotion program.
Conclusion
Via the guiding principles of the PPMHP, and from an analysis of a national crash dataset, this study identified and quantified the socio-ecological determinants of safe/unsafe driving among older adults. Using a mixed methods approach we compared or integrated the risk and protective factors (obtained from the logistic regression model) with the stakeholder perspectives (obtained from six qualitative studies). From this work we identified the critical multi-causal factors for safe elderly driving; showed the importance of the environmental factors - previously underrated in the literature- as they interact with the behavioral and health factors; and illustrated the inter-relatedness among these main domains and the underlying predisposing, reinforcing and enabling factors. As such, for the first time to our knowledge, we conceptualized the fundamental elements of a multi-causal health promotion plan, with measurable intermediate and long-term outcomes. After developing the detailed plan we will be able to test the effectiveness of this intervention on multiple levels (individual-, community- or population-based).
Acknowledgements
This research is funded by the US Dept. of Health and Human Services and the Centers for Disease Control and Prevention, sponsor award # K01 CE000497 (2004–2007). The principal investigator is Dr. Sherrilene Classen, Department of Occupational Therapy, College of Public Health and Health Professions, University of Florida (UF).
References
- [AAA] American Automobile Association2004Roadwise Review [computer program]Heathrow, FlAAA Public Affairs
- [AOTA] American Occupational Therapy Association2003AOTA releases older driver conference report [online] Accessed 9 September 2006. URL: http://www.aota.org/nonmembers/area1/links/link271.asp
- [AOTA] American Occupational Therapy Association2004Tips for living: keeping older drivers safe [online] Accessed 9 September 2006. URL: http://www.aota.org/featured/area6/docs/driver.pdf
- AwadziKClassenSGarvanC2006Determinants of older driver safety from a socio-ecological perspectiveTop Ger Rehabil223644
- BakerTKFalbTVoasR2003Older women drivers: fatal crashes in good conditionsJ Safety Res3439940514636662
- BauerMJAdlerGKuskowskiMA2003The influence of age and gender on the driving patterns of older adultsJ Women Aging1531614750586
- BédardMMeyersJR2004The influence of passengers on older drivers involved in fatal crashesExp Aging Res302051515204633
- BenekohalRFResendePShimE1992Highway operations problems of elderly drivers in IllinoisPublication No. FHWA-IL-023. Springfield, ILIllinois Department of Transportation
- BlakeRL1989Integrating quantitative and qualitative methods in family researchFam Syst Med741127
- BurkhardtJEBergerAMCreedonM1998Mobility and independence: Changes and challenges for older driversBethesda, MDEcosometrics
- [CDC] Centers for Disease Control2004aPreventing injuries among older adults [online] Accessed 8 September 2006. URL: http://www.cdc.gov/programs/injury07.pdf
- [CDC] Centers for Disease Control2004bInjury fact book. Older adult drivers 2004 [online] Accessed 9 September 2006. URL: http://www.cdc.gov/ncipc/fact_book/18_Older_Adult_Drivers.htm
- CharltonJLOxleyJFildesB2006Characteristics of older drivers who adopt self-regulatory driving behavioursTransportation Research Part F: Traffic Psychology and Behavior936373
- ClassenSGarvanCWAwadziK2006Systematic literature review and model for older driver safetyTop Ger Rehabil22879
- ClassenSLopezEDS2006Mixed methods approach explaining process of an older driver safety systematic literature reviewTop Ger Rehabil2299112
- ClassenSShechtmanOStephensB2006The impact of roadway intersection design on driving performance of young and senior adults: Preliminary resultsTop Ger Rehabil221826
- CoughlinJMohydeMD’AmbrosioLA2004Who drives older driver decisions [online] Accessed 4 October 2006. URL: http://web.mit.edu/agelab/news_events/pdfs/AgeLab_driver_decision.pdf
- CrabtreeBF2005Practical strategies for combining qualitative and quantitative methods Qualitative and mixed method research: improving the quality of science and addressing health issues of diverse populationsGerontological Society of America, Preconference Workshop18 November 2005Orlando, Florida
- CreswellJWPlano-ClarkVLGuttmannM2003Advanced mixed method research designsTashakkoriATeddlieCHandbook on mixed methods in the behavioral and social sciencesThousand Oaks, CASage20940
- CreswellJWFettersMDIvankovaNV2004Designing a mixed methods study in primary careAnn Fam Med271215053277
- DellingerAMLangloisJALiG2002Fatal crashes among older drivers: decomposition of rates into contributing factorsAm J Epidemiol1552344111821248
- DenzinNK1989The research Act: A theoretical introduction to sociological methods3rd edEnglewood Cliffs, NJPrentice Hall
- EbyDWMolnarLJShopeJT2000Driving decisions workbook (Report Number: UMTRI-2000-14) [online] Accessed 11 October 2006. URL: http://hdl.handle.net/2027.42/1321
- FinisonKSDubrowRB2002A comparison of Maine crashes involving older driversNHTSAWashington D.C DOT HS 809407
- FoleyDJHeimovitzHKGuralnikJM2002Driving life expectancy of persons aged 70 years and older in the United StatesAm J Public Health921284912144985
- FrankishJVeenstraGMoultonG1999Population health in Canada: Issues and challenges for policy, practice and researchCan J Public Health90Suppl 1S71510686768
- FreemanEEGangeSJMunozB2006Driving status and risk of entry into long-term care in older adultsAm J Public Health961254916735633
- GrabowskiDCCampbellCMMorriseyMA2004Elderly licensure laws and motor vehicle fatalitiesJAMA2912840615199034
- GreenLWKreuterMW1999Health Program Planning: An educational and ecological approach3rd edMountain View, CAMayfield Publishing
- GreenLWOttosonJM1999Community and Population Health8th edSt Louis, MissouriMcGraw-Hill
- HingJYStamatiadisNAultman-HallL2003Evaluating the impact of passengers on the safety of older driversJ Safety Res343435114636656
- [IIHS] Insurance Institute for Highway Safety2003Fatality facts, older people [online] Accessed 28 January 2004. URL: http://www.highwaysafety.org/safety_facts/fatality_facts/older_people.htm
- [ICADTS] International Council on Alcohol, Drugs and Traffic Safety2006Categorization system for medicinal drugs affecting driving performance [online] Accessed 9 September 2006. URL: http://www.icadts.org/reports/medicinaldrugs1.pdf
- JanicakCA2003Differences in relative risks for fatal occupational highway transportation accidentsJ Safety Res345394514733988
- JohnsonJ1998Older rural adults and the decision to stop driving: The influence of family and friendsJ Community Health Nurs15205169834557
- JohnsonJ2002Why rural elders drive against adviceJ Community Health Nurs192374412494744
- KerschnerHAizenburgR1999Transportation in an aging society [online] Accessed 11 October 2006. URL: http://www.beverlyfoun-dation.org/resourcestore/pdf/research_papers/transportation_in_an_aging_society.pdf
- KostyniukLPShopeJT1998Reduction and cessation of driving among older drivers: focus groups (University of Michigan Transportation Research Institute Rep. No. UMTRI-98-26)Ann Arbor, MIUMTRI
- LangfordJKoppelSCharltonJ2006A re-assessment of older drivers as a road safety riskIATSS Research302737
- LangfordJKoppelS2006Epidemiology of older driver crashes: Identifying older driver risk factors and exposure patternsTransportation Research Part F: Traffic Psychology and Behavior930921
- LevyDTVernickJSHowardKA1995Relationship between driver’s license renewal policies and fatal crashes involving drivers 70 years and olderJAMA27428406
- MarottoliRAMendes de LeonCFGlassTA1997Driving cessation and increased depressive symptoms: Prospective evidence from the New Haven EPESEJ Am Geriatr Soc4520269033520
- MarottoliRAMendes de LeonCFGlassTA2000Consequences of driving cessation: Decreased out-of-home activity levelsJ Gerontol B Psycholological Science Social Sciences55S33440
- McGwinGJrSimsRVPulleyL2000Relations among chronic medical conditions, medications, and automobile crashes in the elderly: A population-based case-control studyAm J Epidemiol1524243110981455
- MuhrT2004ATLASti (Version 50) [computer program]BerlinScientific Software Development
- [NHTSA] National Highway Traffic Safety Administration2001Traffic safety facts 2000: older populationWashington, D.CNHTSA
- [NHTSA] National Highway Traffic Safety Administration2006aHow to understand and influence older drivers [online] Accessed 4 October 2006. URL: http://www.nhtsa.dot.gov/people/injury/olddrive/UnderstandOlderDrivers/2911OlderDriverSafety.pdf
- [NHTSA] National Highway Traffic Safety Administration2006bTraffic safety facts 2004. Older population [online] Accessed 17 January 2006. URL: http://www-nrd.nhtsa.dot.go-v/pdf/nrd-30/ncsa/TSF2004/809910.pdf
- [NHTSA] National Highway Traffic Safety Administration2006cDOT proposes anti-rollover technology for new vehicles [online] (Press release September 14, 2006). Accessed 27 September 2006. URL: http://www.nhtsa.dot.gov
- National Institutes of Health. Office of Behavioral and Social Science Research1999Qualitative methods in health research: Opportunities in consideration and reviewWashington, D.CNational Institutes of Health
- Oregon State University2003Driving decisions in later life [online] [Publication No. PNW 510]Oregon State University: A Pacific Northwest Extension Publication Accessed 30 September 2006. URL: http://exten-sion.oregonstate.edu/catalog/pdf/pnw/pnw510.pdf
- ShechtmanOClassenSStephensB2006The impact of intersection design on simulated driving performance of young and senior adults: preliminary resultsTop Ger Rehabil222735
- StaplinLLococoKByingtonS2001Highway design handbook for older drivers and pedestrians [Report number FHWA-RD-01-103]Washington, DCFederal Highway Administration
- StephensBWMcCarthyDMarsiskeM2005International older driver consensus conference on assessment, remediation and counseling for transportation alternatives: Summary and recommendationsPhys Occup Ther Geriatr2310321
- SternsHLSternsRAizenbergR1997Family and friends concerned about an older driver (Final Focus Group Report)Akron, OHCreative Action
- StraussACorbinJ1998Basics of qualitative research: Techniques and procedures for developing grounded theory2nd edThousand Oaks, CASage
- TashakkoriATeddlieC1998Mixed methodology: Combining qualitative and quantitative approachesThousand Oaks, CASage
- [US DOT] United States Department of Transportation2003Fatality Analysis Reporting System (FARS) 2003 [data file] Available at National Highway Transportation Safety Administration Website, URL: http://www.nhtsa.gov
- WangCCKosinskiCJSchwartzbergJG2003Physician’s guide to assessing and counseling older driversWashington, DCNHTSA
- WilliamsAFFergusonSA2002Rationale for graduated licensing and the risks it should addressInj Prev8Suppl 2ii91612221025
- [WHO] World Health Organization2001The international classification of functioning, disability and healthGenevaWorld Health Organization