 ?Mathematical formulae have been encoded as MathML and are displayed in this HTML version using MathJax in order to improve their display. Uncheck the box to turn MathJax off. This feature requires Javascript. Click on a formula to zoom.
Abstract
Nocturnal bronchoconstriction is a common symptom of asthma in humans, but is poorly documented in animal models. Thoracoabdominal asynchrony (TAA) is a noninvasive clinical indication of airway obstruction. In this study, respiratory inductive plethysmography (RIP) was used to document nocturnal TAA in house dust mite (HDM)-sensitive Cynomolgus macaques. Dynamic compliance (Cdyn) and lung resistance (RL) measured in anesthetized animals at rest and following exposure to HDM allergen, methacholine, and albuterol were highly correlated with three RIP parameters associated with TAA, ie, phase angle of the rib cage and abdomen waveforms (PhAng), baseline effort phase relation (eBPRL) and effort phase relation (ePhRL). Twenty-one allergic subjects were challenged with HDM early in the morning, and eBPRL and ePhRL were monitored for 20 hours after provocation. Fifteen of the allergic subjects exhibited gradual increases in eBPRL and ePhRL between midnight and 6 am, with peak activity at 4 am. However, as in humans, this nocturnal response was highly variable both between subjects and within subjects over time. The results document that TAA in this nonhuman primate model of asthma is highly correlated with Cdyn and RL, and demonstrate that animals exhibiting acute responses to allergen exposure during the day also exhibit nocturnal TAA.
Introduction
Allergic asthma is a common disease in developed countries, with an incidence of approximately 8% in the US.Citation1 Nocturnal symptoms of asthma are common and include bronchoconstriction, airway inflammation and hyperreactivity, dyspnea, cough, and apnea.Citation2–Citation6 The incidence and magnitude of nocturnal asthma is variable. Approximately 70% of asthmatics experience nocturnal symptoms at least once per week, and 10% experience nocturnal symptoms at least three times per week.Citation7 Nocturnal symptoms can be severe, and a high incidence of respiratory arrest and deaths due to asthma is seen between midnight and 8 am.Citation8–Citation10 The mechanisms underlying nocturnal asthma have not been elucidated.
Early and late asthmatic responses have been routinely investigated using animal models, but nocturnal symptoms are poorly documented in these models due in part to the nocturnal nature of rodents and to the techniques commonly used to assess bronchoconstriction in larger diurnal laboratory animals. Respiratory inductive plethysmography (RIP) is a noninvasive technique for monitoring breathing patternsCitation11–Citation26 and may be applicable to nocturnal studies in large animals. RIP uses deflection of the ribcage and abdomen to estimate changes in lung volume and airflow, and the phase relationship of abdominal and thoracic movements. Restricting airflow through the airways causes movements of the thorax and abdomen to be out of phase, giving rise to thoracoabdominal asynchrony (TAA). TAA is a common clinical indicator of airway obstruction,Citation15,Citation27–Citation31 and in this study was used to detect nocturnal respiratory disturbances.
Nonhuman primates (NHP) exhibit a high level of similarity to humans in genetic, anatomic, and physiologic aspects, and are well suited to modeling human diseases (eg, asthma).Citation32 The house dust mite (HDM) model of allergic asthma in Cynomolgus macaques reproduces the key features of human asthma, including elevated serum IgE levels, β-agonist reversible bronchoconstriction, and late-phase eosinophilic inflammation.Citation33 In addition, the airways become hyperresponsive to nonspecific bronchoconstrictors including histamine, methacholine, and adenosine.Citation33,Citation34 CD4+ T lymphocytes and natural killer T cells in bronchoalveolar lavage fluid are increased, and Th2 lymphocyte cytokines are upregulated.Citation35 The severity of the asthma phenotype in the NHP model depends on the schedule of allergen challenges and the provocative dose of HDM. At an exposure periodicity of 4–6 week intervals, as used in this study, the animals have minimal symptoms between exposures, but on the day of provocation, exhibit a severe acute asthmatic response, including decrease in arterial O2 saturation to less than 80% and in some animals less than 70%. Upon resolution of the acute response, the animals develop eosinophilia that is equivalent to what is observed following segmental allergen challenge in asthmatic humans.Citation36 As in humans, the symptoms are attenuated with corticosteroids.Citation33,Citation35 Extensive terminal protocols have not been conducted on these animals, but in a few animals that have been examined, airway wall remodeling and mucosal eosinophilia has been observed.Citation33 These characteristics are consistent with mild to moderate intermittent asthma in humans that is well controlled by β-agonists and corticosteroids.
The goal of this study was to determine if aerosol allergen exposure elicits a delayed, nocturnal response in HDM-sensitive NHP. Nonallergic and HDM-sensitive animals were identified from within an existing colony of Cynomolgus macaques. Correlation between RIP measurements and direct measures of lung resistance (RL) and dynamic compliance (Cdyn) were explored by inducing acute bronchoconstriction with aerosolized methacholine and HDM allergen. RIP parameters indicative of TAA exhibited a high degree of correlation with the conventional measures of airway function. The animals were subsequently challenged with aerosolized saline or HDM allergen, and TAA was monitored by RIP for 20 hours to detect nocturnal disturbances in respiration.
Methods
Overview
Cynomolgus macaques with documented sensitivity to aerosolized HDM for two or more years prior to the study were identified within an existing colony at East Carolina University. Animals with no history of allergic sensitivity were used as nonallergic controls. Allergy status at the time of the study was confirmed by serum levels of HDM-specific IgE, early-phase bronchoconstriction to aerosolized HDM, and late-phase elevation of eosinophils in bronchoalveolar lavage fluid ().
Table 1 Characteristics of nonallergic and allergic groups
RIP parameters indicative of TAA were validated by simultaneous RIP and conventional determination of RL and Cdyn. In an initial session, spontaneously breathing animals were challenged with increasing cumulative doses of aerosolized methacholine to induce graded changes in RL and Cdyn. Four weeks later, bronchoconstriction was induced with aerosolized HDM allergen, and then reversed by aerosolized albuterol. Correlations between RIP parameters, RL, and Cdyn were then determined.
Following the validation phase of the study, nocturnal responses to daytime allergen challenge were investigated. Animals were challenged with aerosolized saline or HDM allergen early in the morning. TAA was then monitored by RIP throughout the rest of the day and overnight.
Animals
Over a 10-year period prior to the study, 38 Cynomolgus macaques were obtained from Alpha Genesis, Inc. (Yemassee, SC) and sensitized to HDM as described previously.Citation33,Citation34 Briefly, the animals were sensitized by intra-peritoneal injections of Dermatophagoides pteronyssinus and Dermatophagoides farinae extract adsorbed to Alum (156 units of each allergen [Greer Laboratories, Lenoir, NC]; Imject Alum [Pierce, Rockford, IL]) at 2–4 week intervals for six months. Chronic airway disease was induced by subsequent periodic exposure to HDM aerosol at 4–6 week intervals. At the time of the study, the animals ranged in age from 3.6 to 9.4 years, weighed 2.3 to 7.5 kg, and had exhibited allergic asthma symptoms for 1–8 years.
The animals were group-housed in accordance with US Department of Agriculture guidelines within a BSL2 facility at East Carolina University, which is fully accredited by the Association for the Assessment and Accreditation for Laboratory Animal Care, International. All protocols were approved by the Institutional Animal Care and Use Committee of East Carolina University.
Exposure to allergen between intentional provocations was minimized by HEPA (high efficiency particulate air) filtration of all air circulating through the animal rooms, rinsing the rooms and cages with pressurized water twice each day, and running the cages through an automated washer weekly. All personnel entering the rooms wore appropriate personal protective gear.
Enzyme-linked immunosorbent assay for allergen-specific IgE
Serum levels of HDM-specific IgE were measured as described previously.Citation33 Ninety-six well plates were coated with HDM allergen (10 μg/mL per well, incubated overnight at 4°C in 0.01 M sodium bicarbonate buffer, pH 9.6). The plates were blocked with 10% fetal bovine serum; 100 μL of serum (1:100 dilutions) was added to the wells. The plates were incubated overnight at 4°C. IgE was detected by incubating with 1 μg/mL biotinylated goat anti-human IgE (Vector Lab, Burlingame, CA) for one hour at room temperature, and then developing with streptavidin-conjugated horseradish peroxidase (BD PharMingen, San Diego, CA) and 3,3’,5,5’-tetramethylbenzidine (BD PharMingen). The reaction was stopped by addition of sulfuric acid, and the absorbance at 450 nm was determined. Relative IgE titers were determined by comparison with a serum sample pooled from a group of highly allergic animals.
Determination of lung resistance and dynamic compliance
Animals were anesthetized with Telazol® 2.0 mg/kg, intra-muscularly, stabilized on propofol (10 to 15 mg/kg/hour, intravenously), and intubated. RL, Cdyn and respiratory rate (RR) were measured by a conventional pressure-flow technique.Citation33,Citation34 Tracheal airflow was measured using a heated Fleisch Pneumotachograph (size 00, Fleisch, Lausanne) connected to a Validyne pressure transducer (Model DP 45-14, Validyne Engineering, Northridge, CA). Intrathoracic pressure was measured using an esophageal balloon connected to a Model DP 45-24 Validyne pressure transducer. Flow and pressure signals were analyzed using a MuMed PR800 lung function recorder (MuMed, London). Baselines of RL, Cdyn, and RR were determined during a one-minute period of quiet breathing. Subsequent responses to aerosolized saline (vehicle), methacholine, HDM, and albuterol were expressed as raw data or as a percentage change from baseline or saline as appropriate.
House dust mite challenge
Baseline pulmonary function was recorded. The animals were challenged for four minutes with nebulized sterile saline delivered through the endotracheal tube (Devilbiss Ultrasonic Nebulizer, SUN-99HD, Red Lion, PA or Nouvag Ultrasonic 2000, Nouvag). Condensation on the inner surface of the endotracheal tube was cleared by aspiration, and pulmonary function was monitored for one minute. The challenge was repeated with increasing concentrations of nebulized HDM allergen (1, 10, 100, 500, 2500 AU/mL) until a 100% increase in RL or a 50% decrease in Cdyn was observed.Citation33 Once the target change in RL or Cdyn was observed, pulmonary function was monitored at five-minute intervals for 15 minutes. Following the last recording, the animals were treated with nebulized albuterol sulfate (four minutes, 0.083% solution, Ventolin Nebules, Orlando, FL).
Arterial oxygen saturation was monitored by pulse oximetry (SurgiVet Model V3304, Harvard Apparatus, Holliston, MA or Cardell® Model 9403 and 9405, Sharn Veterinary Inc., Tampa, FL), and supplemental O2 was delivered as needed to maintain O2 saturation above 70%.
Methacholine challenge
Animals were anesthetized and instrumented as described earlier. Baseline pulmonary function was recorded, and sterile saline was delivered for two minutes. Condensation on the tube was cleared by aspiration, and pulmonary function was monitored for one minute. Cumulative doses of methacholine (A2251, Sigma, St Louis, MO) between 0.001 mg/mL and 10 mg/mL were delivered until a 100% increase in RL and/or a 50% decrease in Cdyn was observed.Citation33 The range of aerosolized methacholine doses was based on previous experience with this model,Citation33 published results from tissue bath experiments,Citation37,Citation38 and empiric observations with this cohort of animals. A methacholine concentration of 0.001 mg/mL did not induce bronchoconstriction, whereas concentrations greater than 10 mg/mL induced high levels of secretions in the airways. Therefore, 10 mg/mL methacholine was chosen as the upper level. The provocative concentration of methacholine leading to a 50% maximal response (PC50) for RL, Cdyn, and RR was calculated for individual animals, and then mean PC50 was determined for all animals.
Endotracheal bronchoalveolar lavage
Twenty-four hours after HDM challenge, the animals were anesthetized with Telazol and propofol, then intubated. A sterile 2.5 mm OD Tygon tube was wiped with Surgilube®, advanced through the endotracheal tube, and gently wedged into an airway. The lung segment beyond the tip of the catheter was lavaged with 7 mL of sterile saline, which was collected by gentle aspiration. Total cell counts were determined using a Coulter Counter (Beckman Coulter Instruments, Miami, FL). Slides were generated using a Cytospin and stained with DiffQuik (VWR Scientific, So. Plainfield, NJ). Manual differential cell counts were acquired by counting 200 cells per sample.
Respiratory inductive plethysmography
RIP parameters were measured using the LifeShirt System (Vivometrics, Inc., Ventura, CA). The LifeShirt incorporated two parallel sinusoidal wire arrays encircling the thorax and abdomen. A small alternating current was passed through the wires, inducing a magnetic field. Changes in the shape of the arrays during breathing altered the magnetic field, inducing a current that was detected as a change in the frequency of the applied current, which translated into lung volumes and flows on a breath-by-breath basis through coefficients obtained during calibration procedures. Changes in animal posture and activity were monitored by accelerometers in the jackets allowing movement artifacts to be filtered out of the dataset.Citation39–Citation41
Animals were fitted with the LifeShirt jackets such that the rib cage band was positioned over the sternum and the abdominal band positioned immediately cephalad to the pelvic girdle.Citation41 The circumference of each band was adjusted to provide rib cage and abdomen deflections of 20 to 200 assumed milliliters (AmL) prior to calibration. The LifeShirt jackets were fitted on the animals before any airway challenges began and were left on for about 24 hours. Raw data records were analyzed with VivoLogic software (Vivometrics, Inc.). The default settings were overridden to permit analysis of the small tidal volumes (100% tidal volume = 40 AmL; minimum acceptable tidal volume = 2.5%; minimum acceptable effort volume = 2.5%). A fixed volume calibration was then performed using the tidal volumes recorded by the MuMed lung function recorder during the one-minute baseline period.Citation42,Citation43 The calibrated records were used to determine the RIP parameters (expressed as calibrated raw data or as a percentage change from baseline, see below) to be compared with simultaneously determined conventional measures of RL and Cdyn.
Three RIP-derived parameters analyzed by the LifeShirt software were used as indicators of TAA, ie, phase angle (PhAng) of the abdomen and rib cage waveforms, baseline effort phase relation (eBPRL), and effort phase relation (ePhRL). PhAng is a common parameter used to compare the initial slopes of two sinusoidal waveforms.Citation44 As abdominal and thoracic movement become asynchronous, PhAng increases. Effort parameters provide an indication of the amount of time during a breath that deflection of the abdomen and chest wall are asynchronous (ie, the two are moving in opposite directions instead of in unison). eBPRL is the percentage of time during inspiration that the rib cage is moving in the opposite direction from the abdomen, and ePhRL is the percentage of time during the total breath that the rib cage and abdomen are moving in opposite directions. Thus, TAA is associated with increases in PhAng, eBPRL, and ePhRL.
Nocturnal study
Following HDM provocation, the animals were recovered from anesthesia and returned to their cages. RIP readouts were monitored continuously until the next morning. The lower threshold for movement artifact was set as the maximum acceleration values associated with quiet breathing for each animal while under anesthesia. All records associated with accelerations greater than this maximum value were removed from the dataset.
Thirty-minute averages of eBPRL and ePhRL (but not PhAng, see Results section) were plotted from 1 pm the day of HDM provocation until 6 am the next day. A 30-minute period between 1 pm and 10 pm was identified during which there was little animal movement and low incidence of TAA (ie, minimum average eBPRL or ePhRL for the period, labeled as baseline in ). This relatively normal, quiet breathing period served as a baseline for the nocturnal studies. eBPRL and ePhRL were plotted against time and the area under the curve (AUC) between 10 pm the day of HDM challenge and 5 am the next day was determined using SigmaPlot Version 10 (Systat Software, Inc., San Jose, CA, see ). The AUC was used as an indicator of TAA incidence and to compare nocturnal responses among subjects.
Statistics
Recorded respiratory parameters were expressed as calibrated raw data or as a percentage change from the baseline control period. The relationships between RL, Cdyn, RR, and RIP parameters were investigated by simple and multiple linear regressions using SPSS software (SPSS, Inc., Chicago, IL). The methacholine PC50 of each parameter was determined by Hill fit analysis for each animal (Systat Software, Inc., San Jose, CA). Differences between two means were assessed by Student’s t-test for independent observations (P ≤ 0.05). Differences between three or more means were assessed by one-way analysis of variance (ANOVA) with Tukey HSD post hoc test (P ≤ 0.05). Values are reported as mean ± standard error of measurement.
Results
Methacholine and HDM challenges
To validate RIP as a measure of TAA associated with underlying airway responses, the relationships between RL, Cdyn, and RIP parameters indicative of TAA were defined under controlled conditions where methacholine and HDM were used to induce acute bronchoconstriction, and albuterol to induce bronchodilation.
Nonallergic animals had minimal changes in all parameters at the highest concentration of methacholine (data not shown), whereas in allergic animals the highest concentration of methacholine increased RR and RL and decreased Cdyn. RR exhibited a higher sensitivity to methacholine than Cdyn and RL, while Cdyn exhibited sensitivity to methacholine that was intermediate between RR and RL (). These results were consistent with independent modulation of RR and RL, and with changes in Cdyn that were due to reduced alveolar filling time as RR increased. Multiple linear regression of values recorded before and after methacholine challenge revealed significant associations of RL and Cdyn with eBPRL, ePhRL and PhAng (eBPRL: r = 0.49, P < 0.05; ePhRL: r = 0.41, P < 0.05; PhAng: r = 0.45, P < 0.05).
Table 2 Methacholine PC50 of conventional respiratory indexes
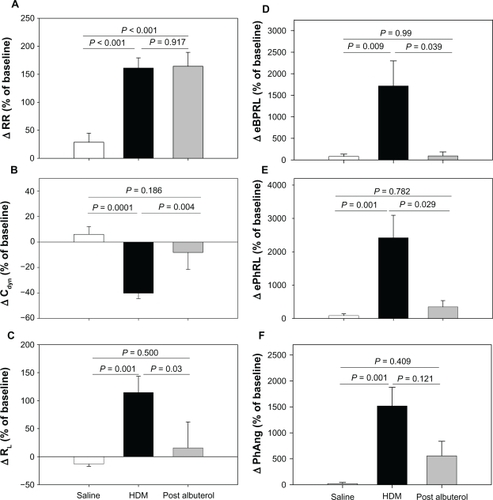
At a later date, the animals were challenged with aerosolized HDM antigen to induce acute bronchoconstriction, and were then treated with albuterol to reverse the HDM-induced bronchoconstriction. When the effects of HDM and albuterol were separated, the RIP parameters tracked closely with changes in Cdyn and RL (). Although the directions of Cdyn and RL were opposite, the relative magnitude of HDM-induced changes were similar (ΔCdyn: P = 0.0001 and ΔRL: P = 0.001, HDM versus saline) and both parameters exhibited at least partial reversal with albuterol ( and ). HDM provoked increases in eBPRL, ePhRL, and PhAng (P < 0.01, HDM versus saline) that were reversed by albuterol (). In contrast, RR increased with HDM (P < 0.001, HDM versus saline), but did not reverse with albuterol (). These results demonstrated that TAA, as measured by changes in RIP, coincided with changes in RL and Cdyn induced by diverse agents.
Figure 1 Responses to sequential exposure of aerosolized saline, maximum concentration of HDM extract, and albuterol. Shown are changes in (A) RR, (B) Cdyn, (C) RL, (D) eBPRL, (E) ePhRL, and (F) PhAng. Responses to saline and HDM were recorded in 23 animals. Albuterol was administered to eight animals exhibiting severe and prolonged increases in airway resistance. The changes were expressed as a percentage of the baseline measurement recorded prior to saline delivery. Values are expressed as means ± SE.
The aggregate HDM and albuterol data were analyzed by multiple linear regression, which revealed associations of RL and Cdyn with eBPRL, ePhRL, and PhAng as described by the following equations (See ):
Table 3 Multiple linear regression results of eBPRL, ePhRL, and PhAng recorded during the first 30 minutes following HDM challenge
Thus, the RIP parameters increased as Cdyn decreased and, independently, after adjustment for Cdyn, the RIP parameters increased as RL increased. The regression equations were consistent with an inverse relation between RL and Cdyn. This relationship was verified by plotting coincident values of RL against Cdyn for data collected during both the methacholine and HDM challenges. The resulting curve exhibited an inverse first-order relationship (r = 0.69, P < 0.05 by simple linear regression of 1/RL versus Cdyn).
Nocturnal asthmatic response to house dust mite challenge
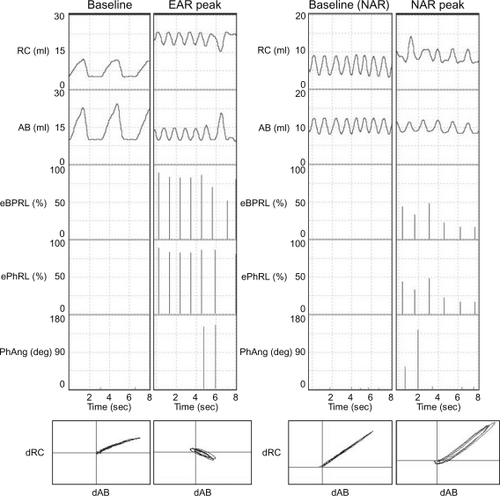
In follow-up experiments to those discussed above, animals were challenged with aerosol HDM between 6 am and 10 am, and then acute bronchoconstriction was reversed with albuterol. The animals were recovered from anesthesia, and returned to their cages. Excursions of the rib cage and the abdomen were monitored continuously until the next morning. shows representative RIP recordings for one animal while anesthetized during the baseline and the early asthmatic response (, left panels), and later while conscious during the afternoon or evening baseline and the nocturnal asthmatic response (, right panels). PhAng (calculated from the Konno-Mead diagram) has been used in previous studies to assess TAA.Citation15,Citation41,Citation44 However, PhAng is affected by the shape of the abdominal and ribcage waveforms, as in Tables and other figures with a triangular waveform being associated with increased error.Citation15,Citation41 Triangular waveforms were commonly observed in the current study () and, therefore, PhAng was not used as an indicator of TAA at night. The effort parameters, eBPRL and ePhRL, correlated well with labored breathing exhibited during the acute response to HDM and methacholine provocation, and were therefore used to monitor for nocturnal respiratory disturbances.
Figure 2 Representative RIP recordings of one animal (ID: 8065) during both the early asthmatic response and the nocturnal asthmatic response. Excursions of the rib cage (RC) and the abdomen (AB), as well as corresponding eBPRL, ePhRL, and PhAng are shown for multiple breaths. Note the triangular RC and AB wave forms, and that eBPRL and ePhRL are better reflections of TAA than PhAng during the early asthmatic response peak and also are good reflections of TAA during the nocturnal asthmatic response peak. The Konno-Mead diagram (bottom of each vertical panel) shows the direction of RC movement (dRC) and the direction of AB movement (dAB) during inhalation and exhalation in three breaths.
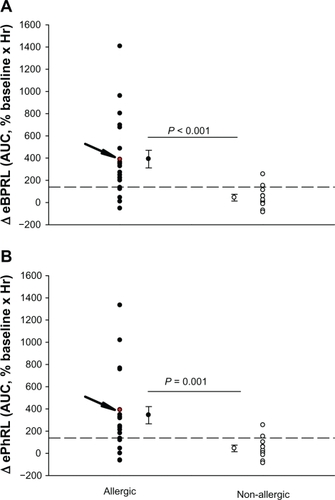
To assess the long-term stability of eBPRL and ePhRL, both parameters were recorded in nonallergic animals overnight. No significant change was observed in eBPRL and ePhRL over the nocturnal time period between 10 pm and 5 am (), whereas in most allergic animals, eBPRL and ePhRL gradually increased from the baseline, reaching a peak value around 3:30 am (). To quantify nocturnal TAA, we determined the AUC between 10 pm and 5 am and determined the 99% confidence intervals for nonallergic animals (dashed line in ). Plots of eBPRL and ePhRL against time for allergic animals revealed 15 of 21 animals with AUCs greater than the upper boundary of the 99% confidence interval. These 15 animals were therefore classified as nocturnal asthmatic responders (NARs). The allergic group mean AUCs for changes in eBPRL and ePhRL were greater than the nonallergic control group mean AUCs (, ΔeBPRL: P < 0.001, ΔePhRL: P = 0.001). In control experiments, the NAR group did not exhibit nocturnal responses following challenges between 6 am and 10 am with aerosolized saline alone (data not shown).
Figure 3 Long-term stability of nocturnal eBPRL and ePhRL. Plots of eBPRL and ePhRL (30-minute averages) starting at 10 pm and ending at 5 am next morning in 11 nonallergic animals. The changes were expressed as a percentage of the baseline measurement recorded during afternoon. Values are means ± SE at each time point.
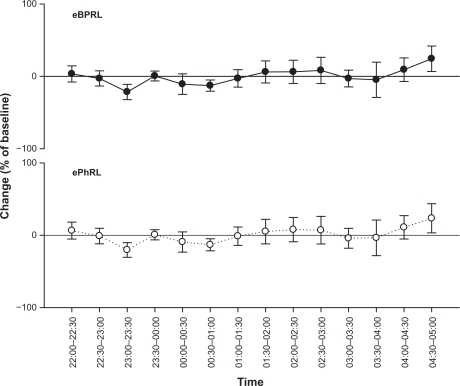
Figure 4 Representative nocturnal eBPRL and ePhRL response of the same animal represented in (ID: 8065). Plot of eBPRL (filled circle) and ePhRL (open circle) (30-minute averages) starting at 1 pm and ending at 6 am next morning. AUC was started at 10 pm and ended at 5 am.
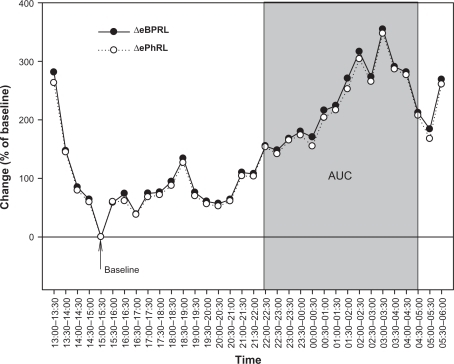
Figure 5 Changes in (A) eBPRL and (B) ePhRL between 10 pm and 5 am for each individual animal in both the allergic group (n = 21) and the nonallergic group (n = 11). A and B the allergic group mean AUC for eBPRL and ePhRL were significantly greater than the nonallergic control group mean AUC. The arrow indicates values for animal ID: 8065 which is also represented in and . Dashed lines represent the upper limit of the 99% confidence interval for the nonallergic group.
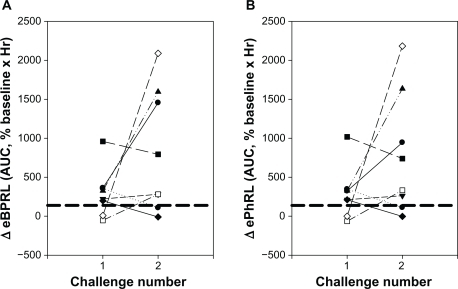
To evaluate the reproducibility of the nocturnal response, eight animals exhibiting acute responses to HDM were rechallenged at a later date (). Six of the animals had been classified as NARs in the previous trial (shown as six symbols above the dashed lines for challenge number 1, ) and two animals had not been classified as NARs. Four of these six NARs from the first trial exhibited nocturnal responses following the second challenge (). Both the animals that had not been classified as NARs in the previous trial exhibited nocturnal responses for the second challenge. Conversely, two animals that exhibited a nocturnal response following the first challenge exhibited minimal increase in eBPRL and ePhRL following the second challenge. Manifestation of a nocturnal response and its magnitude could not be attributed to the provocative concentration of HDM used to elicit the early-phase response or the magnitude of the change in RL and Cdyn during the early-phase response (data not shown).
Figure 6 Reproducibility of the nocturnal response to HDM challenge. Eight animals were challenged with HDM on two different dates. AUC for (A) eBPRL and (B) ePhRL are shown. Symbols represent individual animals. Dash lines represent the upper limit of the 99% confidence intervals for the nonallergic group. The symbols above the dashed lines were classified as nocturnal asthmatic responses.
Discussion
In spontaneously breathing animals, large and small airway constriction manifest as changes in resistance and compliance. These changes may contribute to TAA which results from inability of thoracic volume to change in phase with abdominal volume due to restricted airflow through the lungs. To our knowledge, this is the first report on the use of RIP to measure TAA in a NHP model of allergic asthma and to apply the technique to document nocturnal responses in animals following allergen challenge. TAA as indicated by RIP eBPRL and ePhRL parameters correlated with changes in Cdyn and RL in Cynomolgus macaques during bronchoconstriction induced by methacholine or HDM, and bronchodilation induced by albuterol. Following HDM challenge in the early morning, TAA was shown to increase, with a peak between 3 am and 4 am the next morning. The nocturnal response exhibited intra-animal variability in both incidence and magnitude, which is consistent with manifestation of nocturnal asthma symptoms in humans.
RIP has been used extensively to assess apnea and breathing patterns during sleep in humansCitation20,Citation21,Citation23,Citation24,Citation26 and animals.Citation45 Multiple human studies have demonstrated correlations among TAA, bronchoconstriction, and bronchodilation.Citation15,Citation25,Citation44 In contrast with TAA, other RIP parameters, particularly ventilation, do not appear to be useful in assessing pulmonary function in asthmatic subjects,Citation19,Citation46 possibly due to artifact induced in volume measurements by asynchronous movement of the chest wall and abdomen during bronchoconstriction.Citation47 In this study of allergic NHP, TAA as measured by RIP correlated with changes in RL and Cdyn during HDM- and methacholine-induced bronchoconstriction. In contrast, a previous study in foals did not observe these correlations during histamine-induced bronchoconstriction.Citation12 The reason for this discrepancy is not clear.
In asthmatics there is a high prevalence of nocturnal symptoms,Citation2,Citation3 with peak pulmonary resistanceCitation3 and airway inflammationCitation4,Citation5 observed around 4 am. In this study of allergic NHP, both eBPRL and ePhRL gradually increase during the night following an early morning HDM challenge, which is consistent with the time course of nocturnal symptoms in humans. These nocturnal increases in TAA may be linked to underlying bronchoconstriction, but this cannot be proven without overt intervention at night. TAA is also impacted by changes in respiratory muscle load, control of auxiliary muscles of breathing, and respiratory muscle dysfunction.Citation22 These factors cannot be excluded as underlying causes of nocturnal TAA. Regardless, the data provide compelling evidence that daytime exposure to allergen results in nocturnal disturbances in breathing.
The incidence and severity of nocturnal asthma symptoms in humans is variable, both between and within subjects.Citation7,Citation48 Likewise, nocturnal TAA following HDM challenge in allergic NHP was variable between animals and within individual animals over time. Shigemitsu et alCitation49 reported that 60% of asthmatic subjects manifest nocturnal symptoms. This number compares favorably with the 71% incidence observed in the current study. Fix et al reported that occurrence of nocturnal symptoms is linked to the severity of asthma,Citation50 but other investigators fail to substantiate a definitive link between any particular phenotypic feature of early acute allergic responses and late asthmatic responses in humans and animals,Citation51–Citation53 including the occurrence of nocturnal symptoms.Citation7 In the NHP model, nocturnal TAA could not be attributed to any of the functional parameters measured during the early asthmatic response, including the provocative concentration of HDM or the magnitude of the acute bronchoconstriction.
Conclusion
In summary, RIP parameters indicative of TAA correlated with decrease in pulmonary function during methacholine challenge and the early asthmatic response in HDM-sensitive Cynomolgus macaques. Using RIP as a measure of TAA revealed nocturnal changes in pulmonary function following daytime exposure to aeroallergen. While increased TAA is consistent with bronchoconstriction, the changes may not be due solely to changes in RL and Cdyn. Regardless, the results provide compelling evidence that daytime exposure to aeroallergen in allergic NHP is associated with an increased incidence of nocturnal disturbances in breathing. Taken together, the results indicate that symptoms of nocturnal asthma can be induced in NHP, providing a model for elucidating the mechanisms underlying circadian manifestation of asthma symptoms.
Disclosure
The authors report no conflicts of interest in this work.
References
- National Health Interview Survey (NHIS) Data (2007 Data)2007Centers for Disease Control and Prevention
- BallardRDSaathoffMCPatelDKKellyPLMartinRJEffect of sleep on nocturnal bronchoconstriction and ventilatory patterns in asthmaticsJ Appl Physiol19896712432492759949
- IrvinCGPakJMartinRJAirway-parenchyma uncoupling in nocturnal asthmaAm J Respir Crit Care Med20001611505610619797
- KellyEAHoutmanJJJarjourNNInflammatory changes associated with circadian variation in pulmonary function in subjects with mild asthmaClin Exp Allergy200434222723314987302
- KraftMViannaEMartinRJLeungDYNocturnal asthma is associated with reduced glucocorticoid receptor binding affinity and decreased steroid responsiveness at nightJ Allergy Clin Immunol19991031 Pt 166719893187
- SmolenskyMHLemmerBReinbergAEChronobiology and chronotherapy of allergic rhinitis and bronchial asthmaAdv Drug Deliv Rev2007599–1085288217900748
- Turner-WarwickMEpidemiology of nocturnal asthmaAm J Med1988851B683400687
- CochraneGMClarkJHA survey of asthma mortality in patients between ages 35 and 64 in the Greater London hospitals in 1971Thorax1975303300305167466
- HetzelMRClarkTJBranthwaiteMAAsthma: Analysis of sudden deaths and ventilatory arrests in hospitalBr Med J197716064808811856387
- WeitzmanJBKanarekNFSmialekJEMedical examiner asthma death autopsies: A distinct subgroup of asthma deaths with implications for public health preventive strategiesArch Pathol Lab Med199812286916999701330
- AbrahamWMWatsonHSchneiderAKingMYergerLSacknerMANoninvasive ventilatory monitoring by respiratory inductive plethysmography in conscious sheepJ Appl Physiol1981516165716617319896
- MillerCHoffmanAMHunterJThoracoabdominal asynchrony failed to grade airway obstructions in foalsJ Appl Physiol20008862081208710846021
- PennockBECoxCPRogersRMCainWAWellsJHA noninvasive technique for measurement of changes in specific airway resistanceJ Appl Physiol1979462399406422457
- MillardRKInductive plethysmography components analysis and improved non-invasive postoperative apnoea monitoringPhysiol Meas199920217518610390020
- RusconiFGagliardiLAstonHSilvermanMRespiratory inductive plethysmography in the evaluation of lower airway obstruction during methacholine challenge in infantsPediatr Pulmonol19952063964028649920
- TobinMJJenouriGLindBWatsonHSchneiderASacknerMAValidation of respiratory inductive plethysmography in patients with pulmonary diseaseChest19838346156206831949
- StrombergNOGustafssonPMBreathing pattern variability during bronchial histamine and methacholine challenges in asthmaticsRespir Med19969052872969499813
- WillisBCGrahamASWetzelRLNewthCJRespiratory inductance plethysmography used to diagnose bilateral diaphragmatic paralysis: A case reportPediatr Crit Care Med20045439940215215015
- BlackJBaxter-JonesADGordonJFindlayALHelmsPJAssessment of airway function in young children with asthma: Comparison of spirometry, interrupter technique, and tidal flow by inductance plethysmographyPediatr Pulmonol200437654855315114556
- BrownKAAoudeAAGalianaHLKearneyREAutomated respiratory inductive plethysmography to evaluate breathing in infants at risk for postoperative apneaCan J Anaesth2008551173974719138913
- CantineauJPEscourrouPSarteneRGaultierCGoldmanMAccuracy of respiratory inductive plethysmography during wakefulness and sleep in patients with obstructive sleep apneaChest19921024114511511395758
- HammerJNewthCJAssessment of thoraco-abdominal asynchronyPaediatr Respir Rev2009102758019410206
- KaplanVZhangJNRussiEWBlochKEDetection of inspiratory flow limitation during sleep by computer assisted respiratory inductive plethysmographyEur Respir J200015357057810759455
- KohyamaJShiikiTShimohiraMHasegawaTAsynchronous breathing during sleepArch Dis Child200184217417711159301
- SpringerCGodfreySVilozniDBar-YishayENoviskiNAvitalAComparison of respiratory inductance plethysmography with thoracoabdominal compression in bronchial challenges in infants and young childrenAm J Respir Crit Care Med19961543 Pt 16656698810603
- WhyteKFGuggerMGouldGAMolloyJWraithPKDouglasNJAccuracy of respiratory inductive plethysmograph in measuring tidal volume during sleepJ Appl Physiol1991715186618711761484
- SacknerMAGonzalezHRodriguezMBelsitoASacknerDRGrenvikSAssessment of asynchronous and paradoxic motion between rib cage and abdomen in normal subjects and in patients with chronic obstructive pulmonary diseaseAm Rev Respir Dis198413045885936486558
- HillmanDRPrenticeLFinucaneKEThe pattern of breathing in acute severe asthmaAm Rev Respir Dis198613345875922938528
- RingelERLoringSHMcFaddenERJrIngramRHJrChest wall configurational changes before and during acute obstructive episodes in asthmaAm Rev Respir Dis198312846076106625338
- LitmanRSKottraJAGallagherPRWardDSDiagnosis of anesthetic-induced upper airway obstruction in children using respiratory inductance plethysmographyJ Clin Monit Comput200217527928512546260
- DeGAGroswasserJBersiniHMathysPKahnADetection of obstructive apnea events in sleeping infants from thoracoabdominal movementsJ Sleep Res200211216116812028481
- CoffmanRLHesselEMNonhuman primate models of asthmaJ Exp Med2005201121875187915967818
- van ScottMRHookerJLEhrmannDDust mite-induced asthma in Cynomolgus monkeysJ Appl Physiol20049641433144414672959
- van ScottMRAycockDCozziESallengKStallingsHWIIISeparation of bronchoconstriction from increased ventilatory drive in a nonhuman primate model of chronic allergic asthmaJ Appl Physiol20059962080208616109831
- AyanogluGDesaiBFickRBLongitudinal characterization of cellular and molecular markers in a primate model of chronic house dust mite asthma (Submitted)2010
- ErpenbeckVJSchmidtRGuntherAKrugNHohlfeldJMSurfactant protein levels in bronchoalveolar lavage after segmental allergen challenge in patients with asthmaAllergy200661559860416629790
- JoadJPKottKSBricJMStructural and functional localization of airway effects from episodic exposure of infant monkeys to allergen and/or ozoneToxicol Appl Pharmacol2006214323724316466656
- KottKSPinkertonKEBricJMPlopperCGAvadhanamKPJoadJPMethacholine responsiveness of proximal and distal airways of monkeys and rats using videomicrometryJ Appl Physiol200292398999611842031
- KeenanDBWilhelmFHAdaptive and wavelet filtering methods for improving accuracy of respiratory measurementBiomed Sci Instrum200541374215850079
- KeenanDBWilhelmFHClassification of locomotor activity by acceleration measurement: Validation in Parkinson diseaseBiomed Sci Instrum20054132933415850127
- PriskGKHammerJNewthCJTechniques for measurement of thoracoabdominal asynchronyPediatr Pulmonol200234646247212422344
- SacknerMAWatsonHBelsitoASCalibration of respiratory inductive plethysmograph during natural breathingJ Appl Physiol19896614104202917945
- SarteneRDartusCBernardJLMathieuMGoldmanMDComparison of thoracoabdominal calibration methods in normal human subjectsJ Appl Physiol1993755214221508307871
- AllenJLWolfsonMRMcDowellKShafferTHThoracoabdominal asynchrony in infants with airflow obstructionAm Rev Respir Dis199014123373422137313
- WarrenRHFewellJEAldersonSHCalibration of respiratory inductive plethysmography during quiet and active sleep in lambsJ Dev Physiol19891263473522640229
- StrombergNOGustafssonPMHyperventilation during bronchial challenges in asthmatics: Reproducibility and assessment of contributing factorsRespir Med19969052973069499814
- FujimoriKSatohMArakawaMVentilatory response to continuous incremental changes in respiratory resistance in patients with mild asthmaChest19961096152515318769505
- StormsWWBodmanSFNathanRAByerPNocturnal asthma symptoms may be more prevalent than we thinkJ Asthma19943143133188040155
- ShigemitsuHAfsharKNocturnal asthmaCurr Opin Pulm Med2007131495517133125
- FixASextonMLangenbergPSantanelloNHyndmanSWilliamsRThe association of nocturnal asthma with asthma severityJ Asthma19973443293369250257
- RobertsonDGKeriganATHargreaveFEChalmersRDolovichJLate asthmatic responses induced by ragweed pollen allergenJ Allergy Clin Immunol19745442442544414060
- O’ByrnePMDolovichJHargreaveFELate asthmatic responsesAm Rev Respir Dis198713637407513115156
- NabeTZindlCLJungYWInduction of a late asthmatic response associated with airway inflammation in miceEur J Pharmacol20055211–314415516182277