
Abstract
Aim: This study aims to examine trends in incidence and mortality of colorectal cancer (CRC) using a state-wide registry, focusing on race, age, and rurality. Methods: From 1990 to 2019, CRC age-adjusted incidence and mortality were examined through the Pennsylvania Cancer Registry using Joinpoint Regression to model average annual percent changes (AAPC). Results: In Pennsylvania, there was a decline in incidence (AAPC -1.7) and mortality (AAPC -2.5), consistent regardless of race or cancer stage, with an inflection in the 2000s demonstrating greater rate of decrease. Conversely, patients under 50 saw rising CRC incidence (AAPC 1.8). Rural counties showed higher mortality than urban counties. Conclusion: Across Pennsylvania, the incidence and mortality rates of CRC have decreased over the past three decades, apart from patients under 50.
Colorectal cancer (CRC) is the third most common malignancy in the world and the second most deadly cancer, accounting for an estimated 1.9 million new cancer diagnoses and nearly a million global deaths in 2020 [Citation1]. In the US, CRC accounted for 7.9% (N = 149,500) of all new cancer diagnoses and represented 8.7% (N = 52,980) of all cancer deaths in 2021 [Citation2]. With the benefit of increased awareness of risk factors and increased screening uptake, CRC incidence in the US has been declining for several decades [Citation3]. However, there has also been an unexplained increase in incidence in young adults [Citation3].
Risk factors for CRC include inflammatory bowel disease, obesity, low physical activity, tobacco use, high consumption of red meat, and low consumption of fruits and vegetables [Citation4]. In addition, CRC in first-degree relatives is a risk factor, indicating a genetic predisposition to CRC pathogenesis [Citation4]. While the majority of CRC cases (70–80%) are sporadic, 20–30% of CRC are hereditary, with a minority of these associated with increased susceptibility syndromes such as Lynch Syndrome and familial adenomatous polyposis [Citation5].
In this report, we reviewed 30 years of CRC data within Pennsylvania to analyze trends and incidence of CRC within the state. The aim of this study was to examine incidence and mortality from colon cancer using a state-wide cancer registry, focusing on disparities in age, race, sex and urban/rural residency. By identifying these disparities, we hope to use this data to further target improved community and therapeutic interventions focused on in equities of socioeconomic factors such as race and rurality.
Materials & methods
The Pennsylvania Cancer Registry (PCR) captures all cancer cases diagnosed or treated within the state. Using this database, the age-adjusted incidence, stage at diagnosis, and mortality from CRC from 1990 to 2019 were collected through the Enterprise Data Dissemination Information Exchange. This study was IRB exempt as the data was obtained through a publicly available database, and all patient information has been deidentified. No informed consent was required.
Joinpoint Trend Analysis software (Version 4.9.1.0 – April 2022) was used to model annual percent changes (APC) and average annual percent change (AAPC) based on age-adjusted rates. Using a linear approach that fit trend lines for incidence and mortality rates over multiple years while standardizing these rates with a standard population, the software was used to examine trends related to race, sex, and cancer stage. Briefly, Joinpoint fits a piecewise linear regression model to longitudinal data, such as cancer mortality rates, over a given time interval. Starting with the simplest possible model – a single line with 0 Joinpoints, a constant slope, and a constant APC – the software employs a Monte Carlo hypothesis testing procedure to determine if additional Joinpoints should be added to the model. If so, changes in the underlying trends are statistically significant and lines with distinct slopes and APCs are identified. Otherwise, the trends are considered constant over the time interval, as is the slope and the APC [Citation6,Citation7].
The stage distribution of CRC was based on the Surveillance, Epidemiology, and End Results (SEER) Summary Staging system definitions used by the PCR. In this system, the cancer was classified as in situ (cancer has not spread beyond the basement membrane of the epithelial tissue involved), local (cancer is confined to the organ of origin), regional (cancer extends beyond the original organ to nearby lymph nodes, organs, or tissues), and distant (cancer extends to distant organs or lymph nodes). In this dataset, CRC was not classified by the TNM staging system.
To determine whether a Pennsylvania county was rural or urban, the Center for Rural Pennsylvania′s 2010 population-density based definition, defined as 284 people per square mile, was applied to 2019 county census data. Altogether, out of 67 counties in Pennsylvania, 48 were determined to be rural while 19 were determined to be urban.
Results
In Pennsylvania, there were 236,365 cases of CRC from 1990 to 2019. is a descriptive analysis of the population′s age, sex, race, and stage. Most cases were older than 50 years old and of white race, with an even distribution between male and female. The majority percentage of cases presented as regional disease, followed in order by local, distant, and in situ disease.
Table 1. Demographic data for colon cancer from Pennsylvania Cancer Registry 1990–2019.
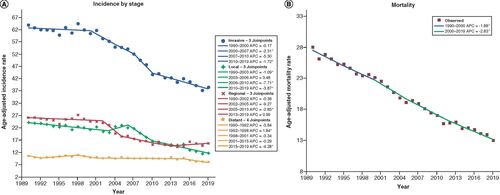
highlights age-adjusted incidence rates of CRC stratified by stage of disease at diagnosis. Over the study interval, the overall age-adjusted incidence rates decreased by almost 40%, from 63.9 to 38.5 cases per 100,000 (39.7% decrease, AAPC -1.7, 95% CI (-2.4, -1.0), p < 0.001) (AAPC′s may be found on Supplementary Table). This decrease was mainly driven by decreases in local disease incidence, which decreased from 24.0 to 11.7 cases per 100,000 (51.3% decrease, AAPC -2.4, 95% CI (-3.6, -1.3), p < 0.001), and regional disease incidence, which decreased from 26.1 to 15.6 cases per 100,000 (40.2% decrease, AAPC -1.7, 95% CI (-3.0, -0.5), p = 0.006). In contrast, age-adjusted incidence of distant disease remained stable over the study interval (AAPC -1.0, 95% CI (-2.0, 0.0), p = 0.050). Similarly, the age adjusted mortality rate, as shown in , decreased over the study interval from 28.0 to 13.0 cases per 100,000 (53.6% decrease, AAPC -2.5, 95% CI (-2.7, -2.3), p < 0.001).
(A) Incidence by stage: age-adjusted incidence rate per 100,000 in Pennsylvania between 1990 and 2019 stratified by stage of cancer at presentation. (B) Mortality: age-adjusted mortality rate per 100,000 from 1990 to 2019.
*Statistical significance at p < 0.05.
APC: Annual percentage change.
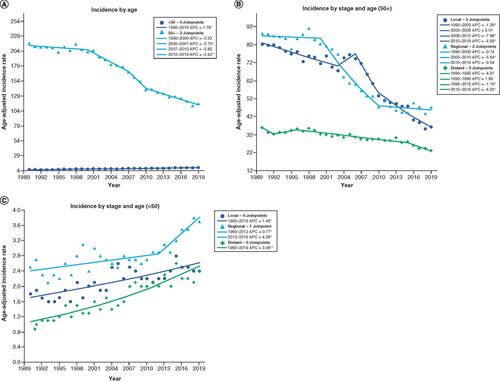
For patients over 50 years old, the incidence of CRC decreased from 216.9 to 116.1 cases per 100,000 (46.5% decrease, AAPC -2.1, 95% CI (-2.8, -1.5), p < 0.001) as seen in . In , for patients greater than 50 years, this decline is driven by decreases in all stages of disease: local (AAPC -2.8, 95% CI (-4.0, -1.7), p < 0.001), regional (AAPC -2.2, 95% CI (-2.8, -1.6), p < 0.001), and distant (AAPC -1.5, 95% CI (-2.4, -0.6), p = 0.001). Conversely, younger patients below the age of 50 years experienced an increase in CRC incidence rates, from 5.5 to 8.8 (60% increase, AAPC 1.8, 95% CI (1.5, 2.0), p < 0.001) (). For these patients, the rise is driven by increases in all stages of disease: local (AAPC 1.5, 95% CI (1.0, 1.9), p < 0.001), regional (AAPC 1.6, 95% CI (0.8, 2.4), p < 0.001), and distant (AAPC 3.1, 95% CI (2.6, 3.5), p < 0.001) ().
(A) Incidence by age: plotted age-adjusted incidence per 100,000 from 1990–2019 with Joinpoint analysis for patients younger and older than 50 years old. (B) Incidence by stage and age (50+): age-adjusted incidence per 100,000 between 1990–2019 for patients older than 50 years old stratified by stage of disease. (C) Incidence by stage and age (<50): age-adjusted incidence per 100,000 between 1990–2019 for patients younger than 50 years old stratified by stage of disease.
*Statistical significance at p < 0.05.
APC: Annual percentage change.
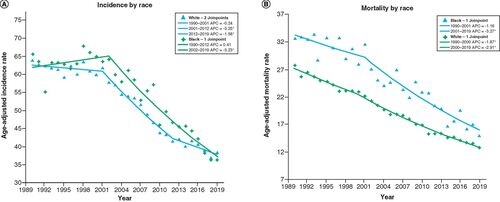
In terms of race, the age-adjusted incidence and mortality were generally greater for black patients compared with white patients, as shown in & B. CRC incidence for white patients decreased from 63.9 to 38.4 cases per 100,000 (39.9% decrease, AAPC -1.7, 95% CI (-2.1, -1.4), p < 0.001), while CRC incidence for black patients decreased from 65.5 to 36.3 (44.6% decrease, AAPC -1.7, 95% CI (-2.2, -1.3), p < 0.001). Likewise, the age-adjusted mortality rate for white patients decreased from 27.8 to 13.6 cases per 100,000 (51.1% decrease, AAPC -2.6, 95% CI (-2.7, -2.4), p < 0.001), while mortality rate for black patients decreased from 32.7 to 15 (54.1% decrease, AAPC -2.5, 95% CI (-3.0, -1.9), p < 0.001).
(A) Incidence by race: age-adjusted incidence rate per 10,000 in Pennsylvania between 1990 and 2019 stratified by race. (B) Mortality by race: age-adjusted mortality rate per 100,000 in Pennsylvania from 1990 to 2019 stratified by race.
*Statistical significance at p < 0.05.
APC: Annual percentage change.
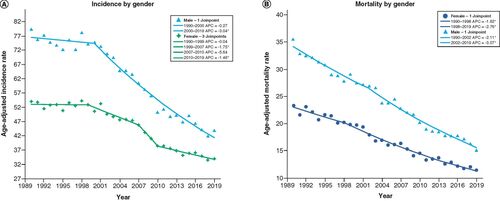
The rates of CRC were also different when stratified by sex, with males having an overall greater rate of incidence and mortality, as seen in & B. Specifically, incidence rates for females decreased from 53 to 34 cases per 100,000 (35.8% decrease, AAPC -1.5, 95% CI (-2.3, -0.8), p < 0.001), while for males, they decreased from 79.3 to 43.8 (44.8% decrease, AAPC -2.1, 95% CI (-2.4, -1.8), p < 0.001). CRC mortality rates for female decreased from 23.3 to 11.4 (51.1% decrease, AAPC -2.4, 95% CI (-2.7, -2.2), p < 0.001), while rates for men decreased from 35.5 to 15.1 ((57.5% decrease, AAPC -2.7, 95% CI (-2.9, -2.4), p < 0.001).
(A) Incidence by gender: age-adjusted incidence rate per 10,000 in Pennsylvania between 1990 and 2019 stratified by gender. (B) Mortality by gender: age-adjusted mortality rate per 100,000 in Pennsylvania from 1990 to 2019 stratified by gender.
*Statistical significance at p < 0.05.
APC: Annual percentage change.
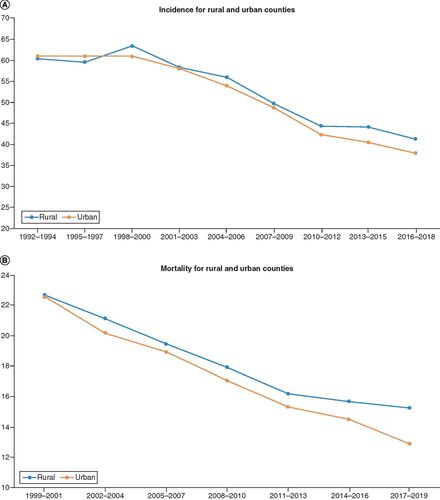
Rural counties had slightly higher age-adjusted mortality compared with urban counties, with urban counties (AAPC -8.6, 95% CI (-9.4, -8.1), p < 0.001) having a significantly different the rate of change compared with rural counties (AAPC -6.6, 95% CI (-7.0, -6.1), p < 0.001), as shown in . The difference in incidence rates between rural (AAPC -4.7, 95% CI (-7.1, -2.3, p < 0.001)) and urban counties (AAPC -6.2, 95% CI (-4.7, -7.7, p < 0.001)) was not statistically significant.
(A) Incidence for rural and urban counties: age-adjusted incidence rate per 10,000 in Pennsylvania stratified by urban and rural counties. (B) Mortality for rural and urban counties: age-adjusted mortality rate per 100,000 in Pennsylvania stratified by urban and rural counties.
Discussion
The aim of this study was to analyze data from a large statewide cancer registry in order to evaluate trends in incidence and mortality for patients with CRC. From this registry, we found that most new CRC cases were diagnosed in patients over 50 years old (92.9%), who presented with local (36.7%) and regional (38.5%) disease.
With the notable exception of patients under 50 years old, we found that in the state of Pennsylvania, there was a decline in incidence of CRC and mortality due to CRC for all populations regardless of race or sex. This decrease is consistent with national trends of decreased CRC incidence and mortality [Citation8]. Changes in risk factors (i.e., smoking) and increased screening have been associated with the decreasing incidence of CRC [Citation9,Citation10]. Interestingly, countries with higher Human Development Index (HDI) generally demonstrate recent decreases in CRC incidence and mortality, attributed to greater utilization of population-based CRC screening programs, whereas developing countries with low HDI have seen a rising incidence, attributed to Westernized lifestyle-related factors including dietary changes with increased fat, sugar, and animal-source food consumption [Citation11–13].
Interestingly, both the incidence and mortality rates demonstrated an inflection point in the early- to mid-2000s, after which there was a steeper decline in rates regardless of race or sex. From 1990 until 2000, incidence rates for CRC were roughly constant until after the year 2000, where rates began to decrease significantly. A similar trend was seen in mortality rates, where although deaths from CRC were decreasing from 1990 to 2000, there was a greater decline in CRC mortality observed after 2000. This rapid decrease after the 2000s can also be seen on a national level and has previously been attributed to an expansion of Medicare colonoscopy screening coverage from high-risk individuals to all beneficiaries in 2001 [Citation9]. As demonstrated in a study done by Kaiser, implementation of large community-based screening was associated with substantial decrease in CRC incidence and mortality [Citation10].
For patients under age 50 years, however, our study showed a 60% increase in CRC incidence from 1990 until 2019. In this present study, distant disease or late-stage CRC had the largest growth in patients age <50 years old. It is important to note that although there is a profound increase in incidence, these incidence rates are still very low, especially in comparison with patients over 50 years old as shown in . These findings are consistent with the recent literature; worldwide, CRC incidence has been increasing in younger individuals (age <50) in both high- and low-income countries [Citation11,Citation14]. In a 2015 paper published in JAMA Surgery using the SEER CRC registry, there were notable declines in incidence of regional and distant disease in patents older than 50 years old, while patients younger than 34 had increases across all stages, with distant disease demonstrating the highest APC [Citation15]. Our data showed similar trends, such as that increases in incidence for patients younger than 50 years old were driven mainly by increases in distant disease, followed by regional and local disease. However, contrary to this study, our study demonstrated that decreases in incidence for patients over 50 years old were mainly driven by decreased local disease, instead of mainly regional and distant disease. Causes of this early onset CRC remain unclear, although recent studies have suggested that prolonged sedentary behavior, diabetes, and the Western diet are associated [Citation16]. This concerning increase in incidence of colorectal cancer in younger patients, especially in distant disease, has not yet been reflected in an increase in our cancer mortality data; however, this may be due to a factor of both time and the small proportion this group makes up of the total colorectal cancer patient population. The increasing number of patients being diagnosed with CRC at a younger age led to changes in both American Cancer Society (ACS) and United States Preventive Services Taskforce (USPSTF) guidelines recommending CRC screening be performed at the age of 45 for average risk patients, instead of 50 [Citation16].
Race was associated with differences in incidence and mortality. In general, black patients had higher incidence of CRC than white patients, although both races had similar decreasing rates over the three decades. Black patients also had higher mortality rates from CRC compared with white patients, as well as a lower rate of change over the study period consistent with the national trend, although in our study this was not statistically significant [Citation8]. This difference may be attributed to differences in social-economic status (SES), as previous data has shown that variations in SES can lead to differences in mortality of up to 30% between groups [Citation17].
Male patients had greater incidence and mortality rates from CRC compared with female, although males also exhibited a greater decrease in incidence and mortality. This sex-dependent trend is seen in both national and global data, where incidence and mortality are generally lower in females with the exception of Latin American countries (Brazil, Costa Rica, and Columbia), where the rates between sexes were similar [Citation18].
Finally, rurality played very little role in the incidence of CRC, perhaps indicating improved access to screening modalities. This is supported by a SES and urban/rural study done in California showing that there was no significant difference in stage at diagnosis of CRC within SES categories based on rural/urban status [Citation19]. Conversely, rural counties in Pennsylvania showed statistically significant higher mortality rates compared with urban counterparts. Further investigation is warranted to determine the granular differences that may exist in the cancer management of patients between rural and urban Pennsylvania counties.
This study has several limitations. Similar to other studies utilizing large state-centralized registries, selection bias may have been present during the data collection project, limiting generalizability. In addition, there is the possibility of data inaccuracy or incompleteness, improper classification of samples, or unmeasured changes in stage reporting. Likewise, because there was no standardized central pathologic review, there may be inconsistencies in the diagnostic assessment of malignancies in both diagnosis and staging. Furthermore, the PCR does not provide information on certain races before a certain year, limiting our ability to further differentiate racial disparities. Also, like others utilizing cancer registries, these studies are unable to account for the multitude of variables that may influence a person′s risk for cancer such as socioeconomic status, lifestyle behaviors, and access to healthcare. As such, this implies a correlational rather than causal relationship that may limit the interpretation of these findings, although we attempted to show a surrogate measure of the influence of access to healthcare by showing county-level data in (), given that Pennsylvania has multiple regions of counties that are more urban-centered versus rural-centered. Finally, the Joinpoint regression analysis software, though commonly used for cancer epidemiology, also has limitations, most notably the assumption of linearity that assumes rates change at a constant fixed amount per year that may lead to biased estimates and not fully capture the complexity of some trends [Citation6,Citation7].
Conclusion
In conclusion, this study was the first to utilize the PCR, the state′s large cancer database, to identify trends in incidence and mortality for CRC over three decades, supporting the national trend of decreasing incidence and mortality rates. Furthermore, this study showed an inflection point in the early 2000s with decreased incidence and mortality, correlated with Medicare expansion in 2001. Finally, this study supports the recent change in ACS/USPSTF guidelines recommending CRC screening begin at age 45, by showing rising incidence rates for patients under 50 years old.
Colon cancer incidence and mortality has generally decreased in Pennsylvania over the past three decades. In the early 2000s, there was an inflection point where rates declined correlated with Medicare screening expansion.
From 1990 to 2019, rates of local and regional colorectal cancer incidence decreased while distant disease remained stable.
The majority of colorectal cancer patients presented with local and regional disease.
Late-stage colon cancer incidence had the largest growth in younger patients under the age of 50 years old, supporting recent guideline changes endorsing earlier colonoscopy screening.
Male patients had greater incidence and mortality rates from CRC compared with female patients, although males also exhibited a greater decrease in incidence and mortality rates.
Black patients had higher rates of incidence compared with white patients with similar rates of decrease. Black patients also had higher rates of mortality with a lower rate of change compared with white patients.
There is no difference between rural and urban county colon cancer incidence.
This was the first study to use Pennsylvania Cancer Registry to identify trends in colorectal cancer over three decades.
Author contributions
JT Pham: responsible for conception and design of study, acquisition of data, drafting the manuscript and revising the manuscript critically for important intellectual content. WG Wong: responsible for conception and design of study, drafting the manuscript and revising the manuscript critically for important intellectual content. V Walter: responsible for analysis and/or interpretation of data and revising the manuscript critically for important intellectual content. J Scow: responsible for analysis and/or interpretation of data and revising the manuscript critically for important intellectual content. M Deutsch: responsible for analysis and/or interpretation of data and revising the manuscript critically for important intellectual content. AS Kulaylat: responsible for conception and design of study, drafting the manuscript and revising the manuscript critically for important intellectual content.
Ethical conduct of research
This project utilized publicly available, deidentified patient data provided by the Pennsylvania Cancer Registry and Pennsylvania Department of Health and was approved by the Penn State Research Institutional Review Board.
Supplementary data
Download MS Word (14.7 KB)Acknowledgments
Thanks to W Wong, V Walter and A Kulaylat for their contribution to the project conception, study design, and data interpretation. Additional thanks to J Scow and M Deutsch for their input during the writing and editing process. Special acknowledgement to L McCully for her assistance with the figures. These data were provided by the Division of Health Informatics, Pennsylvania Department of Health. The Department specifically disclaims responsibility for any analyses, interpretations or conclusions.
Financial & competing interests disclosure
The authors have no relevant affiliations or financial involvement with any organization or entity with a financial interest in or financial conflict with the subject matter or materials discussed in the manuscript. This includes employment, consultancies, honoraria, stock ownership or options, expert testimony, grants or patents received or pending, or royalties.
No writing assistance was utilized in the production of this manuscript.
References
- FerlayJ, SoerjomataramI, DikshitRet al.Cancer incidence and mortality worldwide: sources, methods and major patterns in GLOBOCAN. Int. J. Cancer136(5), E359–E386 (2015).
- Colorectal Cancer-Cancer State Facts, National Cancer Institute Surveillance, Epidemiology, and End Results Program. https://seer.cancer.gov/statfacts/html/colorect.html (Updated 2022).
- JullumstrøE, WibeA, LydersenS, EdnaTH. Colon cancer incidence, presentation, treatment and outcomes over 25 years. Colorectal. Dis.13(5), 512–518 (2011).
- JohnsonCM, WeiC, EnsorJEet al.Meta-analyses of colorectal cancer risk factors. Cancer Causes Control24(6), 1207–1222 (2013).
- MüllerMF, IbrahimAE, ArendsMJ. Molecular pathological classification of colorectal cancer. Virchows Arch.469(2), 125–134 (2016).
- KimHJ, FayMP, FeuerEJ, MidthuneDN. Permutation tests for Joinpoint regression with applications to cancer rates. Stat. Med.19, 335–351 (2000).
- Joinpoint Regression Program, Version 4.9.1.0 – April 2022; Statistical Methodology and Applications Branch, Surveillance Research Program, National Cancer Institute.
- SinghGK, JemalA. Socioeconomic and racial/ethnic disparities in cancer mortality, incidence, and survival in the United States, 1950–2014: over six decades of changing patterns and widening inequalities. J. Environ. Public Health2017, 2819372 (2017).
- SiegelRL, MillerKD, GodingSauer Aet al.Colorectal cancer statistics, 2020. CA Cancer J. Clin.70(3), 145–164 (2020).
- LevinTR, CorleyDA, JensenCDet al.Effects of organized colorectal cancer screening on cancer incidence and mortality in a large community-based population. Gastroenterology155(5), 1383–1391; e5 (2018).
- WongMCS, HuangJ, LokVet al.Differences in incidence and mortality trends of colorectal cancer worldwide based on sex, age, and anatomic location. Clin. Gastroenterol. Hepatol.19(5), 955–966; e61 (2021).
- MarquesA, Gasparde Matos M. Adolescents′ physical activity trends over the years: a three-cohort study based on the Health Behaviour in School-aged Children (HBSC) Portuguese survey. BMJ Open4(9), e006012 (2014).
- NavarroM, NicolasA, FerrandezA, LanasA. Colorectal cancer population screening programs worldwide in 2016: an update. World J. Gastroenterol.23(20), 3632–3642 (2017).
- SiegelRL, MillerKD, JemalA. Cancer statistics, 2020. CA Cancer J. Clin.70(1), 7–30 (2020).
- BaileyCE, HuCY, YouYNet al.Increasing disparities in the age-related incidences of colon and rectal cancers in the United States, 1975–2010. JAMA Surg.150(1), 17–22 (2015). Erratum in: JAMA Surg. 150(3), 277 (2015).
- Burnett-HartmanAN, LeeJK, DembJ, GuptaS. An update on the epidemiology, molecular characterization, diagnosis, and screening strategies for early-onset colorectal cancer. Gastroenterology160(4), 1041–1049 (2021).
- SinghGK, WilliamsSD, SiahpushM, MulhollenA. Socioeconomic, rural-urban, and racial inequalities in US cancer mortality: part I-all cancers and lung cancer and part II-colorectal, prostate, breast, and cervical cancers. J. Cancer Epidemiol.2011, 107497 (2011).
- ArnoldM, SierraMS, LaversanneM, SoerjomataramI, JemalA, BrayF. Global patterns and trends in colorectal cancer incidence and mortality. Gut66(4), 683–691 (2017).
- Parikh-PatelA, BatesJH, CamplemanS. Colorectal cancer stage at diagnosis by socioeconomic and urban/rural status in California, 1988–2000. Cancer107(Suppl. 5), 1189–1195 (2006).