Abstract
Background and objectives. In fresh blood, tissue hypoxia increases microcirculatory acidosis, which enhances erythrocyte O2 unloading and increases the amount of available O2. Storage of erythrocytes increases the HbO2 affinity and reduces O2 unloading. We examined the development of the affinity change during a period of 5 weeks of storage by present blood bank standards, and investigated to what extent acidosis offsets the affinity change. Materials and methods. Blood from volunteer donors was processed and stored as erythrocyte concentrates (EC). At 2–5 day intervals, EC were drawn from the bags and suspended in plasma and crystalloids to an Hb ≈ 10 g/dL. The suspensions were adjusted to give a pH of 7.40, 7.10, 6.80 or 6.30 and equilibrated with different gas mixtures to SO2 0, 25, 50, 75 and 100%. Measurements of the PO2/SO2 pairs at each pH were used to calculate the position of the HbO2 curve and its P50 value. Results. A significant leftward shift in the HbO2 curve was established after 1 week of storage; after 2.5 weeks only minor further changes were observed. Acidification right-shifted the HbO2 curve, after 2.5 weeks of storage the curve at pH 7.10 was similar to that for fresh blood at pH 7.40. Calculations of extractable O2 showed that the left-shifted HbO2 curve of stored EC could be advantageous at a low arterial PO2. Conclusions. The rightward shift of the HbO2 curve due to acidosis is well maintained in stored erythrocytes, a moderate pH decrease offsets the storage-induced increased HbO2 affinity.
Introduction
The O2 content of arterial blood (CaO2) is mainly determined by the amount of haemoglobin (Hb) and its O2 saturation (SaO2); the number of O2 molecules dissolved as gas and measured as the O2 partial pressure (PaO2) represents under normal circumstances only 1–2% of the total. The importance of PaO2 for O2 delivery to the tissues lies therefore not in the PaO2 per se, but in its effect on the SaO2. The relationship between PO2 and SO2 is described by the sigmoid-shaped HbO2 dissociation curve; at a constant PO2 a leftward shift in the curve position increases the SO2 and thus the CaO2 while a rightward shift decreases the SO2. Due to the shape of the HbO2 curve, the effects of such shifts are usually miniscule at normal or high PO2 levels but may be crucial at low PO2 levels.
During blood bank storage of erythrocytes, depletion of their 2,3 diphosphoglycerate (2,3-DPG) content [Citation1] shifts the HbO2 curve to the left. This increases the CaO2, but will also decrease the unloading of O2 in the tissue microcirculation. Some authors have considered this a major argument against a beneficial effect of transfusion of stored erythrocytes [Citation2,Citation3], and others have suggested that only fresh erythrocytes should be transfused to intensive care patients [Citation4]. However, others have pointed out that experimental and clinical studies have yielded controversial results on the eventually negative effect of transfusing stored erythrocytes, and that many more factors than the actual position of the HbO2 dissociation curve influence the clinical effect of a red cell transfusion [Citation5].
In fresh blood, tissue acidosis will increase O2 unloading; hypoxic acidosis will thus automatically increase tissue O2 delivery. To what extent acidosis can compensate for the storage-induced leftward shift in erythrocyte concentrates (EC) preserved in SAGMAN solution has not previously been determined. In the massively transfused patient, the circulating blood consists of a mixture of transfused EC and plasma from the blood bank plus infused electrolyte solutions. The O2 transport capability and tissue unloading of such blood during the acute phase is therefore equivalent to that of stored EC.
Calculations of curve shifts based on standard pH-dependent correction factors do not correct for changes in 2,3-DPG; even in fresh blood such calculations become increasingly inaccurate with mounting acidosis [Citation6]. We therefore measured the storage-induced effect on the HbO2 curve shifts in EC at 2–5 day intervals of storage for up to 35 days; on each experimental day, the samples were examined at four different pH values. To simulate in vivo conditions during major bleeding, the stored erythrocytes were resuspended in equal amounts of plasma and crystalloids to an Hb of 9–11 g/dL. The consequences of the storage dependent HbO2 curve shifts for the amount of consumable O2 [Citation7] during threatening tissue hypoxia were also calculated.
Materials and methods
Sources of blood
Eighteen healthy persons from the donor pool of Oslo University Hospital Blood Bank (OBB) received oral and written information about the investigation and gave written consent to allow their donation on a particular day to be used for research purposes. During preliminary methodological studies, blood from one of the authors (HEH) and samples from outdated blood to be discarded were also used. The investigation was approved by the Regional Committee for Medical research ethics, the Biobank committee and the Committee for Individual rights in research.
The blood to be used in the investigation was collected, processed and stored at 4°C by procedures identical to those routinely employed for preparation of erythrocyte concentrates (EC) at the blood bank. Briefly, 450 mL whole blood was mixed with 63 mL of citrate-phosphate-dextrose-adenine (CPD-A) in a plastic bag (Fenwal Corp., Illinois, USA) and left at room temperature for 1 h. It was then centrifuged at 4°C and 4000 g for 20 min, followed by removal of plasma and buffy coat into separate bags by pressure. The remaining erythrocyte concentrate was passed through a leukocyte filter (Asahi Kasei Medical Co, Japan) at room temperature, resuspended in SAGMAN solution (Fenwal) and immediately stored at 4°C. The procedure until storage typically took 4–5 h and never exceeded 8h. EC produced at the OBB show a mean volume = 245 mL, a mean haematocrit = 0.55 and a mean haemoglobin content = 49 g/bag (unpublished quality control data).
The HbO2 affinity of EC stored at 4°C was examined after different time intervals. On day 0, samples of EC processed for storage the same day were examined before cooling and storage. During the next 3 weeks of storage, samples of EC from the same six donors were examined at time intervals as shown in . The necessary volume of EC from each donor bag was transferred aseptically into a smaller bag (‘Baby bag’, Fenwal) on each experimental day, after which both bags were shut by welding. Due to the limited volume of the EC bags, the contents of each bag could be followed only for up to 3 weeks. Therefore, blood from additional donors was necessary to obtain data corresponding to a storage time of 3-5 weeks.
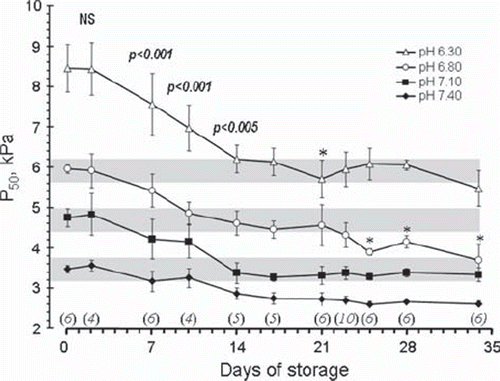
Figure 1. Changes in P50 values as a function of storage time measured at the four different pH values shown in the figure. All data from 0–17 days of storage represent blood from the same EC bags. The number of EC bags examined after each storage period is shown in italics above the x-axis. Data for all storage periods longer than 2 days were significantly different from day 0. The p values shown as numbers in the figure refer to a difference from the preceding P50 level by a paired T-test including all pH levels. The asterisks denote a significant (*p < 0.05) difference from the preceding value when each individual pH level was analysed separately.
In 6 donors, an additional 15 mL of blood was drawn separately into heparinized tubes for estimation of both the normal HbO2 curve and that representing grave acidosis at approximately pH 6.30 in non-processed blood. The position of the HbO2 curve at pH 6.30 calculated from these data was in agreement with that previously determined in a detailed investigation in our hospital [Citation6] and served to verify the method for HbO2 curve determination used in the present investigation. The choice of anticoagulant or the processing of blood to EC had no significant effect on the HbO2 curve within the normal range of pH values. All laboratory work, including tonometry and blood gas analysis, was carried out in the facilities of the blood bank.
Preparation of blood samples
Five mL of EC was mixed with 3 mL of thawed Octaplas® (pooled, standardized, solvent/detergent virus inactivated whole plasma) of blood group AB, the pH, base excess (BE) and other blood gas parameters of this mixture were then measured in an ABL 700 blood gas apparatus (Radiometer Medical, Brønshøj, Denmark) equipped with a co-oximeter. Subsequently, 3 mL of an electrolyte mixture was added, giving an Hb of 9–11 g/dL in the final solution. The mixture consisted of sterile H2O (Fresenius Kabi, Halden, Norway) and lactic acid (Sigma Aldrich, St Louis, MO, USA) or NaHCO3 0.5 mol/L (Braun Melsungen, Melsungen, Germany). The amount of lactic acid or NaHCO3 was calculated from the initial pH and BE values to give pH levels of approximately 7.40, 7.10, 6.80 or 6.30 in the final EC-PE mixture. In addition, concentrated NaCl (4 mol/L, Addex NaCl, Fresenius Kabi, Halden, Norway) was added in amounts calculated to give a final volume of 3 mL and a Na+of 140 mmol/L in the electrolyte mixture. The accuracy of the calculations was verified by the electrolyte analysis in the final EC-plasma-electrolyte (EC-PE) mixture given by the blood gas apparatus. In experiments involving heparinized blood no plasma was added; the effect of acidification to pH 6.30 was examined after adjusting the pH by addition of 3 mL of electrolyte mixture by a procedure identical to that described above.
Both processing and storage acidify the EC. Preliminary experiments showed that additions of acid or NaHCO3 aimed to give pH values of 7.40 and 7.10 could be calculated from the Siggaard-Andersen acid-base nomogram [Citation8] with reasonable accuracy. The nomogram proved inaccurate, however, when the goal was pH 6.80, and a pH of 6.30 was out of its range. Separate preliminary experiments were therefore necessary to establish empirical addition factors. Obtaining the exact designated pH value in the lower pH range proved difficult and time consuming; the median pH value deviation from the designated value for each group was, however, always less than 0.1 pH units. For simplicity, the designated pH values are shown in figures and text.
Tonometry and measurements
The EC-PE mixture was divided into two 5 mL plastic syringes (3.5 mL each) and placed in a tonometer (RNA medical equilibrator model 300, RNA Medical, Massachusetts, USA) preheated to 37° C. The syringes, which were pretreated with a foam-inhibiting coating by the tonometer manufacturer, were equilibrated with a gas containing 5% CO2 and 20% O2 in nitrogen or 5% CO2 in nitrogen, respectively, for 20 min. The EC-PE mixture from the two syringes had an SO2 of 90–100% (depending on the pH) or close to 0%, respectively, with a pCO2 of approximately 5 kPa. The contents of the two syringes were then transferred anaerobically into 2 mL syringes containing a glass bead for mixing purposes, in amounts calculated to give the final solutions an SO2 of approximately 25%, 50% and 75%, respectively. The final mixtures, as well as the remaining ≈0% and ≈100% blood, were then analysed in the blood gas apparatus. The five sets of corresponding SO2–PO2 values at each pH were then used for determination of the position of the HbO2 curve. The PO2 corresponding to half saturation of the Hb with O2, the P50 value, were calculated from our data (see below) and used to express changes in the HbO2 curve position.
Estimation of storage and pH effects on the HbO2 curve and P50 values
Often used equations (Siggaard-Andersen, Severinghaus) for calculating changes in the HbO2 curve induced by variations in pH overestimate the rightward shift of the HbO2 curve in grave acidosis [Citation6]. A dedicated data program using LabView software was developed locally by one of the authors, a research data engineer (TAS). The program fitted a sigmoid shaped curve to the position of the five PO2–SO2 measurement pairs at each pH; this curve was then compared to a population of HbO2 curves calculated by the equations proposed by Severinghaus [Citation9] and by Kellman [Citation10] for determination of the effect of pH changes on the HbO2 curve position. The curve representing the best fit to the measured data was chosen as the ‘true’ HbO2 curve. Curves calculated according to the Kellman method gave the best visual fit to the observed PO2–SO2 data, the pH of which the curves were calculated also deviated least from the actual pH of the samples. This routine was therefore utilized for determination of the position of the curve as defined by its P50 value. The median P50 value for heparinized blood at a pH of 6.30 calculated by this method (8.9 kPa) was very close to that previously determined in our institution (9.1 kPa) by multiple direct measurements in heparinized blood at the same pH [Citation6], thus verifying our method for determining the position of the HbO2 curve even in grave acidosis.
Calculation of consumable oxygen
At an end venous PO2 below 2.7 kPa (=20 mmHg, see Conversions section below), cells may become dysfunctional and lactic acid production can be induced [Citation6,Citation11]. As more than 98% of the O2 in normal arterial blood is bound to Hb, the amount of consumable O2 calculated for a particular HbO2 dissociation curve can, for simplicity, be expressed as the difference between the SO2 corresponding to that of a given arterial PO2 level and that at a PO2 of 2.7 kPa. For the purpose of such calculations, PaO2 levels corresponding to grave hypoxemia (5.3 kPa, 40 mm Hg), normoxia (13.3 kPa, 100 mm Hg) and supernormal O2 levels (20 kPa, 150 mmHg) were used. These calculations assume a similar pH in arterial and capillary blood. Under extreme conditions, however, major differences between arterial and microcirculatory pH levels may exist (see discussion). Therefore, calculations of consumable O2, assuming a HbO2 curve position corresponding to pH 7.40 in arterial blood and to pH 6.80 locally in the microcirculation of hypoxic tissue, were also carried out.
Conversions
To facilitate comparisons of P50 values between our results and those of other authors, data originally given in mmHg or Torr is converted to kPa by the factor 1 kPa = 7.5 mmHg or Torr.
Statistics
Data representing P50 values () are shown as group medians with their standard deviation. For statistical purposes, data from adjacent days of storage were pooled, data shown in as days 7, 14, 17, 21, 23, 25, 28 and 34 represents days 7–8, 13–14, 16–17, 20–21, 22–23, 24–26, 27–28 and 32–35 days, respectively. The number of stored EC bags utilized within each storage period is shown in .
As analysis of raw data showed them to be normally distributed, parametric methods were utilized. A one-way ANOVA analysis was initially carried out for all storage times and each pH level. As all data from the first 16–17 days were obtained from samples originating from the same EC bags, a paired T-test was used for comparison of P50 values for the different storage periods during this period. Independent samples T-test was utilized for comparison of the longer storage periods, where the variations in donors on different storage days were greater. Regression analysis was used to analyse the relation between the pH and P50 values at each week of storage, differences in regression lines for the pH-P50 plots were based on differences between the 95% confidence intervals for each line. All analyses were carried out by means of the SPSS statistical software package, version 15.
Results
Changes in HbO2 dissociation curve during storage
The median P50 in the EC-plasma-electrolyte mixture on the day of blood donation was 3.47 kPa at pH 7.40, 4.75 kPa at 7.10, 5.96 kPa at pH 6.80 and 8.45 kPa at pH 6.30 (). The actual HbO2 dissociation curves corresponding to the P50 values are depicted in . There was no detectable change in P50 values during the first 2 days of storage; from 7 days and onwards, the P50 decreased (i.e. HbO2 affinity increased) for all pH levels (p < 0.001 for all pH levels pooled, p < 0.05 for analysis of each pH level separately). Analysis of changes in P50 values from the previous observation during storage showed a significant (see ) further decrease during the second week of storage. After 16–17 days, however, the P50 at all pH values was stabilized (see for actual HbO2 curves on days 16–17 of storage). The minor changes for the pH 6.80 level at the end of the storage period could not be detected for the other pH levels, and probably represent only random effects.
Figure 2. Actual HbO2 dissociation curves at 4 different pH values in blood from EC before storage (a) and after storage for 16–17 days (b). Vertical lines are drawn corresponding to PO2 values of 2.7 kPa (critical end-venous level), 5.3 kPa – Low (L), 13.3 kPa – Normal (N) and 20 kPa – High (H). The intersection between these lines and the HbO2 curves are marked with circles, the amount of consumable oxygen given as the ΔSO2 values depicted in the inserts was calculated as exemplified by the method shown for pH = 7.40 and PO2 = 5.3 kPa in both figures.
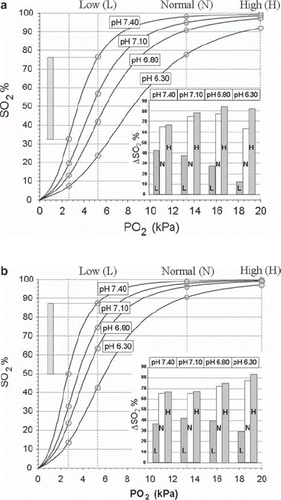
The magnitude of the P50 change, defined as the difference between the P50 values at day 0 and at day 16–17, was more marked in acidotic blood than at normal pH (), as could be expected from graphic presentations of pH-dependent curve shifts. The HbO2 leftward shift measured at pH ≈7.40 corresponded to a P50 change of approximately 0.68 kPa, with a curve position equal to that of fresh blood at a pH of ≈7.72 (). The leftward shift of P50 at pH 7.10 was 1.50 kPa, corresponding to normal blood at pH ≈7.40. At pH ≈6.80 the P50 shift was 1.45 kPa, corresponding to normal blood at pH 7.20. There was no statistical difference between the shifts at pH 7.10 and 6.80, but both were larger than at pH 7.40 (p < 0.001). At pH ≈6.30 the P50 shift was approximately 2.3 kPa, which was greater than that for the other pH values examined (p < 0.001 compared to pH 7.40, p < 0.05 compared to pH 7.10 and 6.80). The shift at this pH gave a P50 value corresponding to that of fresh blood at pH ≈6.85.
Consequences of erythrocyte storage for consumable oxygen
The amount of consumable O2, expressed as the difference in SO2 between that corresponding to the PO2 of arterial blood and a microcirculatory end-venous PO2 of 2.7 kPa (ΔSO2), was calculated from the HbO2 dissociation curves on storage day 0 ( and insert) and after the affinity change had stabilized at 16–17 days ( and insert). On day 0, the amounts of consumable O2 at high (20.0 kPa, 150 mm Hg) and normal (13.3 kPa, 100 mm Hg) PO2 levels increased with mounting acidosis from pH 7.40 to pH 6.80, but started to decline when pH fell to 6.30. At low PO2 (5.3 kPa, 40 mm Hg), corresponding to grave clinical hypoxemia, the consumable O2 decreased continuously with increasing acidosis. After storage for 16–17 days, the amount of consumable O2 at high and normal PO2 followed the same pattern as on day 0, but was reduced by almost 20% at pH 7.40 and about 10% at pH 7.10. At extreme acidosis of pH 6.30, however, the amount of consumable O2 was higher after storage, by about 2% at high and by 14% at normal PaO2. At the low PO2 level, the amount of consumable O2 at pH 7.40 was slightly smaller after storage than on day 0; the increased HbO2 affinity of storage proved, however, progressively beneficial compared to day 0 with mounting acidosis (ΔSO2 at pH 7.10: 42.0% vs 37.5%, at pH 6.80: 39.9% vs 27.3% and at pH 6.30: 29.1% vs 12.1%, respectively).
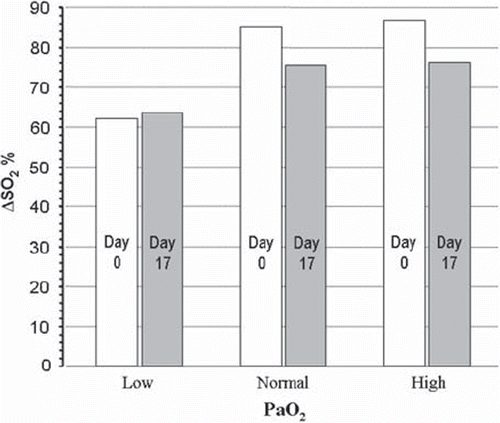
Similar calculations, but assuming that the arterial blood was maintained at pH 7.40 while that in poorly oxygenated tissue was acidified to pH 6.80 (see methods), are shown in . Again, storage reduces consumable O2 at high and normal PaO2 values, but to a lower degree than that calculated for a constant pH. Storage will have a slight beneficial effect at very low PO2 (ΔSO2 63.6 % vs. 62.1 %).
Figure 3. Consumable oxygen, assuming a pH 7.40 in arterial blood and pH 6.80 in the microcirculation, calculated for Low, Normal and High PO2 values as in the inserts in and .
P50 as a function of pH
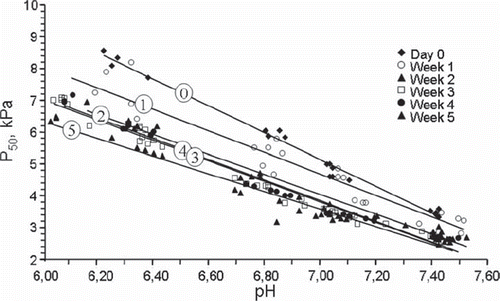
The relationship between pH and P50 was almost linear within the acidotic pH range compatible with survival, both initially and after storage (). Analysis of regression with pH as the independent variable showed a strong correlation before storage (r2 = 0.981, p < 0.001), as well as after 1 week, (r2 = 0.928, p < 0.001), 2 weeks (r2 = 0.974, p < 0.001), 3 weeks (r2 = 0.981, p < 0.001), 4 weeks (r2 = 0.978, p < 0.001) and 5 weeks (r2 = 0.961, p < 0.001). The rise rate was steeper on day 0 before storage, with essentially similar slopes at 1 week of storage and for longer storage periods. The 95% confidence interval for the pH-P50 regression line on day 0 was different from those for 2 weeks and onward (−4.146, −3.681 vs. −3.384, −2.887 at 2 weeks, −3.228, −2.788 at 3 weeks, −3.458, −3.060 at 4 weeks and −3.006, −2.546 at 5 weeks of storage). The difference between the lines at day 0 and 1 week of storage (−3.774, −2.946) was borderline.
Figure 4. The relationship between pH and P50 values at 0, 1, 2, 3, 4 and 5 weeks of storage shown as a scatterplot, symbols as shown in the figure. The trend lines for each period are numbered corresponding to weeks of storage.
Discussion
The P50 value in fresh blood at pH 7.40 is usually given as 3.47–3.87 kPa (26–29 mmHg) [Citation12,Citation13]. In our study, the P50 in the EC suspension after the processing procedure (anticoagulation and separation) for EC employed in a modern blood bank corresponded to the lower value, and did not change after cooling and storage for 2 days. A leftward shift of the HbO2 curve became evident after 7 days of storage and became stabilized after 2.5 weeks. A storage-induced leftward shift of the HbO2 curve in whole blood was first quantified by Valtis and Kennedy in 1954 [Citation14] and later confirmed by others [Citation15,Citation16]. In blood processed and stored by the methods common at that time (ACD blood), the P50 after 15–20 days of storage, when calculated back to conditions at pH 7.40, was found to be lower than that of EC in our investigation. The magnitude of these differences are moderate, from 0.3 kPa (2 mmHg) [Citation14] to 0.7 kPa (5 mmHg) [Citation16]. In contrast to our data, two of the previous studies [Citation14,Citation15] found that most of the change in the HbO2 curve occurred within the first 7 days of storage, while another [Citation16], analogous to our data, found that the bulk of the P50 change occurred within the first 15 days. The differences in the magnitude of change and the time pattern may, at least in part, be attributed to the different routines for erythrocyte preservation in use during the time when the investigations were carried out.
The main cause of the affinity change has been identified as a reduction in erythrocyte 2, 3-diphosphoglycerate (2,3-DPG) [Citation1] during blood bank storage. A previous investigation in our blood bank, utilizing blood processed and stored by the same routine as in our experiments, showed that the erythrocyte 2,3-DPG levels were well maintained during the first 24 h, but declined to 60–80% during the first week of storage and further reduced to 30–40% of the initial value after 2 weeks of storage. A further reduction to about 20% was seen after 25 days [Citation17]. As the leftward shift of the HbO2 curve seems to have stabilised after 2–2.5 weeks in our study, the last 20% reduction of 2,3-DPG seems to have little impact on the P50 of the stored blood. Incubation of erythrocytes with phosphate mixtures may increase the erythrocyte content of 2,3 DPG. In a clinical setting involving urgent need for massive transfusions, such pre-treatment of stored erythrocytes would be impractical.
Some authors have considered the reduced O2 unloading ability of blood with a leftward curve shift as a major argument against a beneficial effect of bank blood transfusions [Citation2,Citation3]. In our study, adding H+to the erythrocyte solution could abolish the HbO2 affinity change induced by blood bank storage. In clinical settings involving massive transfusions (e.g. major trauma), arterial and/or tissue acidosis can be expected; the transfused blood would then have an O2 unloading capability similar to that of a person's own blood at normal pH.
Whether an HbO2 curve shift has negative or positive consequences for tissue O2 delivery depends on the mechanisms underlying threatening or manifest hypoxia in each particular patient. A rightward shift of the HbO2 curve increases O2 unloading in the microcirculation; at extreme, but clinically relevant acidosis [Citation18], the microcirculatory SO2 may fall to 7–8% before the PO2 decreases below 2.7 kPa (20 mmHg) [Citation6]. This makes almost all O2 in the blood available to the tissue cells. On the other hand, it decreases the SO2 corresponding to a given PO2 in the blood leaving the lungs. This effect is of minor significance if the acidosis is moderate and the PaO2 levels are in the normal or supranormal range. At an extreme pH of 6.30, however, a normal PaO2 of 13.3 kPa (100 mmHg) results in an SaO2 of only 76–77%, and a PaO2 of approximately 30 kPa (225 mmHg) is necessary to obtain a normal SaO2 [Citation6]. The effect of acidosis-induced rightward shift on SaO2 is accentuated if the patient also has respiratory insufficiency. A PaO2 of 7.0 kPa (52.5 mmHg), which at normal pH would give a SaO2 of 87 %, resulted in a SaO2 of 45% in a patient with a pH of 6.66 [Citation19].
Under normal conditions, the CO2 released by tissue cells induces a slight acidification and thus a minor rightward shift of the HbO2 curve as arterial blood enters the microcirculation (the ‘Bohr shift’). The shift is reversed when CO2 is excreted by the lungs. During episodes of threatening or manifest tissue hypoxia, the optimal condition for transport and utilization of O2 would be a left-shifted HbO2 curve position in the blood during passage through the lungs (ensuring optimal CaO2), and a major shift to the right in the microcirculation (ensuring optimal tissue PO2). During circulatory failure or maximal exercise, a local tissue H+ concentration up to ten times higher than that in normal arterial blood may develop [Citation20,Citation21]. If the amount of the locally generated excess acid metabolites is within the elimination capability of the organism, this acidosis will not necessarily be reflected in arterial blood [Citation21,Citation22]. As illustrated by , a situation in which arterial pH is 7.40 and that in the most vulnerable tissues is 6.80, the amount of consumable O2 at the very low PaO2 of 5.3 kPa may be maintained at a level close to that calculated for a normal PaO2 at a pH of 7.40.
Under conditions where the PaO2 is very low, a leftward shift of the HbO2 curve (see and ) may be necessary for survival. During vaginal delivery the baby's PaO2 may decrease to values in the 2.9–3.33 kPa (22–25 mmHg) range [Citation23], a leftward HbO2 curve shift due to fetal Hb makes a SaO2 in the 60–70% range possible. A marked leftward shift, induced by arterial blood alkalosis, is also a prerequisite for maintaining an acceptable SaO2 during high altitude ascents without supplementary O2 [Citation24,Citation25]. Theoretically, a left shifted HbO2 curve could therefore also be advantageous in catastrophic lung failure with very low PaO2 values.
The increased affinity for O2 in erythrocytes stored for up to 35 days in our study was reversed by acidification of the suspension medium. The range of pH values chosen for examination in our study is clinically relevant. Most clinicians will treat a metabolic acidosis before it reaches pH 7.10 [Citation26–28], especially in unstable patients, a pH of 6.80 is often cited as the lower limit for expected survival [Citation29,Citation30]. Nevertheless, many clinicians have successfully treated patients with even lower values; ultimate survival and restitution with a pH value of 6.33 in arterial blood has been reported [Citation18]. Equal, or even lower pH values may exist locally in hypoxic tissue [Citation20,Citation21]. In our study, acidification right-shifted the HbO2 curve of stored EC close to that of fresh blood; after 2.5 weeks of storage the curve at pH 7.10 was similar to that of fresh blood at pH 7.40.
The term consumable (or extractable) O2 has been used to denote the amount of oxygen that can be extracted from the blood before tissue cells becomes dysfunctional because of hypoxia [Citation31,Citation32], calculations of this parameter give an indication of the consequences of HbO2 curve shifts for O2 tissue supply. The results of such calculations are not exact, as the use of a lower borderline value of 2.7 kPa (20 mmHg) is somewhat arbitrary and direct measurements of tissue PO2 levels vary considerably [Citation33–35]. Our calculations indicate, however, that the left-shifted HbO2 curve of stored EC could be advantageous at a low arterial PO2. Since the pH-dependent change in Hb affinity for O2 is largely conserved in stored blood, the leftward shift of the HbO2 curve in stored EC probably has no deleterious effect in most patients.
Conclusion
As the leftward HbO2 curve shift occurring during storage does not abolish the rightward shift induced by acidosis, the increased HbO2 affinity of EC stored for 2 weeks or more does not represent a major tissue oxygenation problem in most transfused patients.
Acknowledgements
This work was supported in part by a grant from the Health Trust South-East, Norway.
The assistance and advice of Professor Emeritus Harald Refsum, MD, PhD, during the initial phase of this study is greatly appreciated, as is the statistical assistance of Professor Leiv Sandvik, PhD.
Declaration of interest: The authors report no conflicts of interest. The authors alone are responsible for the content and writing of the paper.
References
- Benesch RE, Benesch R. The reaction between diphosphoglycerate and hemoglobin. Fed Proc 1970;29:1101–4.
- Sladen RN. The oxyhemoglobin dissociation curve. Inter Anesthesiol Clin 1981;19:39–70.
- Marik PE, Sibbald WJ. Effect of stored-blood transfusions on patients with sepsis. JAMA 1993;269:3024–9.
- Solheim BG, Hess JR. Red Cell Metabolism and preservation. Simon TL, Snyder EL, Solheim BG, Stowell CP, Strauss RG, Petrides M, Rossi's principles of transfusion medicine (54–68). Oxford: Wiley-Blackwell, 2009.
- Raat NHJ, Ince C. Oxygenating the microcirculation: the perspective from blood transfusion and blood storage. Vox Sang 2007;93:12–8.
- Refsum H, Opdahl H, Leraand S. Effect of extreme metabolic acidosis on the oxygen content of the blood. Crit Care Med 1997;25:1497–1501.
- Bryan-Brown CW, Baek S-M, Makabi G, Shoemaker WC. Consumable oxygen: availability of oxygen in relation to oxyhemoglobin dissociation. Crit Care Med 1973;1:17–21.
- Siggaard-Andersen O. Blood acid-base alignment nomogram. Scand J Clin Lab Invest 1963;15:211–7.
- Severinghaus JW. Simple, accurate equation for human blood O2 dissociation computations. J Appl Physiol 1979;46:599–602.
- Kelman GR, Nunn JF. Nomograms for correction of blood PO2, PCO2, pH, and base excess for time and temperature. J Appl Physiol 1966;21:1484–90.
- Jones JG, Holland BM, Veale KE, Wardrop CA. ‘Available oxygen’, a realistic expression of the ability of the blood to supply oxygen to tissues. Scand J Haematol 1979;22:77–82.
- Winslow RM, Svenberg ML, Berger RL, Luzzana M, Samja M, Rossi-Bernardini L. Oxygen equilibrium curve of normal human blood and its evaluation by Adairs equation. J Biol Chem 1977;252:2331–7.
- Hsia CCW. Respiratory function of haemoglobin. N Engl J Med 1998;388:239–47.
- Valtis DJ, Kennedy AC. Defective gas transport function of stored red blood-cells. Lancet 1954;1:119–25.
- Bunn HF, May MH, Kocholaty WF, Shields CE. Hemoglobin function in stored blood. J Clin Invest 1969;48:311–21.
- McConn R, Derrick JB. The respiratory function of blood: transfusion and storage. Anesthesiology 1972;36:119–27.
- Llohn AH, Vetlesen A, Fagerhol MK, Kjeldsen-Kragh J. The effect of pre-storage cooling on 2,3-DPG levels in red cells stored in SAG-M. Transfus Apheresis Sci 2005;33:113–8.
- Opdahl H. Survival put to the acid test. Extreme arterial blood acidosis (pH 6.33) after near drowning. Crit Care Med 1997;25:1431–6.
- Pytte M, Opdahl H, Skaga NO. Grave acidosis after severe anaphylactic bronchospasm: friend or foe? Acta Anaesthesiol Scand 2007;51;495–500.
- Robergs RA, Ghiasvand F, Parker D. Biochemistry of exercise-induced metabolic acidosis. Am J Regul Intergr Comp Physiol 2004;287:R502–16.
- Kette F, Weil MH, Gazmuri RJ, Bisera J, Rackow EC. Intramyocardial hypercarbic acidosis during cardiac arrest and resuscitation. Crit Care Med 1993;21:901–6.
- McDaniel LB, Zwischenberger JB, Vertrees R, Nutt RA, Uchida L, Nguyen T, Kramer GC. Mixed venous oxygen saturation during cardiopulmonary bypass poorly predicts regional venous saturation. Anesth Analg 1995;80:466–72.
- Ramin S, Gilstrap LC, Leveno KJ, Burris J, Little BB. Umbilical artery acid-base status in the preterm infant. Obstet Gynecol 1989;74:256–8.
- West JB. High living: Lessons from extreme altitude. Am Rev Respir Dis 1984;130:917–23.
- Grocott MPW, Martin DS, Levett DZH, McMorrow R, Windsor J, Montgomery HE. Arterial blood gases and oxygen content in climbers on Mount Everest. N Engl J Med 2009; 360:140–9.
- Levraut J, Grimaud D. Treatment of metabolic acidosis. Curr Opin Crit Care 2003;9:260–5.
- Eddy VA, Morris JA, Cullinane DC. Hypothermia, coagulopathy, and acidosis. Surg Clin North Am 2000;80:845–54.
- Morris CG, Low J. Metabolic acidosis in the critically ill: Part 2. Causes and treatment. Anaesthesia 2008;63:396–411.
- Bernards WC, Kirby RR. Acid-base chemistry and physiology. Civetta JM, Taylor RW, Kirby RR, Critical care (343–344). Philadelphia: JB Lippincott, 1992.
- Rose BD. Clinical physiology of acid-base and electrolyte disorders. New York: McGraw-Hill, 1989, 503.
- Lennox WG, Gibbs FA, Gibbs EL. Relationship of unconsciousness to cerebral blood flow and to anoxemia. Arch Neur Psychiat 1935;34:1001–10.
- Nunn JF. Applied respiratory physiology, 361–2. London: Butterworth and Co, 1969.
- Tsai AG, Johnson PC, Intaglietta M. Oxygen gradients in the microcirculation. Physiol Rev 2003;83:933–63.
- Rubin MJ, Bohlen HG. Cerebral vascular autoregulation of blood flow and tissue PO2 in diabetic rats. Am J Physiol Heart Circ Physiol 1985;249:H540–6.
- Tsai AG, Johnson PC, Intaglietta M. Is the distribution of tissue pO2 homogenous? Antioxid Redox Signal 2007;9:979–84.