
Abstract
Shrunken Pore Syndrome was recently suggested for the pathophysiologic state in patients characterized by an estimation of their glomerular filtration rate (GFR) based upon cystatin C, which is lower or equal to 60% of their estimated GFR based upon creatinine, i.e. when eGFRcystatin C ≤ 60% of eGFRcreatinine. Not only the cystatin C level, but also the levels of other low molecular mass proteins are increased in this condition. The preoperative plasma levels of cystatin C and creatinine were measured in 1638 patients undergoing elective coronary artery bypass grafting. eGFRcystatin C and eGFRcreatinine were calculated using two pairs of estimating equations, CAPA and LMrev, and CKD-EPIcystatin C and CKD-EPIcreatinine, respectively. The Shrunken Pore Syndrome was present in 2.1% of the patients as defined by the CAPA and LMrev equations and in 5.7% of the patients as defined by the CKD-EPIcystatin C and CKD-EPIcreatinine equations. The patients were studied over a median follow-up time of 3.5 years (2.0–5.0 years) and the mortality determined. Shrunken Pore Syndrome defined by both pairs of equations was a strong, independent, predictor of long-term mortality as evaluated by Cox analysis and as illustrated by Kaplan-Meier curves. Increased mortality was observed also for the subgroups of patients with GFR above or below 60 mL/min/1.73 m2. Changing the cut-off level from 60 to 70% for the CAPA and LMrev equations increased the number of patients with Shrunken Pore Syndrome to 6.5%, still displaying increased mortality.
Introduction
A decrease in GFR signals increased risks for development of end stage renal disease (ESRD), cardiovascular disease, hospitalization and death and GFR-estimations based upon cystatin C are consistently superior to GFR-estimations based upon creatinine to predict these conditions [Citation1–3]. The cause for the superiority of cystatin C as a risk marker is unknown, but it has been suggested that inflammation raises the cystatin C level, thereby augmenting its potential as a risk marker [Citation4]. However, studies of elective surgery on patients displayed a sharp rise in inflammation of the patients with large increases in the levels of CRP and other inflammatory markers, but with no increase in the level of cystatin C, thus allowing rejection of this hypothesis [Citation5]. Another hypothesis for the superiority of cystatin C as a risk marker is that an increase in cystatin C, with a molecular mass of 13343 Da, signals a shrinking of the pores in the glomerular membrane earlier than an increase in creatinine with a molecular mass of 113 Da [Citation6]. Studies of the plasma levels of cystatin C and other low molecular mass proteins, e.g. β2-microglobulin and beta-trace protein, in late pregnancy and in pre-eclampsia have produced results, which are compatible with the shrinking of glomerular pores in these conditions [Citation7–10]. A recent study of these proteins, in a general patient population, strongly indicated that a significant part of the population suffers from shrunken glomerular pores similar to the situation in late pregnancy and pre-eclampsia [Citation11]. It was observed that if the estimation of GFR based upon cystatin C was lower or equal to 60% of the estimation of GFR based upon creatinine, i.e. when eGFRcystatin C ≤ 60% of eGFRcreatinine, all other low molecular mass proteins studied, like cystatin C, displayed increased levels and this constellation of eGFRcystatin C and eGFRcreatinine, was therefore suggested to indicate the presence of a new syndrome called ‘Shrunken Pore Syndrome’ [Citation11]. The present study was undertaken to investigate if the presence of the Shrunken Pore Syndrome in a well-characterized and large cohort of patients undergoing elective coronary artery bypass grafting (CABG) predicts long-term mortality.
Materials
The plasma levels of cystatin C and creatinine were measured preoperatively in 1638 patients undergoing CABG from 1 January to 31 December 2010, at the Department of Cardiothoracic Surgery at Skåne University Hospital in Lund, Sweden. The study was approved by the local ethics committee (LU 2009/87). The characteristics of the patient population pre- and postoperatively are described in and .
Table I. Preoperative characteristics of the study cohort (n = 1638).
Table II. Postoperative characteristics of the study cohort (n = 1638).
Perioperative data was obtained from an in-house quality database. Laboratory data were continuously obtained from the hospital clinical chemistry department. Survival data were obtained from the national tax registry in December 2014, thus defining the follow-up period between 2 and 5 years with a mean follow-up of 3.5 years.
Methods
The plasma level of cystatin C was determined by an automated particle-based immunoassay, adjusted to the international reference preparation ERM-DA 471/IFCC [Citation12] and that of creatinine by an enzymatic colorimetric assay with an IDMS-traceable calibrator [Citation13]. Both assays were run on a cobas c-system (Roche Diagnostics, Basel, Switzerland). The assays were performed according to the manufacturer’s instructions. The CAPA [Citation12] and the CKD-EPIcystatin C [Citation14] estimating equations, based on cystatin C, were used to estimate GFR. So were the LMrev [Citation13] and CKD-EPIcreatinine [Citation14] estimating equations based on creatinine. The best estimate of GFR is the mean of eGFRcystatin C and of eGFRcreatinine (eGFRmean) and this is true also when eGFRcystatin C and eGFRcreatinine differ significantly, unless known disturbing factors like muscle wasting or treatment with large doses of glucocorticoids are present [Citation13–17]. Such disturbing factors were present preoperatively in very few of the patients undergoing CABG.
Statistical analysis
The variables are presented as absolute numbers with percentages, mean with standard deviation or median with interquartile ranges (25th and 75th percentile). Survival rates during follow-up were estimated by Kaplan-Meier curves and comparisons were made by log-rank test. The Cox multivariate proportional hazards model was used to determine independent predictors for mortality. The variables entered in the Cox proportional hazards regression model were age, gender, body mass index, chronic obstructive pulmonary disease preoperatively, preoperative hemoglobin, creatinine, leukocyte particle count, diabetes, instable angina pectoris, previous cerebrovascular lesion, peripheral vascular disease, ejection fraction, New York Heart association class, use of intra-aortic balloon pump both pre- and postoperatively, perfusion-time, atrial fibrillation both pre- and postoperatively, postoperative bleeding, sepsis, logarithm of time in ventilator, logarithm of units of plasma transfusion, erythrocyte transfusion, platelet transfusion, mediastinitis, postoperative stroke and renal replacement therapy. A backward stepwise elimination method yielded the following risk factors as independent predictors for mortality after CABG presented in detail in age, peripheral vascular disease, left ventricular function (reference EF > 30%), time spent in the ICU, preoperative hemoglobin, sepsis, logarithm of units of plasma transfused and the pre-operative renal function as estimated by equations based upon combined values of cystatin C and creatinine, e.g. CAPA-LMrev or CKD-EPIcystatin C-CKD-EPIcreatinine [Citation12–14]. These significant predictors of mortality were used in the final model. This model was used for determining the independent effect of the Shrunken Pore Syndrome by adding this variable to the model. The adjusted Hazard Ratio (HR) and 95% confidence intervals (95% CI) were calculated for Shrunken Pore Syndrome as a predictor; p-values < 0.05 (two-tailed) were considered statistically significant. Statistical analysis was performed with Statistica software, version 12.0 (Stat Soft, Inc. Tulsa, OK, USA).
Table III. Cox multivariate analysis of patients with and without Shrunken Pore Syndrome. (A) Defined by the equation pair CKD-EPIcystatin C and CKD-EPIcreatinine with a cut-off of 60% (i.e. eGFRcystatin C ≤ 0.6 eGFRcreatinine). (B) Defined by the equation pair CAPA and LMrev with a cut-off of 60% (i.e. eGFRcystatin C ≤ 0.6 eGFRcreatinine). (C) Defined by the equation pair CAPA and LMrev with a cut-off of 70% (i.e. eGFRcystatin C ≤ 0.7 eGFRcreatinine).
Results
The Shrunken Pore Syndrome was identified both by the equation pair CAPA and LMrev and by the equation pair CKD-EPIcystatin C and CKD-EPIcreatinine in this study. The prevalence of preoperative Shrunken Pore Syndrome was 2.1% (34/1638) and 5.7% (93/1638), respectively. The 2- and 5-year survival for all patients was (mean ± 95% CI) 96.1 ± 0.4% and 90.0 ± 1.2%, respectively. Late survival for patients with Shrunken Pore Syndrome as defined by the equation pair CAPA and LMrev was 82.4 ± 6.5% and 58.8 ± 9.0% at 2 and 5 years, respectively. Late survival for patients with Shrunken Pore Syndrome as defined by the equation pair CKD-EPIcystatin C and CKD-EPIcreatinine was 81.7 ± 0.4% and 65.1 ± 0.6% at 2 and 5 years, respectively.
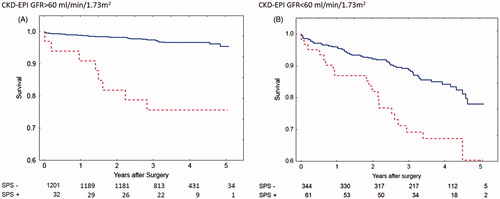
Shrunken Pore Syndrome was found to be a significant predictor for mortality in the Cox analysis when the equation pair CKD-EPIcystatin C and CKD-EPIcreatinine was used (). The cohort was divided into subgroups of patients with eGFRmean < 60 mL/min/1.73 m2 or eGFRmean ≥ 60 mL/min/1.73 m2 and the associations between survival, and the presence of Shrunken Pore Syndrome preoperatively, were studied. Strong associations (), and a marked decrease in survival, were found for both subgroups. The survival rates are illustrated by the Kaplan-Meier curves in .
Figure 1. Calculations using the CKD-EPI formulas based on cystatin C or creatinine. Survival after coronary artery bypass surgery for patients with eGFR > 60 mL/min/1.73 m2 (A) with Shrunken Pore Syndrome (SPS, red broken line) and without (blue solid line). Patients with eGFR< 60 mL/min/1.73 m2 are seen in (B). The cut-off level for SPS was 0.6. For both levels of eGFR: p < 0.001 with log-rank test.
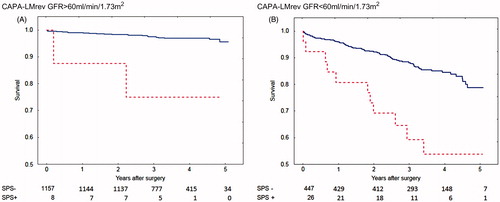
Shrunken Pore Syndrome was also found to be a significant predictor for mortality in the Cox analysis when the equation pair CAPA and LMrev was used (). This cohort was also divided into subgroups of patients with eGFRmean < 60 mL/min/1.73 m2 and eGFRmean ≥ 60 mL/min/1.73 m2, and the associations between survival, and the presence of Shrunken Pore Syndrome preoperatively, were studied. Strong associations, and a marked decrease in survival, were found for both subgroups (). The survival rates are illustrated by the Kaplan-Meier curves in .
Figure 2. Calculations using the CAPA and LMrev formulas based on cystatin C or creatinine. Survival after coronary artery bypass surgery for patients with eGFR > 60 mL/min/1.73 m2 (A) with Shrunken Pore Syndrome (SPS, red broken line) and without (blue solid line). Patients with eGFR < 60 mL/min/1.73 m2 are seen in (B). The cut-off level for SPS was 0.6. For both levels of eGFR: p < 0.001 with log-rank test.
The number of patients (34) identified as suffering from the Shrunken Pore Syndrome preoperatively by the equation pair CAPA and LMrev was considerably lower than that (93) identified by the equation pair CKD-EPIcystatin C and CKD-EPIcreatinine, although the same criterion for Shrunken Pore Syndrome (eGFRcystatin C ≤ 60% of eGFRcreatinine) was used in both cases. This was most probably due to that the CKD-EPIcreatinine estimation equation produced significantly higher GFR estimates than the other three estimation equations in the patient cohort studied. The average GFR value for the cohort was 78 mL/min/1.73 m2 as estimated by CKD-EPIcreatinine, whereas the averages estimated by CKD-EPIcystatin C, LMrev and CAPA were 68, 70 and 67 mL/min/1.73 m2, respectively (). This means that smaller changes in estimates based upon CKD-EPIcystatin C are required to reach the criterion of eGFRcystatin C ≤ 60% of eGFRcreatinine, when the equation pair CKD-EPIcystatin C and CKD-EPIcreatinine is used. To compare the potential of the two equation pairs to identify patients with a significant increase in mortality, we therefore increased the cut-off level defining Shrunken Pore Syndrome by the equation pair CAPA and LMrev to eGFRcystatin C ≤ 70% of eGFRcreatinine. With this cut-off level, 106 patients (6.5%) were defined as suffering from the Shrunken Pore Syndrome. The association between survival, and the presence of Shrunken Pore Syndrome preoperatively, as identified by the equation pair CAPA and LMrev with the new cut-off level was then studied by Cox multivariate analysis for the whole patient cohort. A strong, statistically significant, association was observed (). The cohort was divided into subgroups of patients with eGFRmean < 60 mL/min/1.73 m2 and eGFRmean ≥ 60 mL/min/1.73 m2 and the associations between survival, and the presence of Shrunken Pore Syndrome preoperatively, were studied. Strong associations, and a marked decrease in survival, were found for both subgroups also in this case (). The survival rates are illustrated by the Kaplan-Meier curves in .
Figure 3. Calculations using the CAPA and LMrev formulas based on cystatin C or creatinine. Survival after coronary artery bypass surgery for patients with eGFR > 60 mL/min/1.73 m2 (A) with Shrunken Pore Syndrome (SPS, red broken line) and without (blue solid line). Patients with eGFR < 60 mL/min/1.73 m2 are seen in (B). The cut-off level for SPS was 0.7. For both levels of eGFR: p < 0.001 with log-rank test.
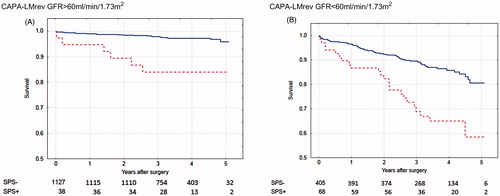
Although the numbers of patients with Shrunken Pore Syndrome (SPS+), displayed in , were few at the 4- and 5-year follow-up, the Kaplan-Meier curves show that mortality starts to separate earlier than this period, when the numbers of patients with Shrunken Pore Syndrome were higher.
When the patient groups identified as suffering from the Shrunken Pore Syndrome preoperatively by the equation pair CKD-EPIcystatin C and CKD-EPIcreatinine, using the cut-off level of 60% and by the equation pair CAPA and LMrev, using the new cut-off level of 70%, were compared, it was found that 82 of the 93 patients were found also in the group of patients defined as suffering from the Shrunken Pore Syndrome by the equation pair CAPA and LMrev, using the new cut-off level. When the patient groups identified as suffering from the Shrunken Pore Syndrome preoperatively by the equation pair CAPA and LMrev, using the new cut-off level and by the equation pair CKD-EPIcystatin C and CKD-EPIcreatinine, using the cut-off level of 60% were compared, it was found that 82 of the 106 patients were found also in the group of patients defined as suffering from the Shrunken Pore Syndrome by the equation pair CKD-EPIcystatin C and CKD-EPIcreatinine, using the cut-off level of 60%. summarizes the number of patients defined as suffering from Shrunken Pore Syndrome by the three different constellations of GFR-estimating equations.
Table IV. Number of patients defined as suffering from ‘Shrunken Pore Syndrome’ by different GFR-estimating equation constellations.
Discussion
The existence of a Shrunken Pore Syndrome was suggested from a recent study of 1349 consecutive patients, 731 men and 618 women, between 3 and 95 years of age, for which eGFR was requested at the department of clinical chemistry [Citation11]. To estimate GFR both the LMrev-equation, based upon creatinine, and the CAPA-equation, based upon cystatin C, were used and the Shrunken Pore Syndrome was defined by eGFRcystatin C being less or equal to 60% of eGFRcreatinine in a patient [Citation11]. However, the clinical implications of the presence of the Shrunken Pore Syndrome were not investigated. The present study of a well characterized population of 1638 patients scheduled for elective CABG demonstrated that the presence of the Shrunken Pore Syndrome preoperatively was independently associated with a marked increase in late mortality.
The present study found a Hazard Ratio of approximately 3 for Shrunken Pore Syndrome, which indicates the ominous nature of this syndrome. Patients with low BMI have lower muscle mass, and thus lower creatinine values, than patients with normal or high BMI, and a high proportion of patients with low BMI in a population might therefore influence the number of patients defined as suffering from Shrunken Pore Syndrome. We therefore excluded the 25 patients with BMI < 20 kg/m2 from the population studied and repeated the statistical analysis. There was no reduction in hazard ratio (HR) values for presence of the Shrunken Pore Syndrome after excluding patients with BMI < 20 kg/m2. The presence of patients with low BMI therefore seems to have little influence upon the clinical consequences of Shrunken Pore Syndrome.
It should be observed that the present study is limited to a select patient category, and an urgent task is, of course, to study the association between the syndrome and its consequences in other populations, and with other end-points than mortality.
The cut-off of eGFRcystatin C ≤ 60% of eGFRcreatinine, suggested for definition of the syndrome, was chosen from the eGFR values frequently occurring in pre-eclampsia [Citation11], but is, of course, somewhat arbitrary and may not be the most efficient for identification of risk individuals in neither the population used to define the syndrome; nor in other types of patient populations. To specify a suitable cut-off in a specific type of population would require that the population is very big so that the occurrence of significant clinical consequences can be studied at various cut-off levels. The present population of patients undergoing CABG is not big enough to allow such a study, but may be expanded to allow it.
A further problem in establishing a suitable cut-off level defining the syndrome is that different GFR-estimating equations may produce different values. For example, in the present patient cohort the CKD-EPIcreatinine-equation produced estimations of GFR which were about 10% higher than the estimates produced by the CKD-EPIcystatin C-, CAPA- and LMrev-equations, which showed mutually consistent results. This means that smaller changes in estimates based upon CKD-EPIcystatin C are required to reach the criterion of eGFRcystatin C ≤ 60% of eGFRcreatinine, when the equation pair CKD-EPIcystatin C and CKD-EPIcreatinine is used rather than the equation pair CAPA and LMrev. To compare the potential of the two equation pairs to identify patients with a significant increase in mortality as a results of the presence of the Shrunken Pore Syndrome, we increased the cut-off level defining Shrunken Pore Syndrome by the equation pair CAPA and LMrev to eGFRcystatin C ≤ 70% of eGFRcreatinine, resulting in 106 patients (6.5%) being identified as suffering from the syndrome. Also in this group of patients a strong, statistically significant, increase in late mortality was observed, both in patients with eGFRmean below and above 60 mL/min/1.73 m2 (, ). The population identified was almost identical with the population defined by the original cut-off level of 60% in the equation pair CKD-EPIcystatin C and CKD-EPIcreatinine. These results elucidate some of the problems of selecting a suitable cut-off level to identify individuals suffering from the Shrunken Pore Syndrome.
The Cox multivariate analysis demonstrated that the preoperative presence of Shrunken Pore Syndrome independently predicts poorer survival in addition to previously known risk factors like age, preoperative hemoglobin level, presence of peripheral vascular disease and preoperative eGFR () [Citation18]. A remarkable finding is that the hazard ratios (2.7–3.4), defined by the three different constellations of equation pairs used in this investigation, are considerably higher than those of some well known risk-factors such as peripheral vascular disease (HR 1.8) and depressed left ventricular ejection fraction (HR 1.5) on the Cox analysis. Whether this severe nature of the Shrunken Pore Syndrome holds true for other patient cohorts needs to be explored.
The use of eGFRcystatin C ≤ 60% of eGFRcreatinine to define the presence or absence of Shrunken Pore Syndrome can be replaced by the use of the ratio: eGFRcystatin C/eGFRcreatinine ≤ 0.6. Since the decisive terms in eGFRcystatin C and eGFRcreatinine are cystatin C and creatinine, respectively, the cystatin C/creatinine-ratio will also be related to the presence of the putative Shrunken Pore Syndrome and to late mortality in the present population. However, the GFR-estimating equations are more closely related to GFR, than isolated cystatin C- and creatinine-levels, and our statistical analyses have not been able to display any advantage of using the cystatin C/creatinine-ratio, rather than the relation eGFRcystatin C ≤ 60% of eGFRcreatinine, to reveal an increase in late mortality in our population. However, our population is relatively small and homogeneous and the results may be different for subgroups in bigger and more heterogeneous populations.
Comparison of eGFRcystatin C and eGFRcreatinine is easy to use for identification of a putative Shrunken Pore Syndrome. A more rigorous way to identify shrunken pores is to use invasive procedures in which substances, only being excreted by glomerular filtration, and of different molecular sizes, are injected and their plasma or renal clearance determined. The polysaccharides dextran and Ficoll of great polydispersity have been extensively used in animals to demonstrate a reduction or an increase in glomerular pore diameter in various pathophysiological states. There are also a few studies in humans [Citation19–26], in which these substances have been used to demonstrate the presence of shrunken or widened glomerular pores, but the laborious procedures and accompanying ethical aspects will probably not allow their general use in health care.
Despite the work remaining to find suitable cut-off levels for identifying the Shrunken Pore Syndrome, it seems clear that the syndrome indicates a pathophysiological state with severe clinical consequences. Future challenges are to elucidate the etiology and pathophysiology of the syndrome and to study if the development of the syndrome can be stopped or delayed. It is possible that the pathophysiology of Shrunken Pore Syndrome is related to that of pre-eclampsia and thus involves endothelial dysfunctions [Citation27]. Since pre-eclampsia is reversible and can be treated, this might also be true for Shrunken Pore Syndrome [Citation27].
Acknowledgements
The investigation was supported by grants from Skåne University Hospital Funds, the Alfred Österlund Foundation, Greta and Johan Kock Foundation, Medical Faculty of the University of Lund and from Region Skåne.
Declaration of interest
The authors report no conflict of interest. The authors alone are responsible for the content and writing of the paper.
References
- Shlipak MG, Sarnak MJ, Katz R, Fried LF, Seliger SL, Newman AB, Siscovick DS, Stehman-Breen C. Cystatin C and the risk of death and cardiovascular events among elderly persons. N Engl J Med 2005;352:2049–60.
- Peralta CA, Shlipak MG, Judd S, Cushman M, McClellan W, Zakal NA, Safford MM, Zhan X, Muntner P. Detection of chronic kidney disease with creatinine, cystatin C, and urine albumin-to-creatinine ratio and association with progression to end-stage renal disease and mortality. JAMA 2011;305:1545–52.
- Shlipak MG, Matsushita K, Ärnlöv J, Inker LA, Katz R, Polkinghorne KR, Rothenbacher D, Sarnak MJ, Astor BC, Coresh J, Levey S, Gansevoort RT. Cystatin C versus creatinine in determining risk based on kidney function. N Engl J Med 2013;369:932–43.
- Knight EL, Verhave JC, Spiegelman D, Hillege HL, deZeeuw D, Curhan GC, deJong PE. Factors influencing cystatin C levels other than renal function and the impact on renal function measurement. Kidney Int 2004;65:1416–21.
- Grubb A, Björk J, Nyman U, Pollak J, Bengzon J, Östner G, Lindström V. Cystatin C, a marker for successful aging and glomerular filtration rate, is not influenced by inflammation. Scand J Clin Lab Invest 2011;71:145–19.
- Grubb A, Lindström V, Kristensen K, Christensson A, Wide-Swensson D, Strevens H, Schmidt C, Blirup-Jensen S. Filtration quality: a new measure of renal disease. Clin Chem Lab Med 2007;45(Suppl.):S273–4.
- Strevens H, Wide-Swensson D, Torffvit O, Grubb A. Serum cystatin C for assessment of glomerular filtration rate in pregnant and non-pregnant women. Indications of altered filtration process in pregnancy. Scand J Clin Lab Invest 2002;62:141–7.
- Kristensen K, Lindström V, Schmidt C, Blirup-Jensen S, Grubb A, Wide-Swensson D, Strevens H. Temporal changes of the plasma levels of cystatin C, beta-trace protein, β2-microglobulin, urate and creatinine during pregnancy indicate continuous alterations in the renal filtration process. Scand J Clin Lab Invest 2007;67:612–8.
- Strevens H, Wide-Swensson D, Grubb A. Serum cystatin C is a better marker for preeclampsia than serum creatinine or serum urate. Scand J Clin Lab Invest 2001;61:575–80.
- Kristensen K, Wide-Swensson D, Schmidt C, Blirup-Jensen S, Lindström V, Strevens H, Grubb A. Cystatin C, beta-2-microglobulin and beta-trace protein in pre-eclampsia. Acta Obstet Gynecol Scand 2007;86:921–6.
- Grubb A, Lindström V, Jonsson M, Bäck SE, Åhlund T, Rippe B, Christensson A. Reduction in glomerular pore size is not restricted to pregnant women. Evidence for a new syndrome: “Shrunken pore syndrome”. Scand J Clin Lab Invest 2015;75:333–40.
- Grubb A, Horio M, Hansson LO, Björk J, Nyman U, Flodin M, Larssson A, Bökenkamp A, Yasuda Y, Blufpand H, Lindström V, Zegers I, Althaus H, Blirup-Jensen S, Itoh Y, Sjöström P, Nordin G, Christensson A, Klima H, Sunde K, Hjort-Christensen P, Armbruster D, Ferrrero C. Generation of a new cystatin C-based estimating equation for glomerular filtration rate using seven assays standardized to the international calibrator. Clin Chem 2014;60:974–86.
- Nyman U, Grubb A, Larsson A, Hansson L-O, Flodin M, Nordin G, Lindström V, Björk J. The revised Lund-Malmö GFR estimating equation outperforms MDRD and CKD-EPI across GFR, age and BMI intervals in a large Swedish population. Clin Chem Lab Med 2014;52:815–24.
- Inker LA, Schmid CH, Tighiouart H, Eckfeldt JH, Feldman HI, Greene T, Kusek JW, Manzi J, Van Lente F, Zhang YP, Coresh J, Levey AS. Estimating glomerular filtration rate from serum creatinine and cystatin C. N Engl J Med 2012;367:20–9.
- Nyman U, Grubb A, Sterner G, Björk J. Different equations to combine creatinine and cystatin C to predict GFR. Arithmetic mean of existing equations performs as well as complex combinations. Scand J Clin Lab Invest 2009;69:619–27.
- Grubb, A. Non-invasive estimation of glomerular filtration rate (GFR). The Lund model: simultaneous use of cystatin C- and creatinine-based GFR-prediction equations, clinical data and an internal quality check. Scand J Clin Lab Invest 2010;70:65–70.
- Grubb A, Nyman U, Björk, J. Improved estimation of glomerular filtration rate (GFR) by comparison of eGFRcystatin C and eGFRcreatinine. Scand J Clin Lab Invest 2012;72:73–7.
- Dardashti A, Ederoth P, Algotsson L, Brondén B, Bjursten H. Incidence, dynamics, and prognostic value of acute kidney injury for death after cardiac surgery. J Thorac Cardiovasc Surg 2014;147:800–7.
- Arturson G, Groth T, Grotte G. Human glomerular membrane porosity and filtration pressure: dextran clearance data analysed by theoretical models. Clin Sci 1971;40:137–58.
- Carrie BJ, Myers BD. Proteinuria and functional characteristics of the glomerular barrier in diabetic nephropathy. Kidney Int 1980;17:669–76.
- Scandling JD, Myers BD. Glomerular size-selectivity and microalbuminuria in early diabetic glomerular disease. Kidney Int 1992;41:840–6.
- Deckert T, Kofoed-Enevoldsen A, Vidal P, Nørgaard K, Andreasen HB, Feldt-Rasmussen B. Size- and charge selectivity of glomerular filtration in Type 1 (insulin-dependent) diabetic patients with and without albuminuria. Diabetologia 1993;36:244–51.
- Roberts M, Lindheimer MD, Davison JM. Altered glomerular permselectivity to neutral dextrans and heteroporous membrane modeling in human pregnancy. Am J Physiol 1996;270:F338–43.
- Blouch K, Deen WM, Fauvel JP, Bialek J, Derby G, Myers BD. Molecular configuration and glomerular size selectivity in healthy and nephrotic humans. Am J Physiol 1997;273:F430–7.
- Zayas CF, Guasch A. Early glomerular dysfunction in human renal allografts. Kidney Int 2001;60:1938–47.
- Oberbauer R, Nenov V, Weidekamm C, Haas M, Szekeres T, Mayer G. Reduction in mean glomerular pore size coincides with the development of large shunt pores in patients with diabetic nephropathy. Exp Nephrol 2001;9:49–53.
- Sasser JM, Murphy SR, Granger JP. Emerging drugs for preeclampsia – the endothelium as a target. Expert Opin Emerg Drugs 2015; [Epub ahead of print].